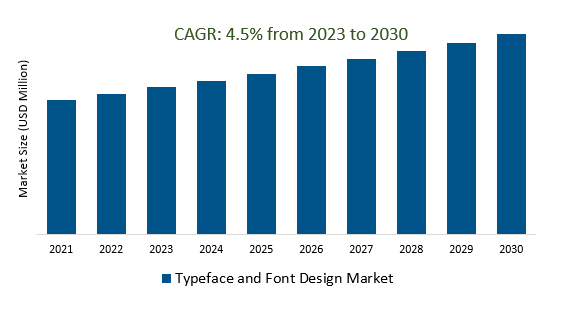
The Global Typeface and Font Design Market Size is estimated to register 4.5% growth over the forecast period from 2023 to 2030.
The market growth is driven by increasing Companies investing in custom typefaces to differentiate their brand and make a lasting impression. This trend is driven by the need for unique visual identities. Leading Companies focusing on AI and Automation, Variable Fonts, Accessibility and Inclusivity, Niche and Specialized Markets, Education, and Training, Typography in User Interfaces (UI), Legal and Licensing Challenges, and others to boost market shares in the industry.
Market Overview
The Typeface and Font Design Market is a dynamic industry experiencing steady growth due to the increasing demand for custom fonts in digital branding, design projects, and accessibility. Digital transformation, customization, and accessibility considerations are significant drivers, while legal complexities, e-commerce platforms, and font marketplaces play pivotal roles. Typeface design tools, education, and community collaborations are shaping the market, and sustainability practices are emerging. As digital communication and design trends evolve, the market's future looks promising, catering to diverse creative and branding needs across various industries.
Market Dynamics
Market Trends- Handwritten and script fonts are beautiful and elegant, and can add a touch of personality to any design project
Handwritten and script fonts are highly sought-after in the Typeface and Font Design Market, valued for their elegance and capacity to impart a personal touch to design projects. Drawing inspiration from calligraphy and human handwriting, these fonts offer versatility, enabling designers to achieve various stylistic goals, from casual to formal. They are widely used in diverse applications, such as wedding invitations, branding, and packaging, and continue to be a significant tool for creative expression in the design industry.
Market Driver- Vintage and retro fonts are in high demand in the typeface and font design market
Vintage and retro fonts are in consistently high demand within the Typeface and Font Design Market, offering nostalgia and a unique charm that spans various design applications. Drawing inspiration from past eras, these fonts transport viewers to different time periods and are favored for poster designs, packaging, and branding. Their enduring popularity, rooted in a blend of vintage aesthetics and contemporary design, ensures their continued relevance in creating visually captivating and nostalgic content.
Market Opportunity- Typography is becoming increasingly important in UI/UX design, as it can help to create a more user-friendly and visually appealing experience
Typography is assuming a growing significance in the realm of UI/UX design, with its pivotal role in shaping user experiences and enhancing the overall visual appeal of digital interfaces. A well-crafted typographic strategy can significantly contribute to user-friendliness by ensuring content is easily readable and navigable. The choice of fonts, their sizes, spacing, and colors all work in harmony to provide a cohesive and intuitive user experience.
Market Share Analysis- Customized Fonts Typeface and Font Design Market will register the fastest growth
The Global Typeface and Font Design Market is analyzed across Customized Fonts, Embedding Fonts, Authorization and Subscription, and others. Customized Fonts is poised to register the fastest growth. Customized fonts in the Typeface and Font Design Market are in high demand as businesses seek unique and personalized typefaces to establish distinctive brand identities. These tailored fonts align with brand values, ensuring a memorable and cohesive presence across various media.
Market Share Analysis- Content Creators held a significant market share in 2023
The Global Typeface and Font Design Market is analyzed across various applications including Content Creators, Independent Software Vendors, Developers, and others. Of these, Content Creators held a significant market share in 2023. Content creators play a pivotal role in the Typeface and Font Design Market, relying on fonts to convey their messages effectively and enhance their content's visual appeal. Their diverse font needs influence market trends, driving the demand for unique and tailored font options to align with specific design goals and brand identities.
Typeface and Font Design Market Segmentation
By Type
- Customized Fonts
- Embedding Fonts
- Authorization and Subscription
- Others
By Application
- Content Creators
- Independent Software Vendors
- Developers
- Others
By Region
- North America (United States, Canada, Mexico)
- Europe (Germany, France, United Kingdom, Spain, Italy, Others)
- Asia Pacific (China, India, Japan, South Korea, Australia, Others)
- Latin America (Brazil, Argentina, Others)
- Middle East and Africa (Saudi Arabia, UAE, Kuwait, Other Middle East, South Africa, Nigeria, Other Africa)
Typeface and Font Design Market Companies
- Adobe Inc (United States)
- Dalton Maag Ltd (United Kingdom)
- Monotype Imaging Holdings Inc (United States)
- Linotype GmbH (Germany)
- Hoefler & Co (United States)
- Grilli Type (Switzerland)
- Emtype Foundry (Spain)
- Parachute Typefoundry (Greece)
- Colophon Foundry (United Kingdom)
- Fontsmith Ltd (United Kingdom)
*List not exhaustive
Typeface and Font Design Market Outlook 2023
1 Market Overview
1.1 Introduction to the Typeface and Font Design Market
1.2 Scope of the Study
1.3 Research Objective
1.3.1 Key Market Scope and Segments
1.3.2 Players Covered
1.3.3 Years Considered
2 Executive Summary
2.1 2023 Typeface and Font Design Industry- Market Statistics
3 Market Dynamics
3.1 Market Drivers
3.2 Market Challenges
3.3 Market Opportunities
3.4 Market Trends
4 Market Factor Analysis
4.1 Porter’s Five Forces
4.2 Market Entropy
4.2.1 Global Typeface and Font Design Market Companies with Area Served
4.2.2 Products Offerings Global Typeface and Font Design Market
5 COVID-19 Impact Analysis and Outlook Scenarios
5.1.1 Covid-19 Impact Analysis
5.1.2 post-COVID-19 Scenario- Low Growth Case
5.1.3 post-COVID-19 Scenario- Reference Growth Case
5.1.4 post-COVID-19 Scenario- Low Growth Case
6 Global Typeface and Font Design Market Trends
6.1 Global Typeface and Font Design Revenue (USD Million) and CAGR (%) by Type (2018-2030)
6.2 Global Typeface and Font Design Revenue (USD Million) and CAGR (%) by Applications (2018-2030)
6.3 Global Typeface and Font Design Revenue (USD Million) and CAGR (%) by regions (2018-2030)
7 Global Typeface and Font Design Market Revenue (USD Million) by Type, and Applications (2018-2022)
7.1 Global Typeface and Font Design Revenue (USD Million) by Type (2018-2022)
7.1.1 Global Typeface and Font Design Revenue (USD Million), Market Share (%) by Type (2018-2022)
7.2 Global Typeface and Font Design Revenue (USD Million) by Applications (2018-2022)
7.2.1 Global Typeface and Font Design Revenue (USD Million), Market Share (%) by Applications (2018-2022)
8 Global Typeface and Font Design Development Regional Status and Outlook
8.1 Global Typeface and Font Design Revenue (USD Million) By Regions (2018-2022)
8.2 North America Typeface and Font Design Revenue (USD Million) by Type, and Application (2018-2022)
8.2.1 North America Typeface and Font Design Revenue (USD Million) by Country (2018-2022)
8.2.2 North America Typeface and Font Design Revenue (USD Million) by Type (2018-2022)
8.2.3 North America Typeface and Font Design Revenue (USD Million) by Applications (2018-2022)
8.3 Europe Typeface and Font Design Revenue (USD Million), by Type, and Applications (USD Million) (2018-2022)
8.3.1 Europe Typeface and Font Design Revenue (USD Million), by Country (2018-2022)
8.3.2 Europe Typeface and Font Design Revenue (USD Million) by Type (2018-2022)
8.3.3 Europe Typeface and Font Design Revenue (USD Million) by Applications (2018-2022)
8.4 Asia Pacific Typeface and Font Design Revenue (USD Million), and Revenue (USD Million) by Type, and Applications (2018-2022)
8.4.1 Asia Pacific Typeface and Font Design Revenue (USD Million) by Country (2018-2022)
8.4.2 Asia Pacific Typeface and Font Design Revenue (USD Million) by Type (2018-2022)
8.4.3 Asia Pacific Typeface and Font Design Revenue (USD Million) by Applications (2018-2022)
8.5 South America Typeface and Font Design Revenue (USD Million), by Type, and Applications (2018-2022)
8.5.1 South America Typeface and Font Design Revenue (USD Million), by Country (2018-2022)
8.5.2 South America Typeface and Font Design Revenue (USD Million) by Type (2018-2022)
8.5.3 South America Typeface and Font Design Revenue (USD Million) by Applications (2018-2022)
8.6 Middle East and Africa Typeface and Font Design Revenue (USD Million), by Type, Technology, Application, Thickness (2018-2022)
8.6.1 Middle East and Africa Typeface and Font Design Revenue (USD Million) by Country (2018-2022)
8.6.2 Middle East and Africa Typeface and Font Design Revenue (USD Million) by Type (2018-2022)
8.6.3 Middle East and Africa Typeface and Font Design Revenue (USD Million) by Applications (2018-2022)
9 Company Profiles
10 Global Typeface and Font Design Market Revenue (USD Million), by Type, and Applications (2023-2030)
10.1 Global Typeface and Font Design Revenue (USD Million) and Market Share (%) by Type (2023-2030)
10.1.1 Global Typeface and Font Design Revenue (USD Million), and Market Share (%) by Type (2023-2030)
10.2 Global Typeface and Font Design Revenue (USD Million) and Market Share (%) by Applications (2023-2030)
10.2.1 Global Typeface and Font Design Revenue (USD Million), and Market Share (%) by Applications (2023-2030)
11 Global Typeface and Font Design Development Regional Status and Outlook Forecast
11.1 Global Typeface and Font Design Revenue (USD Million) By Regions (2023-2030)
11.2 North America Typeface and Font Design Revenue (USD Million) by Type, and Applications (2023-2030)
11.2.1 North America Typeface and Font Design Revenue (USD) Million by Country (2023-2030)
11.2.2 North America Typeface and Font Design Revenue (USD Million), by Type (2023-2030)
11.2.3 North America Typeface and Font Design Revenue (USD Million), Market Share (%) by Applications (2023-2030)
11.3 Europe Typeface and Font Design Revenue (USD Million), by Type, and Applications (2023-2030)
11.3.1 Europe Typeface and Font Design Revenue (USD Million), by Country (2023-2030)
11.3.2 Europe Typeface and Font Design Revenue (USD Million), by Type (2023-2030)
11.3.3 Europe Typeface and Font Design Revenue (USD Million), by Applications (2023-2030)
11.4 Asia Pacific Typeface and Font Design Revenue (USD Million) by Type, and Applications (2023-2030)
11.4.1 Asia Pacific Typeface and Font Design Revenue (USD Million), by Country (2023-2030)
11.4.2 Asia Pacific Typeface and Font Design Revenue (USD Million), by Type (2023-2030)
11.4.3 Asia Pacific Typeface and Font Design Revenue (USD Million), by Applications (2023-2030)
11.5 South America Typeface and Font Design Revenue (USD Million), by Type, and Applications (2023-2030)
11.5.1 South America Typeface and Font Design Revenue (USD Million), by Country (2023-2030)
11.5.2 South America Typeface and Font Design Revenue (USD Million), by Type (2023-2030)
11.5.3 South America Typeface and Font Design Revenue (USD Million), by Applications (2023-2030)
11.6 Middle East and Africa Typeface and Font Design Revenue (USD Million), by Type, and Applications (2023-2030)
11.6.1 Middle East and Africa Typeface and Font Design Revenue (USD Million), by region (2023-2030)
11.6.2 Middle East and Africa Typeface and Font Design Revenue (USD Million), by Type (2023-2030)
11.6.3 Middle East and Africa Typeface and Font Design Revenue (USD Million), by Applications (2023-2030)
12 Methodology and Data Sources
12.1 Methodology/Research Approach
12.1.1 Research Programs/Design
12.1.2 Market Size Estimation
12.1.3 Market Breakdown and Data Triangulation
12.2 Data Sources
12.2.1 Secondary Sources
12.2.2 Primary Sources
12.3 Disclaimer
List of Tables
Table 1 Market Segmentation Analysis
Table 2 Global Typeface and Font Design Market Companies with Areas Served
Table 3 Products Offerings Global Typeface and Font Design Market
Table 4 Low Growth Scenario Forecasts
Table 5 Reference Case Growth Scenario
Table 6 High Growth Case Scenario
Table 7 Global Typeface and Font Design Revenue (USD Million) And CAGR (%) By Type (2018-2030)
Table 8 Global Typeface and Font Design Revenue (USD Million) And CAGR (%) By Applications (2018-2030)
Table 9 Global Typeface and Font Design Revenue (USD Million) And CAGR (%) By Regions (2018-2030)
Table 10 Global Typeface and Font Design Revenue (USD Million) By Type (2018-2022)
Table 11 Global Typeface and Font Design Revenue Market Share (%) By Type (2018-2022)
Table 12 Global Typeface and Font Design Revenue (USD Million) By Applications (2018-2022)
Table 13 Global Typeface and Font Design Revenue Market Share (%) By Applications (2018-2022)
Table 14 Global Typeface and Font Design Market Revenue (USD Million) By Regions (2018-2022)
Table 15 Global Typeface and Font Design Market Share (%) By Regions (2018-2022)
Table 16 North America Typeface and Font Design Revenue (USD Million) By Country (2018-2022)
Table 17 North America Typeface and Font Design Revenue (USD Million) By Type (2018-2022)
Table 18 North America Typeface and Font Design Revenue (USD Million) By Applications (2018-2022)
Table 19 Europe Typeface and Font Design Revenue (USD Million) By Country (2018-2022)
Table 20 Europe Typeface and Font Design Revenue (USD Million) By Type (2018-2022)
Table 21 Europe Typeface and Font Design Revenue (USD Million) By Applications (2018-2022)
Table 22 Asia Pacific Typeface and Font Design Revenue (USD Million) By Country (2018-2022)
Table 23 Asia Pacific Typeface and Font Design Revenue (USD Million) By Type (2018-2022)
Table 24 Asia Pacific Typeface and Font Design Revenue (USD Million) By Applications (2018-2022)
Table 25 South America Typeface and Font Design Revenue (USD Million) By Country (2018-2022)
Table 26 South America Typeface and Font Design Revenue (USD Million) By Type (2018-2022)
Table 27 South America Typeface and Font Design Revenue (USD Million) By Applications (2018-2022)
Table 28 Middle East and Africa Typeface and Font Design Revenue (USD Million) By Region (2018-2022)
Table 29 Middle East and Africa Typeface and Font Design Revenue (USD Million) By Type (2018-2022)
Table 30 Middle East and Africa Typeface and Font Design Revenue (USD Million) By Applications (2018-2022)
Table 31 Financial Analysis
Table 32 Global Typeface and Font Design Revenue (USD Million) By Type (2023-2030)
Table 33 Global Typeface and Font Design Revenue Market Share (%) By Type (2023-2030)
Table 34 Global Typeface and Font Design Revenue (USD Million) By Applications (2023-2030)
Table 35 Global Typeface and Font Design Revenue Market Share (%) By Applications (2023-2030)
Table 36 Global Typeface and Font Design Market Revenue (USD Million), And Revenue (USD Million) By Regions (2023-2030)
Table 37 North America Typeface and Font Design Revenue (USD)By Country (2023-2030)
Table 38 North America Typeface and Font Design Revenue (USD Million) By Type (2023-2030)
Table 39 North America Typeface and Font Design Revenue (USD Million) By Applications (2023-2030)
Table 40 Europe Typeface and Font Design Revenue (USD Million) By Country (2023-2030)
Table 41 Europe Typeface and Font Design Revenue (USD Million) By Type (2023-2030)
Table 42 Europe Typeface and Font Design Revenue (USD Million) By Applications (2023-2030)
Table 43 Asia Pacific Typeface and Font Design Revenue (USD Million) By Country (2023-2030)
Table 44 Asia Pacific Typeface and Font Design Revenue (USD Million) By Type (2023-2030)
Table 45 Asia Pacific Typeface and Font Design Revenue (USD Million) By Applications (2023-2030)
Table 46 South America Typeface and Font Design Revenue (USD Million) By Country (2023-2030)
Table 47 South America Typeface and Font Design Revenue (USD Million) By Type (2023-2030)
Table 48 South America Typeface and Font Design Revenue (USD Million) By Applications (2023-2030)
Table 49 Middle East and Africa Typeface and Font Design Revenue (USD Million) By Region (2023-2030)
Table 50 Middle East and Africa Typeface and Font Design Revenue (USD Million) By Region (2023-2030)
Table 51 Middle East and Africa Typeface and Font Design Revenue (USD Million) By Type (2023-2030)
Table 52 Middle East and Africa Typeface and Font Design Revenue (USD Million) By Applications (2023-2030)
Table 53 Research Programs/Design for This Report
Table 54 Key Data Information from Secondary Sources
Table 55 Key Data Information from Primary Sources
List of Figures
Figure 1 Market Scope
Figure 2 Porter’s Five Forces
Figure 3 Global Typeface and Font Design Revenue (USD Million) By Type (2018-2022)
Figure 4 Global Typeface and Font Design Revenue Market Share (%) By Type (2022)
Figure 5 Global Typeface and Font Design Revenue (USD Million) By Applications (2018-2022)
Figure 6 Global Typeface and Font Design Revenue Market Share (%) By Applications (2022)
Figure 7 Global Typeface and Font Design Market Revenue (USD Million) By Regions (2018-2022)
Figure 8 Global Typeface and Font Design Market Share (%) By Regions (2022)
Figure 9 North America Typeface and Font Design Revenue (USD Million) By Country (2018-2022)
Figure 10 North America Typeface and Font Design Revenue (USD Million) By Type (2018-2022)
Figure 11 North America Typeface and Font Design Revenue (USD Million) By Applications (2018-2022)
Figure 12 Europe Typeface and Font Design Revenue (USD Million) By Country (2018-2022)
Figure 13 Europe Typeface and Font Design Revenue (USD Million) By Type (2018-2022)
Figure 14 Europe Typeface and Font Design Revenue (USD Million) By Applications (2018-2022)
Figure 15 Asia Pacific Typeface and Font Design Revenue (USD Million) By Country (2018-2022)
Figure 16 Asia Pacific Typeface and Font Design Revenue (USD Million) By Type (2018-2022)
Figure 17 Asia Pacific Typeface and Font Design Revenue (USD Million) By Applications (2018-2022)
Figure 18 South America Typeface and Font Design Revenue (USD Million) By Country (2018-2022)
Figure 19 South America Typeface and Font Design Revenue (USD Million) By Type (2018-2022)
Figure 20 South America Typeface and Font Design Revenue (USD Million) By Applications (2018-2022)
Figure 21 Middle East and Africa Typeface and Font Design Revenue (USD Million) By Region (2018-2022)
Figure 22 Middle East and Africa Typeface and Font Design Revenue (USD Million) By Type (2018-2022)
Figure 23 Middle East and Africa Typeface and Font Design Revenue (USD Million) By Applications (2018-2022)
Figure 24 Global Typeface and Font Design Revenue (USD Million) By Type (2023-2030)
Figure 25 Global Typeface and Font Design Revenue Market Share (%) By Type (2030)
Figure 26 Global Typeface and Font Design Revenue (USD Million) By Applications (2023-2030)
Figure 27 Global Typeface and Font Design Revenue Market Share (%) By Applications (2030)
Figure 28 Global Typeface and Font Design Market Revenue (USD Million) By Regions (2023-2030)
Figure 29 North America Typeface and Font Design Revenue (USD Million) By Country (2023-2030)
Figure 30 North America Typeface and Font Design Revenue (USD Million) By Type (2023-2030)
Figure 31 North America Typeface and Font Design Revenue (USD Million) By Applications (2023-2030)
Figure 32 Europe Typeface and Font Design Revenue (USD Million) By Country (2023-2030)
Figure 33 Europe Typeface and Font Design Revenue (USD Million) By Type (2023-2030)
Figure 34 Europe Typeface and Font Design Revenue (USD Million) By Applications (2023-2030)
Figure 35 Asia Pacific Typeface and Font Design Revenue (USD Million) By Country (2023-2030)
Figure 36 Asia Pacific Typeface and Font Design Revenue (USD Million) By Type (2023-2030)
Figure 37 Asia Pacific Typeface and Font Design Revenue (USD Million) By Applications (2023-2030)
Figure 38 South America Typeface and Font Design Revenue (USD Million) By Country (2023-2030)
Figure 39 South America Typeface and Font Design Revenue (USD Million) By Type (2023-2030)
Figure 40 South America Typeface and Font Design Revenue (USD Million) By Applications (2023-2030)
Figure 41 Middle East and Africa Typeface and Font Design Revenue (USD Million) By Region (2023-2030)
Figure 42 Middle East and Africa Typeface and Font Design Revenue (USD Million) By Region (2023-2030)
Figure 43 Middle East and Africa Typeface and Font Design Revenue (USD Million) By Type (2023-2030)
Figure 44 Middle East and Africa Typeface and Font Design Revenue (USD Million) By Applications (2023-2030)
Figure 45 Bottom-Up and Top-Down Approaches for This Report
Figure 46 Data Triangulation
