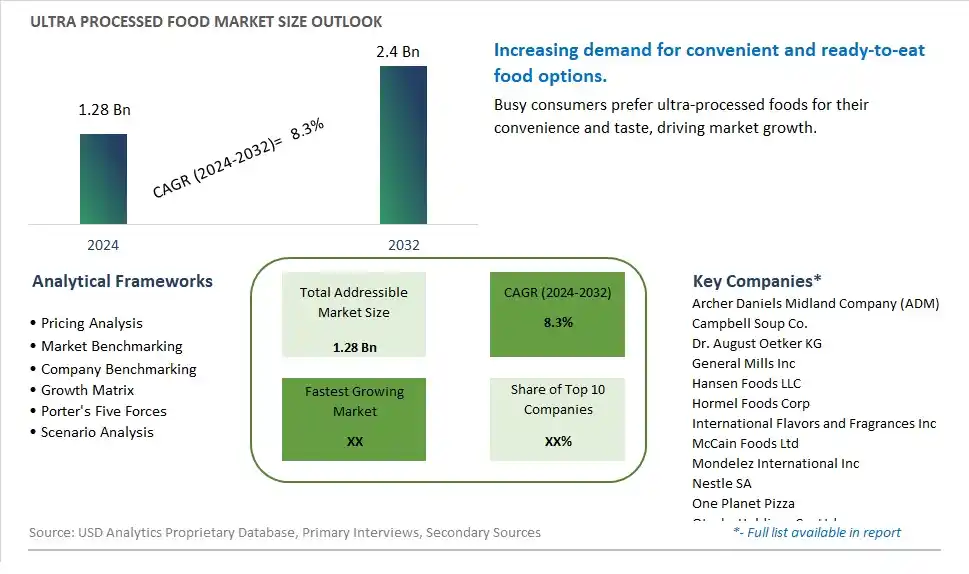
Global Ultra Processed Food Market Size is valued at $1.28 Billion in 2024 and is forecast to register a growth rate (CAGR) of 8.3% to reach $2.4 Billion by 2032.
The global Ultra Processed Food Market Comprehensive Study analyzes and forecasts the market size across 6 regions and 24 countries for diverse segments -By Product (Chocolate and Sugar Confectionery, Beverages, Ready-Made and Convenience Food, Salty Snacks, Others), By Distribution Channel (Offline, Online)
An Introduction to Ultra Processed Food Market
In 2024, the ultra-processed food market reflects the complex interplay between convenience, taste, and health considerations in modern dietary patterns. Defined by extensive industrial processing and the inclusion of additives, preservatives, and flavor enhancers, ultra-processed foods encompass a wide range of products, from ready-to-eat meals and snacks to sugary beverages and confectionery. Despite growing awareness of the adverse health effects associated with excessive consumption of ultra-processed foods, their convenience, affordability, and palatability continue to drive demand, especially in urbanized and fast-paced lifestyles. Moreover, aggressive marketing and widespread availability further contribute to their ubiquity in global food environments. However, mounting concerns about their nutritional quality, contribution to chronic diseases, and environmental impact are prompting calls for greater regulation, reformulation, and consumer education. As dietary trends shift towards whole, minimally processed foods, the ultra-processed food market faces scrutiny and adaptation to meet evolving consumer preferences and health imperatives.
Ultra Processed Food Competitive Landscape
The market report analyses the leading companies in the industry including Archer Daniels Midland Company (ADM), Campbell Soup Co., Dr. August Oetker KG, General Mills Inc, Hansen Foods LLC, Hormel Foods Corp, International Flavors and Fragrances Inc, McCain Foods Ltd, Mondelez International Inc, Nestle SA, One Planet Pizza, Otsuka Holdings Co. Ltd, Sudzucker AG, Sysco Corp, The Kraft Heinz Co., Tyson Foods Inc, Unilever PLC, and Others.
Ultra Processed Food Market Dynamics
Ultra Processed Food Market Trend: Increasing Consumer Demand for Convenience and Ready-to-Eat Options
A prominent market trend in the ultra-processed food industry is the rising consumer demand for convenience and ready-to-eat options. Busy lifestyles, hectic schedules, and changing dietary preferences have led consumers to seek out convenient food solutions that require minimal preparation time. Ultra-processed foods, which often come in the form of pre-packaged meals, snacks, and beverages, offer convenience and accessibility, making them appealing choices for consumers looking for quick and easy meal solutions. This trend is driven by the need for on-the-go options that fit into modern lifestyles, as well as the growing preference for hassle-free eating experiences without compromising taste or quality.
Market Driver: Expansion of Distribution Channels and Retail Presence
A key market driver for ultra-processed foods is the expansion of distribution channels and retail presence, both online and offline. Manufacturers and retailers are increasingly focusing on enhancing their distribution networks to reach a wider audience and increase accessibility to their products. This includes partnerships with online grocery platforms, meal delivery services, convenience stores, and supermarkets to ensure that ultra-processed foods are readily available to consumers across various channels. Additionally, the strategic placement of ultra-processed food products in high-traffic areas within retail stores and online marketplaces helps to boost visibility and drive sales. The expansion of distribution channels enables manufacturers to tap into new markets, attract more customers, and capitalize on the growing demand for ultra-processed foods.
Market Opportunity: Innovation in Healthier Formulations and Ingredients
An opportunity for the ultra-processed food market lies in the innovation of healthier formulations and ingredients to meet evolving consumer preferences for nutritious options. As health and wellness concerns continue to influence purchasing decisions, there is a growing demand for ultra-processed foods that offer better nutritional profiles, reduced additives, and cleaner labels. Manufacturers have the opportunity to reformulate their products with healthier ingredients such as whole grains, plant-based proteins, and natural sweeteners, while minimizing the use of artificial flavors, colors, and preservatives. By aligning with consumer preferences for healthier options, manufacturers can differentiate their products, attract health-conscious consumers, and capitalize on the growing trend towards better-for-you ultra-processed foods.
Ultra Processed Food Market Share Analysis: Ready-Made and Convenience Food held the dominant market share in 2024
In the Ultra Processed Food Market segmented by products, the Ready-Made and Convenience Food category is the largest segment. This dominance is primarily due to the convenience, accessibility, and busy lifestyles of consumers, leading to a high demand for pre-packaged, easy-to-prepare meals and snacks. Ready-made and convenience foods offer consumers quick and hassle-free options for satisfying their hunger and cravings, whether at home, work, or on-the-go. These products encompass a wide range of items such as frozen meals, microwave dinners, instant noodles, and snack bars, catering to diverse taste preferences and dietary needs. Further, the global trend towards urbanization and changing dietary habits further drives the popularity of ready-made and convenience foods, as consumers seek convenient solutions to meet their nutritional requirements amidst their hectic schedules. As a result, manufacturers and retailers focus on innovating and expanding their offerings in the ready-made and convenience food category to meet the growing demand, ensuring its continued dominance in the ultra-processed food market.
Ultra Processed Food Market Share Analysis: Online market is poised to register the fastest growth rae over the forecast period to 2032
In the Ultra Processed Food Market segmented by distribution channels, the Online category is the fastest-growing segment. This rapid growth is primarily driven by the increasing adoption of e-commerce platforms for purchasing food and grocery items. Online channels offer consumers convenience, a wide selection of products, and the flexibility to shop from the comfort of their homes, contributing to their popularity. Further, the COVID-19 pandemic has accelerated the shift towards online shopping as consumers prioritize safety and social distancing measures. Additionally, online platforms provide opportunities for ultra-processed food manufacturers and retailers to reach a broader audience, implement targeted marketing strategies, and offer personalized recommendations based on consumer preferences. As a result, companies are investing in enhancing their online presence, optimizing digital marketing efforts, and ensuring seamless delivery services to capitalize on the growing demand for ultra-processed foods through online channels, driving the rapid expansion of this segment in the market.
Ultra Processed Food Market Segmentation
By Product
Chocolate and Sugar Confectionery
Beverages
Ready-Made and Convenience Food
Salty Snacks
Others
By Distribution Channel
Offline
Online
Countries Analyzed
North America (US, Canada, Mexico)
Europe (Germany, UK, France, Spain, Italy, Russia, Rest of Europe)
Asia Pacific (China, India, Japan, South Korea, Australia, South East Asia, Rest of Asia)
South America (Brazil, Argentina, Rest of South America)
Middle East and Africa (Saudi Arabia, UAE, Rest of Middle East, South Africa, Egypt, Rest of Africa)
Ultra Processed Food Companies Profiled in the Study
Archer Daniels Midland Company (ADM)
Campbell Soup Co.
Dr. August Oetker KG
General Mills Inc
Hansen Foods LLC
Hormel Foods Corp
International Flavors and Fragrances Inc
McCain Foods Ltd
Mondelez International Inc
Nestle SA
One Planet Pizza
Otsuka Holdings Co. Ltd
Sudzucker AG
Sysco Corp
The Kraft Heinz Co.
Tyson Foods Inc
Unilever PLC
*- List Not Exhaustive
Chapter 1. TABLE OF CONTENTS
Chapter 2. Introduction to Ultra Processed Food Market
2.1. Market Overview
2.2. Key Statistics and Report Highlights
2.3. Scope of the Comprehensive Study
2.3.1. Market Definition
2.3.2 Countries and Regions Covered
2.3.3 Research Objective
2.3.4 Units, Currency, and Conversions
2.3.5 Industry Value Chain
2.4. Key Market Segments
2.5. Key Companies
2.6. Study Period
Chapter 3. Strategic Analysis Review
3.1. Ultra Processed Food Pricing Analysis and Forecast
3.2. Porter’s Five Forces
3.3. Market Ecosystem
3.4. SWOT Analysis
3.5. Regulatory Scenario
3.3. Effects of Inflation, Russia-Ukraine War, moderating economic growth, and other macroeconomic factors
Chapter 4. Competitive Landscape
4.1. Market Share Analysis
4.1.1. Global Ultra Processed Food Market Share by Company, 2023
4.1.2. Product Offerings of Leading Ultra Processed Food Companies
4.2. Market Entropy
4.2.1. New Product Launches in the Industry
4.2.2. Mergers, Acquisitions, Joint ventures, and Partnerships
4.3. Key Strategies and Best Practices
Chapter 5. Global Market Projections: Best, Reference, and Low Case Scenarios
5.1. Growth Analysis- Case Scenario Definitions
5.2. Low Growth Case Scenario Forecasts
5.3. Reference Growth Case Scenario Forecasts
5.4. High Growth Case Scenario Forecasts
Chapter 6. Market Dynamics
6.1. Ultra Processed Food Market Drivers
6.2. Ultra Processed Food Market Challenges
6.6. Ultra Processed Food Market Opportunities
6.4. Ultra Processed Food Market Trends
Chapter 7. Global Ultra Processed Food Market Outlook Trends
7.1. Global Ultra Processed Food Revenue (USD Million) and CAGR (%) by Type (2021-2032)
7.2. Global Ultra Processed Food Revenue (USD Million) and CAGR (%) by Application (2021-2032)
7.3. Global Ultra Processed Food Revenue (USD Million) and CAGR (%) by Product (2021-2032)
By Product
Chocolate and Sugar Confectionery
Beverages
Ready-Made and Convenience Food
Salty Snacks
Others
By Distribution Channel
Offline
Online
Chapter 8. Global Ultra Processed Food Regional Analysis and Outlook
8.1. Global Ultra Processed Food Revenue (USD Million) By Regions (2021- 2032)
8.2. North America Ultra Processed Food Revenue (USD Million) by Country (2021-2032)
8.2.1. United States Ultra Processed Food Regional Analysis and Outlook
8.2.2. Canada Ultra Processed Food Regional Analysis and Outlook
8.2.3. Mexico Ultra Processed Food Regional Analysis and Outlook
8.3. Europe Ultra Processed Food Revenue (USD Million), by Country (2021-2032)
8.3.1. Germany Ultra Processed Food Regional Analysis and Outlook
8.3.2. France Ultra Processed Food Regional Analysis and Outlook
8.3.3. United Kingdom Ultra Processed Food Regional Analysis and Outlook
8.3.4. Spain Ultra Processed Food Regional Analysis and Outlook
8.3.5. Italy Ultra Processed Food Regional Analysis and Outlook
8.3.6. Russia Ultra Processed Food Regional Analysis and Outlook
8.3.7. Rest of Europe Ultra Processed Food Regional Analysis and Outlook
8.4. Asia Pacific Ultra Processed Food Revenue (USD Million) by Country (2021-2032)
8.4.1. China Ultra Processed Food Regional Analysis and Outlook
8.4.2. Japan Ultra Processed Food Regional Analysis and Outlook
8.4.3. India Ultra Processed Food Regional Analysis and Outlook
8.4.4. South Korea Ultra Processed Food Regional Analysis and Outlook
8.4.5. Australia Ultra Processed Food Regional Analysis and Outlook
8.4.6. South East Asia Ultra Processed Food Regional Analysis and Outlook
8.4.7. Rest of Asia Pacific Ultra Processed Food Regional Analysis and Outlook
8.5. South America Ultra Processed Food Revenue (USD Million), by Country (2021-2032)
8.5.1. Brazil Ultra Processed Food Regional Analysis and Outlook
8.5.2. Argentina Ultra Processed Food Regional Analysis and Outlook
8.5.3. Rest of South America Ultra Processed Food Regional Analysis and Outlook
8.6. Middle East and Africa Ultra Processed Food Revenue (USD Million) by Country (2021-2032)
8.6.1. Middle East Ultra Processed Food Regional Analysis and Outlook
8.6.2. Africa Ultra Processed Food Regional Analysis and Outlook
Chapter 9. North America Ultra Processed Food Analysis and Outlook
9.1. North America Ultra Processed Food Revenue (USD Million) by Segments (2021-2032)
9.1.1. North America Ultra Processed Food Revenue (USD Million) by Type (2021-2032)
9.1.2. North America Ultra Processed Food Revenue (USD Million) by Application (2021-2032)
9.1.3. North America Ultra Processed Food Revenue (USD Million) by Product (2021-2032)
By Product
Chocolate and Sugar Confectionery
Beverages
Ready-Made and Convenience Food
Salty Snacks
Others
By Distribution Channel
Offline
Online
Chapter 10. Europe Ultra Processed Food Analysis and Outlook
10.1. Europe Ultra Processed Food Revenue (USD Million), by Segments (USD Million) (2021-2032)
10.1.1. Europe Ultra Processed Food Revenue (USD Million) by Type (2021-2032)
10.1.2. Europe Ultra Processed Food Revenue (USD Million) by Application (2021-2032)
10.1.3. Europe Ultra Processed Food Revenue (USD Million) by Product (2021-2032)
By Product
Chocolate and Sugar Confectionery
Beverages
Ready-Made and Convenience Food
Salty Snacks
Others
By Distribution Channel
Offline
Online
Chapter 11. Asia Pacific Ultra Processed Food Analysis and Outlook
11.1. Asia Pacific Ultra Processed Food Revenue (USD Million), and Revenue (USD Million) by Segments (2021-2032)
11.1.1. Asia Pacific Ultra Processed Food Revenue (USD Million) by Type (2021-2032)
11.1.2. Asia Pacific Ultra Processed Food Revenue (USD Million) by Application (2021-2032)
11.1.3. Asia Pacific Ultra Processed Food Revenue (USD Million) by Product (2021-2032)
By Product
Chocolate and Sugar Confectionery
Beverages
Ready-Made and Convenience Food
Salty Snacks
Others
By Distribution Channel
Offline
Online
Chapter 12. South America Ultra Processed Food Analysis and Outlook
12.1. South America Ultra Processed Food Revenue (USD Million), by Segments (2021-2032)
12.1.1. South America Ultra Processed Food Revenue (USD Million) by Type (2021-2032)
12.1.2. South America Ultra Processed Food Revenue (USD Million) by Application (2021-2032)
12.1.3. South America Ultra Processed Food Revenue (USD Million) by Product (2021-2032)
By Product
Chocolate and Sugar Confectionery
Beverages
Ready-Made and Convenience Food
Salty Snacks
Others
By Distribution Channel
Offline
Online
Chapter 13. Middle East and Africa Ultra Processed Food Analysis and Outlook
13.1. Middle East and Africa Ultra Processed Food Revenue (USD Million), by Segments (2021-2032)
13.1.1. Middle East and Africa Ultra Processed Food Revenue (USD Million) by Type (2021-2032)
13.1.2. Middle East and Africa Ultra Processed Food Revenue (USD Million) by Application (2021-2032)
13.1.3. Middle East and Africa Ultra Processed Food Revenue (USD Million) by Product (2021-2032)
By Product
Chocolate and Sugar Confectionery
Beverages
Ready-Made and Convenience Food
Salty Snacks
Others
By Distribution Channel
Offline
Online
Chapter 14. Ultra Processed Food Company Profiles
14.1 Business Overview
14.2 Product Profiles
14.3 SWOT Profiles
14.5 Recent Developments
14.6 Financial Profile
List of Companies
Archer Daniels Midland Company (ADM)
Campbell Soup Co.
Dr. August Oetker KG
General Mills Inc
Hansen Foods LLC
Hormel Foods Corp
International Flavors and Fragrances Inc
McCain Foods Ltd
Mondelez International Inc
Nestle SA
One Planet Pizza
Otsuka Holdings Co. Ltd
Sudzucker AG
Sysco Corp
The Kraft Heinz Co.
Tyson Foods Inc
Unilever PLC
15. Methodology and Data Sources
15.1 Customization Offerings
15.2 Subscription Services
15.3 Related Reports
15.4 Publisher Expertise
LIST OF TABLES
Table 1 Market Segmentation Analysis
Table 2 Global Ultra Processed Food Market Share of Leading Companies, 2023
Table 3 Product Offerings of Leading Companies
Table 4 Low Growth Scenario Forecasts
Table 5 Reference Case Growth Scenario
Table 6 High Growth Case Scenario
Table 7 Global Ultra Processed Food Revenue (USD Million) And CAGR (%) By Type (2021-2032)
Table 8 Global Ultra Processed Food Revenue (USD Million) And CAGR (%) By Application (2021-2032)
Table 9 Global Ultra Processed Food Revenue (USD Million) And CAGR (%) By Product (2021-2032)
Table 10 Global Ultra Processed Food Market Revenue (USD Million) By Regions (2021-2032)
Table 11 Global Ultra Processed Food Market Share (%) By Regions (2021-2032)
Table 12 North America Ultra Processed Food Revenue (USD Million) By Country (2021-2032)
Table 13 Europe Ultra Processed Food Revenue (USD Million) By Country (2021-2032)
Table 14 Asia Pacific Ultra Processed Food Revenue (USD Million) By Country (2021-2032)
Table 15 South America Ultra Processed Food Revenue (USD Million) By Country (2021-2032)
Table 16 Middle East and Africa Ultra Processed Food Revenue (USD Million) By Region (2021-2032)
Table 17 North America Ultra Processed Food Revenue (USD Million) By Type (2021-2032)
Table 18 North America Ultra Processed Food Revenue (USD Million) By Application (2021-2032)
Table 19 North America Ultra Processed Food Revenue (USD Million) By Product (2021-2032)
Table 20 Europe Ultra Processed Food Revenue (USD Million) By Type (2021-2032)
Table 21 Europe Ultra Processed Food Revenue (USD Million) By Application (2021-2032)
Table 22 Europe Ultra Processed Food Revenue (USD Million) By Product (2021-2032)
Table 23 Asia Pacific Ultra Processed Food Revenue (USD Million) By Type (2021-2032)
Table 24 Asia Pacific Ultra Processed Food Revenue (USD Million) By Application (2021-2032)
Table 25 Asia Pacific Ultra Processed Food Revenue (USD Million) By Product (2021-2032)
Table 26 South America Ultra Processed Food Revenue (USD Million) By Type (2021-2032)
Table 27 South America Ultra Processed Food Revenue (USD Million) By Application (2021-2032)
Table 28 South America Ultra Processed Food Revenue (USD Million) By Product (2021-2032)
Table 29 Middle East and Africa Ultra Processed Food Revenue (USD Million) By Type (2021-2032)
Table 30 Middle East and Africa Ultra Processed Food Revenue (USD Million) By Application (2021-2032)
Table 31 Middle East and Africa Ultra Processed Food Revenue (USD Million) By Product (2021-2032)
LIST OF FIGURES
Figure 1. Market Scope
Figure 2. Pricing Forecasts Per Unit, 2023- 2032
Figure 3. Porter’s Five Forces
Figure 4. Global Ultra Processed Food Market Revenue (USD Million) By Regions (2021-2032)
Figure 5. Global Ultra Processed Food Market Share (%) By Regions (2023)
Figure 6. North America Ultra Processed Food Revenue (USD Million) By Country (2021-2032)
Figure 7. United States Ultra Processed Food Revenue (USD Million) By Country (2021-2032)
Figure 8. Canada Ultra Processed Food Revenue (USD Million) By Country (2021-2032)
Figure 9. Mexico Ultra Processed Food Revenue (USD Million) By Country (2021-2032)
Figure 10. Europe Ultra Processed Food Revenue (USD Million) By Country (2021-2032)
Figure 11. Germany Ultra Processed Food Revenue (USD Million) By Country (2021-2032)
Figure 12. France Ultra Processed Food Revenue (USD Million) By Country (2021-2032)
Figure 13. United Kingdom Ultra Processed Food Revenue (USD Million) By Country (2021-2032)
Figure 14. Spain Ultra Processed Food Revenue (USD Million) By Country (2021-2032)
Figure 15. Italy Ultra Processed Food Revenue (USD Million) By Country (2021-2032)
Figure 16. Russia Ultra Processed Food Revenue (USD Million) By Country (2021-2032)
Figure 17. Rest of Europe Ultra Processed Food Revenue (USD Million) By Country (2021-2032)
Figure 11. Asia Pacific Ultra Processed Food Revenue (USD Million) By Country (2021-2032)
Figure 12. China Ultra Processed Food Revenue (USD Million) By Country (2021-2032)
Figure 13. Japan Ultra Processed Food Revenue (USD Million) By Country (2021-2032)
Figure 14. India Ultra Processed Food Revenue (USD Million) By Country (2021-2032)
Figure 15. South Korea Ultra Processed Food Revenue (USD Million) By Country (2021-2032)
Figure 16. Australia Ultra Processed Food Revenue (USD Million) By Country (2021-2032)
Figure 17. South East Asia Ultra Processed Food Revenue (USD Million) By Country (2021-2032)
Figure 18. South America Ultra Processed Food Revenue (USD Million) By Country (2021-2032)
Figure 19. Brazil Ultra Processed Food Revenue (USD Million) By Country (2021-2032)
Figure 20. Argentina Ultra Processed Food Revenue (USD Million) By Country (2021-2032)
Figure 21. Rest of Asia Pacific Ultra Processed Food Revenue (USD Million) By Country (2021-2032)
Figure 22. Middle East and Africa Ultra Processed Food Revenue (USD Million) By Region (2021-2032)
Figure 23. Saudi Arabia Ultra Processed Food Revenue (USD Million) By Region (2021-2032)
Figure 24. The UAE Ultra Processed Food Revenue (USD Million) By Region (2021-2032)
Figure 25. Rest of Middle East Ultra Processed Food Revenue (USD Million) By Region (2021-2032)
Figure 26. South Africa Ultra Processed Food Revenue (USD Million) By Region (2021-2032)
Figure 27. Africa Ultra Processed Food Revenue (USD Million) By Region (2021-2032)
Figure 28. North America Ultra Processed Food Revenue (USD Million) By Type (2021-2032)
Figure 29. North America Ultra Processed Food Revenue (USD Million) By Application (2021-2032)
Figure 30. North America Ultra Processed Food Revenue (USD Million) By Product (2021-2032)
Figure 31. Europe Ultra Processed Food Revenue (USD Million) By Type (2021-2032)
Figure 32. Europe Ultra Processed Food Revenue (USD Million) By Application (2021-2032)
Figure 33. Europe Ultra Processed Food Revenue (USD Million) By Product (2021-2032)
Figure 34. Asia Pacific Ultra Processed Food Revenue (USD Million) By Type (2021-2032)
Figure 35. Asia Pacific Ultra Processed Food Revenue (USD Million) By Application (2021-2032)
Figure 36. Asia Pacific Ultra Processed Food Revenue (USD Million) By Product (2021-2032)
Figure 37. South America Ultra Processed Food Revenue (USD Million) By Type (2021-2032)
Figure 38. South America Ultra Processed Food Revenue (USD Million) By Application (2021-2032)
Figure 39. South America Ultra Processed Food Revenue (USD Million) By Product (2021-2032)
Figure 40. Middle East and Africa Ultra Processed Food Revenue (USD Million) By Type (2021-2032)
Figure 41. Middle East and Africa Ultra Processed Food Revenue (USD Million) By Application (2021-2032)
Figure 42. Middle East and Africa Ultra Processed Food Revenue (USD Million) By Product (2021-2032)
By Product
Chocolate and Sugar Confectionery
Beverages
Ready-Made and Convenience Food
Salty Snacks
Others
By Distribution Channel
Offline
Online
Countries Analyzed
North America (US, Canada, Mexico)
Europe (Germany, UK, France, Spain, Italy, Russia, Rest of Europe)
Asia Pacific (China, India, Japan, South Korea, Australia, South East Asia, Rest of Asia)
South America (Brazil, Argentina, Rest of South America)
Middle East and Africa (Saudi Arabia, UAE, Rest of Middle East, South Africa, Egypt, Rest of Africa)
