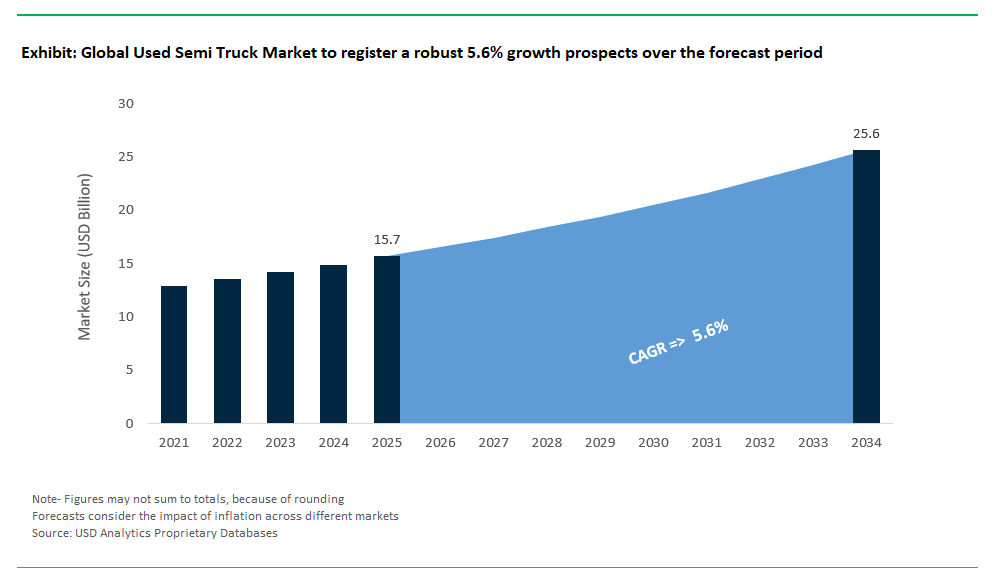
The Global Used Semi Truck Market Size is estimated at $15.7 Billion in 2025 and is forecast to register an annual growth rate (CAGR) of 5.6% to reach $25.7 Billion by 2034.
The global Used Semi Truck Market Study analyzes and forecasts the market size across 6 regions and 24 countries for diverse segments -By Sales Channel (Franchised Dealer, Independent Dealer, Peer-to-Peer), By Propulsion (ICE, Electric).
An Introduction to Used Semi Truck Market in 2025
The Used Semi Truck market is expanding as businesses and logistics companies seek cost-effective solutions for their transportation needs. Used semi trucks provide an affordable alternative to new trucks, offering value while maintaining operational efficiency. The market is driven by factors such as the growing demand for freight and logistics services, the high cost of new trucks, and the increasing lifespan of commercial vehicles due to advancements in technology and maintenance practices. Additionally, the availability of online marketplaces and auctions is facilitating the buying and selling of used semi trucks. As the logistics industry continues to grow and businesses look for budget-friendly options, the used semi truck market is expected to experience continued expansion.
Used Semi Truck Competitive Landscape
The market report analyses the leading companies in the industry including AB Volvo, Arrow Truck Sales Inc, International Used Truck Centers, IronPlanet Inc, IVECO S.p.A, MAN, PACCAR Financial Used Truck Center, Ryder System Inc, Sandhills Global, Scania, Tata Motors Ltd, and others.
Used Semi Truck Market Dynamics
Market Trend: Increasing Demand for Cost-Effective Transportation Solutions
A prominent trend in the used semi truck market is the increasing demand for cost-effective transportation solutions. As freight companies and independent operators seek to optimize their operational costs, used semi trucks are becoming a popular choice due to their lower upfront cost compared to new trucks. The availability of well-maintained, high-quality used trucks that offer good performance at a reduced price is driving this trend. This shift reflects a broader trend towards cost efficiency and value optimization in the transportation industry, where operators are looking for ways to balance investment and operational expenses.
Market Driver: Growth in the Freight and Logistics Industry
The primary driver of the used semi truck market is the growth in the freight and logistics industry. As global trade volumes increase and supply chains expand, there is a rising demand for transportation assets, including semi trucks. The need to replace aging fleets and the preference for budget-friendly options are driving the market for used semi trucks. This growth is supported by the expanding e-commerce sector and the need for reliable freight solutions, which continually fuels the demand for both new and used transportation equipment.
Market Opportunity: Enhanced Inspection and Certification Services
An emerging opportunity in the used semi truck market is the enhancement of inspection and certification services. Providing detailed inspection reports and certification can increase buyer confidence and value in used semi trucks. This opportunity involves offering comprehensive pre-sale inspections, warranties, and certification programs to assure buyers of the quality and reliability of used trucks. Companies that implement rigorous inspection processes and offer certification can differentiate themselves in the market, attract more buyers, and potentially command higher prices
Used Semi Truck Market Share Analysis: Franchised Dealer generated the highest revenue in 2024
In the Used Semi Truck Market, Franchised Dealers represent the largest segment due to their established networks, comprehensive services, and trustworthiness among buyers. Franchised dealers, typically affiliated with original equipment manufacturers (OEMs), offer a range of benefits that include certified pre-owned vehicles, warranty options, and extensive after-sales support. These dealers are known for their rigorous inspection processes and adherence to quality standards, which instills confidence in buyers seeking reliable and well-maintained used semi trucks. Additionally, franchised dealers often have access to a broader inventory of vehicles and a more structured sales process compared to independent or peer-to-peer channels. The reliability, service guarantees, and brand recognition associated with franchised dealers make them the preferred choice for many buyers, solidifying their position as the largest segment in this market.
Used Semi Truck Market Share Analysis: Electric is poised to register the fastest CAGR over the forecast period
The Electric propulsion segment is the fastest growing in the Used Semi Truck Market due to the increasing emphasis on sustainability, fuel efficiency, and reducing operational costs. As environmental regulations become more stringent and governments offer incentives for greener technologies, there is a notable shift towards electric semi trucks. This segment's rapid growth is driven by advancements in battery technology, reducing costs, and improving the performance and range of electric vehicles. Additionally, the evolving infrastructure for electric vehicle charging and the decreasing total cost of ownership are attracting more fleet operators and logistics companies to consider electric semi trucks. This transition is further accelerated by rising fuel prices and the growing corporate commitment to reducing carbon footprints. The electric propulsion segment’s growth reflects broader trends towards sustainability and technological innovation within the transportation sector.
Used Semi Truck Market Report Scope
|
Parameter
|
Details
|
|
Market Size (2025)
|
$ 15.7 Billion
|
|
Market Size (2034)
|
$ 25.7 Billion
|
|
Market Growth Rate
|
5.6%
|
|
Segments
|
By Sales Channel (Franchised Dealer, Independent Dealer, Peer-to-Peer), By Propulsion (ICE, Electric)
|
|
Study Period
|
2019- 2024 and 2025-2034
|
|
Units
|
Revenue (USD)
|
|
Qualitative Analysis
|
Porter’s Five Forces, SWOT Profile, Market Share, Scenario Forecasts, Market Ecosystem, Company Ranking, Market Dynamics, Industry Benchmarking
|
|
Companies
|
AB Volvo, Arrow Truck Sales Inc, International Used Truck Centers, IronPlanet Inc, IVECO S.p.A, MAN, PACCAR Financial Used Truck Center, Ryder System Inc, Sandhills Global, Scania, Tata Motors Ltd
|
|
Countries
|
US, Canada, Mexico, Germany, France, Spain, Italy, UK, Russia, China, India, Japan, South Korea, Australia, South East Asia, Brazil, Argentina, Middle East, Africa
|
Used Semi Truck Market Segmentation
By Sales Channel
Franchised Dealer
Independent Dealer
Peer-to-Peer
By Propulsion
ICE
Electric
Countries Analyzed
North America (US, Canada, Mexico)
Europe (Germany, UK, France, Spain, Italy, Russia, Rest of Europe)
Asia Pacific (China, India, Japan, South Korea, Australia, South East Asia, Rest of Asia)
South America (Brazil, Argentina, Rest of South America)
Middle East and Africa (Saudi Arabia, UAE, Rest of Middle East, South Africa, Egypt, Rest of Africa)
Used Semi Truck Companies Profiled in the Study
AB Volvo
Arrow Truck Sales Inc
International Used Truck Centers
IronPlanet Inc
IVECO S.p.A
MAN
PACCAR Financial Used Truck Center
Ryder System Inc
Sandhills Global
Scania
Tata Motors Ltd
*- List Not Exhaustive
About USD Analytics
Table of Contents
List of Charts and Exhibits
List of Tables
1. Executive Summary
What’s New in 2025?
Top 10 Takeaways from the industry
Potential Opportunities for Industry Stakeholders
Strategic Imperatives
Company Market Positioning
Industry Benchmarking Matrix
2. Research Scope and Methodology
Market Definition
Market Segments
Companies Profiled
Research Methodology
Bottom-Up Method
Top-Down Method
Data Triangulation
Forecast Methodology
Data Sources
USDA Proprietary Databases
External Sources
Primary Research and Interviews
Conversion Rates for USD
Abbreviations
3. Strategic Landscape: Key Insights and Implications
Spotlight: Key Strategies opted by Business Leaders
Competitive Landscape
Market Size ($ Million) and Share (%) by Company, 2024
SWOT Analysis
- Key Market Strengths
- Key Market Weaknesses
- Potential Opportunities
- Potential Threats
Porter’s Five Force Analysis
- Summary
- Bargaining Power of Buyers- Impact Analysis
- Bargaining Power of Suppliers- Impact Analysis
- Threat of new entrants- Impact Analysis
- Intensity of Competitive Rivalry- Impact Analysis
Macro-Environmental Analysis
- Economic forecasts by Country, 2010- 2035
- Population forecasts by Country, 2010- 2035
- Inflation Outlook by Country, 2010-2035
- Impact of Russia-Ukraine Conflict, Sluggish China Growth, US Developments
5. Growth Opportunity Analysis
Trends at a Glance
- What are the most noteworthy trends in the market
- Where should leaders pay attention?
- What industries are likely to be affected by the growth?
Market Dynamics
- Charting a path forward
- Growth Drivers
- Growth Barriers
Key Industry Stakeholders
- Suppliers
- Manufacturers and Service Providers
- Distribution Channels
- End-Users and Applications
- Regulators
- Investors, Traders, and R&D Institutes
Regulatory Landscape
6. Market Size Outlook to 2034
Global Nanocoatings Market Size Forecast, USD Million, 2018- 2034
- Historic Market Size, 2018- 2024
- Forecast Market Size, 2024- 2034
Scenario Analysis
- Low Growth Scenario: Definition and Outlook to 2034
- Reference Case: Definition and Outlook to 2034
- High Growth Scenario: Definition and Outlook to 2034
Pricing Analysis and Outlook
- Nanocoatings Average Price Forecast, 2021- 2034
- Key Factors Shaping the Pricing Patterns
7. Historical Nanocoatings Market Size by Segments, 2018- 2024
Key Statistics, 2024
Nanocoatings Market Size Outlook by Type, USD Million, 2018- 2024
Growth Comparison (y-o-y) across Nanocoatings Types, 2018- 2024
Nanocoatings Market Size Outlook by Application, USD Million, 2018- 2024
Growth Comparison (y-o-y) across Nanocoatings Applications, 2018- 2024
8. Nanocoatings Market Size Outlook by Segments, 2024- 2034
By Sales Channel
Franchised Dealer
Independent Dealer
Peer-to-Peer
By Propulsion
ICE
Electric
9. Nanocoatings Market Size Outlook by Region
North America
Key Market Dynamics
North America Nanocoatings Market Size Outlook by Type, USD Million, 2021-2034
North America Nanocoatings Market Size Outlook by Application, USD Million, 2021-2034
North America Nanocoatings Market Size Outlook by Sales Channel, USD Million, 2021-2034
North America Nanocoatings Market Size Outlook by Country, USD Million, 2021-2034
Europe
Key Market Dynamics
Europe Nanocoatings Market Size Outlook by Type, USD Million, 2021-2034
Europe Nanocoatings Market Size Outlook by Application, USD Million, 2021-2034
Europe Nanocoatings Market Size Outlook by Sales Channel, USD Million, 2021-2034
Europe Nanocoatings Market Size Outlook by Country, USD Million, 2021-2034
Asia Pacific
Key Market Dynamics
Asia Pacific Nanocoatings Market Size Outlook by Type, USD Million, 2021-2034
Asia Pacific Nanocoatings Market Size Outlook by Application, USD Million, 2021-2034
Asia Pacific Nanocoatings Market Size Outlook by Sales Channel, USD Million, 2021-2034
Asia Pacific Nanocoatings Market Size Outlook by Country, USD Million, 2021-2034
South America
Key Market Dynamics
South America Nanocoatings Market Size Outlook by Type, USD Million, 2021-2034
South America Nanocoatings Market Size Outlook by Application, USD Million, 2021-2034
South America Nanocoatings Market Size Outlook by Sales Channel, USD Million, 2021-2034
South America Nanocoatings Market Size Outlook by Country, USD Million, 2021-2034
Middle East and Africa
Key Market Dynamics
Middle East and Africa Nanocoatings Market Size Outlook by Type, USD Million, 2021-2034
Middle East and Africa Nanocoatings Market Size Outlook by Application, USD Million, 2021-2034
Middle East and Africa Nanocoatings Market Size Outlook by Sales Channel, USD Million, 2021-2034
Middle East and Africa Nanocoatings Market Size Outlook by Country, USD Million, 2021-2034
10. United States Nanocoatings Market Analysis and Outlook, 2021- 2034
Key Statistics
United States Nanocoatings Market Size Outlook by Type, 2021- 2034
United States Nanocoatings Market Size Outlook by Application, 2021- 2034
United States Nanocoatings Market Size Outlook by End-User, 2021- 2034
11. Canada Nanocoatings Market Analysis and Outlook, 2021- 2034
Key Statistics
Canada Nanocoatings Market Size Outlook by Type, 2021- 2034
Canada Nanocoatings Market Size Outlook by Application, 2021- 2034
Canada Nanocoatings Market Size Outlook by End-User, 2021- 2034
12. Mexico Nanocoatings Market Analysis and Outlook, 2021- 2034
Key Statistics
Mexico Nanocoatings Market Size Outlook by Type, 2021- 2034
Mexico Nanocoatings Market Size Outlook by Application, 2021- 2034
Mexico Nanocoatings Market Size Outlook by End-User, 2021- 2034
13. Germany Nanocoatings Market Analysis and Outlook, 2021- 2034
Key Statistics
Germany Nanocoatings Market Size Outlook by Type, 2021- 2034
Germany Nanocoatings Market Size Outlook by Application, 2021- 2034
Germany Nanocoatings Market Size Outlook by End-User, 2021- 2034
14. France Nanocoatings Market Analysis and Outlook, 2021- 2034
Key Statistics
France Nanocoatings Market Size Outlook by Type, 2021- 2034
France Nanocoatings Market Size Outlook by Application, 2021- 2034
France Nanocoatings Market Size Outlook by End-User, 2021- 2034
15. United Kingdom Nanocoatings Market Analysis and Outlook, 2021- 2034
Key Statistics
United Kingdom Nanocoatings Market Size Outlook by Type, 2021- 2034
United Kingdom Nanocoatings Market Size Outlook by Application, 2021- 2034
United Kingdom Nanocoatings Market Size Outlook by End-User, 2021- 2034
16. Spain Nanocoatings Market Analysis and Outlook, 2021- 2034
Key Statistics
Spain Nanocoatings Market Size Outlook by Type, 2021- 2034
Spain Nanocoatings Market Size Outlook by Application, 2021- 2034
Spain Nanocoatings Market Size Outlook by End-User, 2021- 2034
17. Italy Nanocoatings Market Analysis and Outlook, 2021- 2034
Key Statistics
Italy Nanocoatings Market Size Outlook by Type, 2021- 2034
Italy Nanocoatings Market Size Outlook by Application, 2021- 2034
Italy Nanocoatings Market Size Outlook by End-User, 2021- 2034
18. Benelux Nanocoatings Market Analysis and Outlook, 2021- 2034
Key Statistics
Benelux Nanocoatings Market Size Outlook by Type, 2021- 2034
Benelux Nanocoatings Market Size Outlook by Application, 2021- 2034
Benelux Nanocoatings Market Size Outlook by End-User, 2021- 2034
19. Nordic Nanocoatings Market Analysis and Outlook, 2021- 2034
Key Statistics
Nordic Nanocoatings Market Size Outlook by Type, 2021- 2034
Nordic Nanocoatings Market Size Outlook by Application, 2021- 2034
Nordic Nanocoatings Market Size Outlook by End-User, 2021- 2034
20. Rest of Europe Nanocoatings Market Analysis and Outlook, 2021- 2034
Key Statistics
Rest of Europe Nanocoatings Market Size Outlook by Type, 2021- 2034
Rest of Europe Nanocoatings Market Size Outlook by Application, 2021- 2034
Rest of Europe Nanocoatings Market Size Outlook by End-User, 2021- 2034
21. China Nanocoatings Market Analysis and Outlook, 2021- 2034
Key Statistics
China Nanocoatings Market Size Outlook by Type, 2021- 2034
China Nanocoatings Market Size Outlook by Application, 2021- 2034
China Nanocoatings Market Size Outlook by End-User, 2021- 2034
22. India Nanocoatings Market Analysis and Outlook, 2021- 2034
Key Statistics
India Nanocoatings Market Size Outlook by Type, 2021- 2034
India Nanocoatings Market Size Outlook by Application, 2021- 2034
India Nanocoatings Market Size Outlook by End-User, 2021- 2034
23. Japan Nanocoatings Market Analysis and Outlook, 2021- 2034
Key Statistics
Japan Nanocoatings Market Size Outlook by Type, 2021- 2034
Japan Nanocoatings Market Size Outlook by Application, 2021- 2034
Japan Nanocoatings Market Size Outlook by End-User, 2021- 2034
24. South Korea Nanocoatings Market Analysis and Outlook, 2021- 2034
Key Statistics
South Korea Nanocoatings Market Size Outlook by Type, 2021- 2034
South Korea Nanocoatings Market Size Outlook by Application, 2021- 2034
South Korea Nanocoatings Market Size Outlook by End-User, 2021- 2034
25. Australia Nanocoatings Market Analysis and Outlook, 2021- 2034
Key Statistics
Australia Nanocoatings Market Size Outlook by Type, 2021- 2034
Australia Nanocoatings Market Size Outlook by Application, 2021- 2034
Australia Nanocoatings Market Size Outlook by End-User, 2021- 2034
26. South East Asia Nanocoatings Market Analysis and Outlook, 2021- 2034
Key Statistics
South East Asia Nanocoatings Market Size Outlook by Type, 2021- 2034
South East Asia Nanocoatings Market Size Outlook by Application, 2021- 2034
South East Asia Nanocoatings Market Size Outlook by End-User, 2021- 2034
27. Rest of Asia Pacific Nanocoatings Market Analysis and Outlook, 2021- 2034
Key Statistics
Rest of Asia Pacific Nanocoatings Market Size Outlook by Type, 2021- 2034
Rest of Asia Pacific Nanocoatings Market Size Outlook by Application, 2021- 2034
Rest of Asia Pacific Nanocoatings Market Size Outlook by End-User, 2021- 2034
28. Brazil Nanocoatings Market Analysis and Outlook, 2021- 2034
Key Statistics
Brazil Nanocoatings Market Size Outlook by Type, 2021- 2034
Brazil Nanocoatings Market Size Outlook by Application, 2021- 2034
Brazil Nanocoatings Market Size Outlook by End-User, 2021- 2034
29. Argentina Nanocoatings Market Analysis and Outlook, 2021- 2034
Key Statistics
Argentina Nanocoatings Market Size Outlook by Type, 2021- 2034
Argentina Nanocoatings Market Size Outlook by Application, 2021- 2034
Argentina Nanocoatings Market Size Outlook by End-User, 2021- 2034
30. Rest of South America Nanocoatings Market Analysis and Outlook, 2021- 2034
Key Statistics
Rest of South America Nanocoatings Market Size Outlook by Type, 2021- 2034
Rest of South America Nanocoatings Market Size Outlook by Application, 2021- 2034
Rest of South America Nanocoatings Market Size Outlook by End-User, 2021- 2034
31. United Arab Emirates Nanocoatings Market Analysis and Outlook, 2021- 2034
Key Statistics
United Arab Emirates Nanocoatings Market Size Outlook by Type, 2021- 2034
United Arab Emirates Nanocoatings Market Size Outlook by Application, 2021- 2034
United Arab Emirates Nanocoatings Market Size Outlook by End-User, 2021- 2034
32. Saudi Arabia Nanocoatings Market Analysis and Outlook, 2021- 2034
Key Statistics
Saudi Arabia Nanocoatings Market Size Outlook by Type, 2021- 2034
Saudi Arabia Nanocoatings Market Size Outlook by Application, 2021- 2034
Saudi Arabia Nanocoatings Market Size Outlook by End-User, 2021- 2034
33. Rest of Middle East Nanocoatings Market Analysis and Outlook, 2021- 2034
Key Statistics
Rest of Middle East Nanocoatings Market Size Outlook by Type, 2021- 2034
Rest of Middle East Nanocoatings Market Size Outlook by Application, 2021- 2034
Rest of Middle East Nanocoatings Market Size Outlook by End-User, 2021- 2034
34. South Africa Nanocoatings Market Analysis and Outlook, 2021- 2034
Key Statistics
South Africa Nanocoatings Market Size Outlook by Type, 2021- 2034
South Africa Nanocoatings Market Size Outlook by Application, 2021- 2034
South Africa Nanocoatings Market Size Outlook by End-User, 2021- 2034
35. Rest of Africa Nanocoatings Market Analysis and Outlook, 2021- 2034
Key Statistics
Rest of Africa Nanocoatings Market Size Outlook by Type, 2021- 2034
Rest of Africa Nanocoatings Market Size Outlook by Application, 2021- 2034
Rest of Africa Nanocoatings Market Size Outlook by End-User, 2021- 2034
36. Key Companies
Market Share Analysis
AB Volvo
Arrow Truck Sales Inc
International Used Truck Centers
IronPlanet Inc
IVECO S.p.A
MAN
PACCAR Financial Used Truck Center
Ryder System Inc
Sandhills Global
Scania
Tata Motors Ltd
Company Benchmarking
Financial Analysis
37. Recent Market Developments
38. Appendix
Looking Ahead
Research Methodology
Legal Disclaimer
