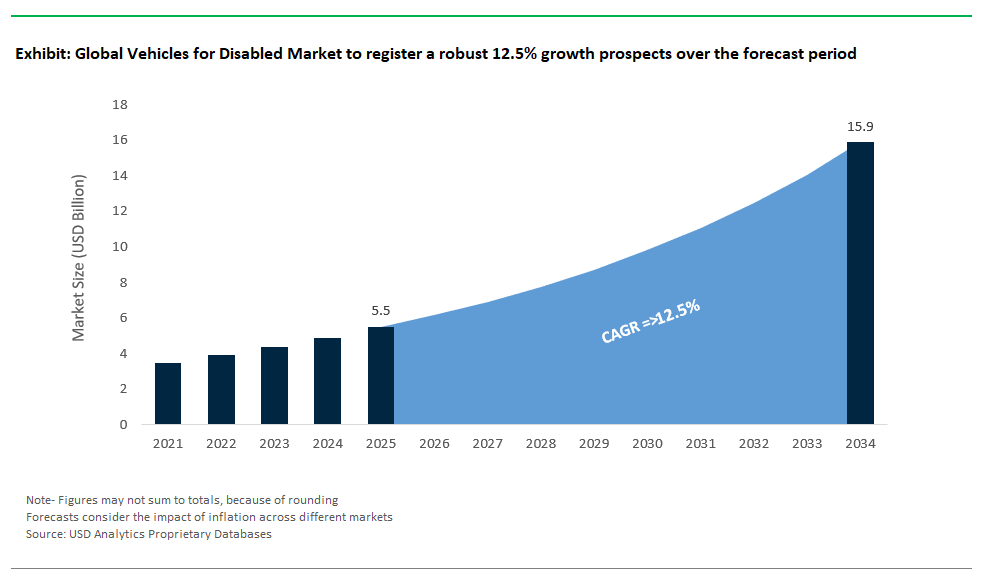
The Global Vehicles for Disabled Market Size is estimated at $5.5 Billion in 2025 and is forecast to register an annual growth rate (CAGR) of 12.5% to reach $15.9 Billion by 2034.
The global Vehicles for Disabled Market Study analyzes and forecasts the market size across 6 regions and 24 countries for diverse segments -By Vehicle (Passenger Car, SUV/MPV, Pick-up Truck, Mobility Scooter), By Manufacturer (OEM, Third-Party Customization), By Entry Configuration (Side Entry, Rear Entry), By Entry Mechanism (Ramp, Lifting Equipment), By Driving Option (Driving on Swivel Seat, Driving through Wheelchair, Driving on Normal Seat).
An Introduction to Vehicles for Disabled Market in 2025
The Vehicles for Disabled market is growing as advancements in automotive technology and increasing awareness of accessibility needs drive the development of specialized vehicles. These vehicles are designed to accommodate various disabilities, providing features such as wheelchair access, adaptive controls, and specialized seating arrangements. The market is driven by regulatory mandates for accessibility, an aging population, and a rising emphasis on inclusivity. Innovations in vehicle design and technology, including automation and customization options, are enhancing mobility solutions for disabled individuals. As societal attitudes shift towards greater inclusivity and accessibility, the demand for specialized vehicles continues to grow, leading to a more diverse and adaptive range of mobility solutions.
Vehicles for Disabled Competitive Landscape
The market report analyses the leading companies in the industry including AMS Vans LLC, Brotherwood Automobility, Electric Mobility Euro, Focaccia Group Srl, GM Coachwork, Mobility Networks, Pride Mobility, Revability, Toyota Mobility, Vantage Mobility, and others.
Vehicles for Disabled Market Dynamics
Market Trend: Rise in Customization and Accessibility Features
The most prominent trend in the Vehicles for Disabled market is the rise in customization and accessibility features tailored to individual needs. Advances in technology have enabled manufacturers to offer highly customizable vehicles that accommodate various disabilities, such as advanced wheelchair lifts, hand controls, and adaptive seating. This trend reflects a broader movement towards inclusivity, with a focus on providing mobility solutions that cater to the specific requirements of disabled individuals. The increasing availability of tailored modifications and high-tech accessibility options demonstrates the industry's commitment to enhancing mobility and independence for people with disabilities.
Market Driver: Growing Awareness and Legislative Support
The key driver of the Vehicles for Disabled market is growing awareness and legislative support for disability rights. Increased advocacy and supportive regulations, such as the Americans with Disabilities Act (ADA) in the U.S. and similar legislation globally, have heightened demand for accessible vehicles. Governments and organizations are pushing for greater accessibility in transportation, leading to higher adoption rates of vehicles designed for disabled individuals. This supportive legislative environment drives manufacturers to innovate and expand their offerings, ensuring compliance with regulations and meeting the needs of a broader customer base.
Market Opportunity: Development of Autonomous and Semi-Autonomous Vehicles
A significant opportunity in the Vehicles for Disabled market lies in the development of autonomous and semi-autonomous vehicles. As technology advances, the integration of autonomous driving capabilities could dramatically enhance mobility for disabled individuals, offering greater independence and reducing the need for specialized adaptations. Autonomous vehicles can provide a transformative solution by allowing individuals with disabilities to operate vehicles without relying on manual controls or assistance. This potential for increased autonomy presents a promising avenue for innovation and investment, as manufacturers and technology providers explore ways to incorporate autonomous features into accessible vehicles.
Vehicles for Disabled Market Share Analysis: Passenger Car generated the highest revenue in 2024
In the Vehicles for Disabled Market, Passenger Cars represent the largest segment. Passenger cars are the most common type of vehicle adapted for individuals with disabilities due to their versatility and widespread availability. These vehicles can be modified with a variety of accessibility features, such as hand controls, adapted seating, and ramps, to accommodate a range of disabilities. The large volume of passenger cars in the market and the relatively high demand for accessible personal transportation contribute to their dominance. Additionally, the affordability and availability of passenger cars compared to other vehicle types, like SUVs or pick-up trucks, further cement their position as the largest segment in the vehicles for disabled market.
Vehicles for Disabled Market Share Analysis: Third-Party Customization is poised to register the fastest CAGR over the forecast period
In the Vehicles for Disabled Market, Third-Party Customization is the fastest-growing segment. The increasing demand for personalized and specific modifications drives the growth of third-party customization services. These providers offer tailored solutions that cater to individual needs, such as custom-built ramps, lifts, and controls, which are not always available through standard OEM options. As awareness of accessibility needs grows and technology advances, more individuals are seeking customized solutions that better meet their specific requirements. This trend towards personalized and adaptable solutions makes third-party customization the fastest-growing segment in the vehicles for disabled market.
Vehicles for Disabled Market Share Analysis: Rear Entry generated the highest revenue in 2024
In the Vehicles for Disabled Market, Rear Entry configurations are the largest segment. Rear entry vehicles offer a practical solution for accessibility by allowing easier entry and exit for wheelchair users and individuals with mobility impairments. This configuration is often preferred for its ease of use and the ability to accommodate a wider range of mobility aids and equipment. Additionally, rear entry vehicles can be more cost-effective and versatile compared to side entry models, contributing to their dominant market share. The functionality and cost benefits associated with rear entry make it the largest segment in the vehicles for disabled market.
Vehicles for Disabled Market Share Analysis: Ramp is poised to register the fastest CAGR over the forecast period
In the Vehicles for Disabled Market, Ramp entry mechanisms are the fastest-growing segment. Ramps are increasingly favored due to their simplicity, ease of use, and cost-effectiveness compared to other entry mechanisms like lifting equipment. The growing emphasis on providing accessible solutions that are user-friendly and affordable drives the demand for ramp mechanisms. As more vehicle owners and operators seek practical and efficient ways to enhance accessibility, ramps offer a practical solution that meets these needs. This trend towards more accessible and budget-friendly solutions makes ramps the fastest-growing segment in the vehicles for disabled market.
Vehicles for Disabled Market Report Scope
|
Parameter
|
Details
|
|
Market Size (2025)
|
$ 5.5 Billion
|
|
Market Size (2034)
|
$ 15.9 Billion
|
|
Market Growth Rate
|
12.5%
|
|
Segments
|
By Vehicle (Passenger Car, SUV/MPV, Pick-up Truck, Mobility Scooter), By Manufacturer (OEM, Third-Party Customization), By Entry Configuration (Side Entry, Rear Entry), By Entry Mechanism (Ramp, Lifting Equipment), By Driving Option (Driving on Swivel Seat, Driving through Wheelchair, Driving on Normal Seat)
|
|
Study Period
|
2019- 2024 and 2025-2034
|
|
Units
|
Revenue (USD)
|
|
Qualitative Analysis
|
Porter’s Five Forces, SWOT Profile, Market Share, Scenario Forecasts, Market Ecosystem, Company Ranking, Market Dynamics, Industry Benchmarking
|
|
Companies
|
AMS Vans LLC, Brotherwood Automobility, Electric Mobility Euro, Focaccia Group Srl, GM Coachwork, Mobility Networks, Pride Mobility, Revability, Toyota Mobility, Vantage Mobility
|
|
Countries
|
US, Canada, Mexico, Germany, France, Spain, Italy, UK, Russia, China, India, Japan, South Korea, Australia, South East Asia, Brazil, Argentina, Middle East, Africa
|
Vehicles for Disabled Market Segmentation
By Vehicle
Passenger Car
SUV/MPV
Pick-up Truck
Mobility Scooter
By Manufacturer
OEM
Third-Party Customization
By Entry Configuration
Side Entry
Rear Entry
By Entry Mechanism
Ramp
Lifting Equipment
By Driving Option
Driving on Swivel Seat
Driving through Wheelchair
Driving on Normal Seat
Countries Analyzed
North America (US, Canada, Mexico)
Europe (Germany, UK, France, Spain, Italy, Russia, Rest of Europe)
Asia Pacific (China, India, Japan, South Korea, Australia, South East Asia, Rest of Asia)
South America (Brazil, Argentina, Rest of South America)
Middle East and Africa (Saudi Arabia, UAE, Rest of Middle East, South Africa, Egypt, Rest of Africa)
Vehicles for Disabled Companies Profiled in the Study
AMS Vans LLC
Brotherwood Automobility
Electric Mobility Euro
Focaccia Group Srl
GM Coachwork
Mobility Networks
Pride Mobility
Revability
Toyota Mobility
Vantage Mobility
*- List Not Exhaustive
About USD Analytics
Table of Contents
List of Charts and Exhibits
List of Tables
1. Executive Summary
What’s New in 2025?
Top 10 Takeaways from the industry
Potential Opportunities for Industry Stakeholders
Strategic Imperatives
Company Market Positioning
Industry Benchmarking Matrix
2. Research Scope and Methodology
Market Definition
Market Segments
Companies Profiled
Research Methodology
Bottom-Up Method
Top-Down Method
Data Triangulation
Forecast Methodology
Data Sources
USDA Proprietary Databases
External Sources
Primary Research and Interviews
Conversion Rates for USD
Abbreviations
3. Strategic Landscape: Key Insights and Implications
Spotlight: Key Strategies opted by Business Leaders
Competitive Landscape
Market Size ($ Million) and Share (%) by Company, 2024
SWOT Analysis
- Key Market Strengths
- Key Market Weaknesses
- Potential Opportunities
- Potential Threats
Porter’s Five Force Analysis
- Summary
- Bargaining Power of Buyers- Impact Analysis
- Bargaining Power of Suppliers- Impact Analysis
- Threat of new entrants- Impact Analysis
- Intensity of Competitive Rivalry- Impact Analysis
Macro-Environmental Analysis
- Economic forecasts by Country, 2010- 2035
- Population forecasts by Country, 2010- 2035
- Inflation Outlook by Country, 2010-2035
- Impact of Russia-Ukraine Conflict, Sluggish China Growth, US Developments
5. Growth Opportunity Analysis
Trends at a Glance
- What are the most noteworthy trends in the market
- Where should leaders pay attention?
- What industries are likely to be affected by the growth?
Market Dynamics
- Charting a path forward
- Growth Drivers
- Growth Barriers
Key Industry Stakeholders
- Suppliers
- Manufacturers and Service Providers
- Distribution Channels
- End-Users and Applications
- Regulators
- Investors, Traders, and R&D Institutes
Regulatory Landscape
6. Market Size Outlook to 2034
Global Nanocoatings Market Size Forecast, USD Million, 2018- 2034
- Historic Market Size, 2018- 2024
- Forecast Market Size, 2024- 2034
Scenario Analysis
- Low Growth Scenario: Definition and Outlook to 2034
- Reference Case: Definition and Outlook to 2034
- High Growth Scenario: Definition and Outlook to 2034
Pricing Analysis and Outlook
- Nanocoatings Average Price Forecast, 2021- 2034
- Key Factors Shaping the Pricing Patterns
7. Historical Nanocoatings Market Size by Segments, 2018- 2024
Key Statistics, 2024
Nanocoatings Market Size Outlook by Type, USD Million, 2018- 2024
Growth Comparison (y-o-y) across Nanocoatings Types, 2018- 2024
Nanocoatings Market Size Outlook by Application, USD Million, 2018- 2024
Growth Comparison (y-o-y) across Nanocoatings Applications, 2018- 2024
8. Nanocoatings Market Size Outlook by Segments, 2024- 2034
By Vehicle
Passenger Car
SUV/MPV
Pick-up Truck
Mobility Scooter
By Manufacturer
OEM
Third-Party Customization
By Entry Configuration
Side Entry
Rear Entry
By Entry Mechanism
Ramp
Lifting Equipment
By Driving Option
Driving on Swivel Seat
Driving through Wheelchair
Driving on Normal Seat
9. Nanocoatings Market Size Outlook by Region
North America
Key Market Dynamics
North America Nanocoatings Market Size Outlook by Type, USD Million, 2021-2034
North America Nanocoatings Market Size Outlook by Application, USD Million, 2021-2034
North America Nanocoatings Market Size Outlook by Sales Channel, USD Million, 2021-2034
North America Nanocoatings Market Size Outlook by Country, USD Million, 2021-2034
Europe
Key Market Dynamics
Europe Nanocoatings Market Size Outlook by Type, USD Million, 2021-2034
Europe Nanocoatings Market Size Outlook by Application, USD Million, 2021-2034
Europe Nanocoatings Market Size Outlook by Sales Channel, USD Million, 2021-2034
Europe Nanocoatings Market Size Outlook by Country, USD Million, 2021-2034
Asia Pacific
Key Market Dynamics
Asia Pacific Nanocoatings Market Size Outlook by Type, USD Million, 2021-2034
Asia Pacific Nanocoatings Market Size Outlook by Application, USD Million, 2021-2034
Asia Pacific Nanocoatings Market Size Outlook by Sales Channel, USD Million, 2021-2034
Asia Pacific Nanocoatings Market Size Outlook by Country, USD Million, 2021-2034
South America
Key Market Dynamics
South America Nanocoatings Market Size Outlook by Type, USD Million, 2021-2034
South America Nanocoatings Market Size Outlook by Application, USD Million, 2021-2034
South America Nanocoatings Market Size Outlook by Sales Channel, USD Million, 2021-2034
South America Nanocoatings Market Size Outlook by Country, USD Million, 2021-2034
Middle East and Africa
Key Market Dynamics
Middle East and Africa Nanocoatings Market Size Outlook by Type, USD Million, 2021-2034
Middle East and Africa Nanocoatings Market Size Outlook by Application, USD Million, 2021-2034
Middle East and Africa Nanocoatings Market Size Outlook by Sales Channel, USD Million, 2021-2034
Middle East and Africa Nanocoatings Market Size Outlook by Country, USD Million, 2021-2034
10. United States Nanocoatings Market Analysis and Outlook, 2021- 2034
Key Statistics
United States Nanocoatings Market Size Outlook by Type, 2021- 2034
United States Nanocoatings Market Size Outlook by Application, 2021- 2034
United States Nanocoatings Market Size Outlook by End-User, 2021- 2034
11. Canada Nanocoatings Market Analysis and Outlook, 2021- 2034
Key Statistics
Canada Nanocoatings Market Size Outlook by Type, 2021- 2034
Canada Nanocoatings Market Size Outlook by Application, 2021- 2034
Canada Nanocoatings Market Size Outlook by End-User, 2021- 2034
12. Mexico Nanocoatings Market Analysis and Outlook, 2021- 2034
Key Statistics
Mexico Nanocoatings Market Size Outlook by Type, 2021- 2034
Mexico Nanocoatings Market Size Outlook by Application, 2021- 2034
Mexico Nanocoatings Market Size Outlook by End-User, 2021- 2034
13. Germany Nanocoatings Market Analysis and Outlook, 2021- 2034
Key Statistics
Germany Nanocoatings Market Size Outlook by Type, 2021- 2034
Germany Nanocoatings Market Size Outlook by Application, 2021- 2034
Germany Nanocoatings Market Size Outlook by End-User, 2021- 2034
14. France Nanocoatings Market Analysis and Outlook, 2021- 2034
Key Statistics
France Nanocoatings Market Size Outlook by Type, 2021- 2034
France Nanocoatings Market Size Outlook by Application, 2021- 2034
France Nanocoatings Market Size Outlook by End-User, 2021- 2034
15. United Kingdom Nanocoatings Market Analysis and Outlook, 2021- 2034
Key Statistics
United Kingdom Nanocoatings Market Size Outlook by Type, 2021- 2034
United Kingdom Nanocoatings Market Size Outlook by Application, 2021- 2034
United Kingdom Nanocoatings Market Size Outlook by End-User, 2021- 2034
16. Spain Nanocoatings Market Analysis and Outlook, 2021- 2034
Key Statistics
Spain Nanocoatings Market Size Outlook by Type, 2021- 2034
Spain Nanocoatings Market Size Outlook by Application, 2021- 2034
Spain Nanocoatings Market Size Outlook by End-User, 2021- 2034
17. Italy Nanocoatings Market Analysis and Outlook, 2021- 2034
Key Statistics
Italy Nanocoatings Market Size Outlook by Type, 2021- 2034
Italy Nanocoatings Market Size Outlook by Application, 2021- 2034
Italy Nanocoatings Market Size Outlook by End-User, 2021- 2034
18. Benelux Nanocoatings Market Analysis and Outlook, 2021- 2034
Key Statistics
Benelux Nanocoatings Market Size Outlook by Type, 2021- 2034
Benelux Nanocoatings Market Size Outlook by Application, 2021- 2034
Benelux Nanocoatings Market Size Outlook by End-User, 2021- 2034
19. Nordic Nanocoatings Market Analysis and Outlook, 2021- 2034
Key Statistics
Nordic Nanocoatings Market Size Outlook by Type, 2021- 2034
Nordic Nanocoatings Market Size Outlook by Application, 2021- 2034
Nordic Nanocoatings Market Size Outlook by End-User, 2021- 2034
20. Rest of Europe Nanocoatings Market Analysis and Outlook, 2021- 2034
Key Statistics
Rest of Europe Nanocoatings Market Size Outlook by Type, 2021- 2034
Rest of Europe Nanocoatings Market Size Outlook by Application, 2021- 2034
Rest of Europe Nanocoatings Market Size Outlook by End-User, 2021- 2034
21. China Nanocoatings Market Analysis and Outlook, 2021- 2034
Key Statistics
China Nanocoatings Market Size Outlook by Type, 2021- 2034
China Nanocoatings Market Size Outlook by Application, 2021- 2034
China Nanocoatings Market Size Outlook by End-User, 2021- 2034
22. India Nanocoatings Market Analysis and Outlook, 2021- 2034
Key Statistics
India Nanocoatings Market Size Outlook by Type, 2021- 2034
India Nanocoatings Market Size Outlook by Application, 2021- 2034
India Nanocoatings Market Size Outlook by End-User, 2021- 2034
23. Japan Nanocoatings Market Analysis and Outlook, 2021- 2034
Key Statistics
Japan Nanocoatings Market Size Outlook by Type, 2021- 2034
Japan Nanocoatings Market Size Outlook by Application, 2021- 2034
Japan Nanocoatings Market Size Outlook by End-User, 2021- 2034
24. South Korea Nanocoatings Market Analysis and Outlook, 2021- 2034
Key Statistics
South Korea Nanocoatings Market Size Outlook by Type, 2021- 2034
South Korea Nanocoatings Market Size Outlook by Application, 2021- 2034
South Korea Nanocoatings Market Size Outlook by End-User, 2021- 2034
25. Australia Nanocoatings Market Analysis and Outlook, 2021- 2034
Key Statistics
Australia Nanocoatings Market Size Outlook by Type, 2021- 2034
Australia Nanocoatings Market Size Outlook by Application, 2021- 2034
Australia Nanocoatings Market Size Outlook by End-User, 2021- 2034
26. South East Asia Nanocoatings Market Analysis and Outlook, 2021- 2034
Key Statistics
South East Asia Nanocoatings Market Size Outlook by Type, 2021- 2034
South East Asia Nanocoatings Market Size Outlook by Application, 2021- 2034
South East Asia Nanocoatings Market Size Outlook by End-User, 2021- 2034
27. Rest of Asia Pacific Nanocoatings Market Analysis and Outlook, 2021- 2034
Key Statistics
Rest of Asia Pacific Nanocoatings Market Size Outlook by Type, 2021- 2034
Rest of Asia Pacific Nanocoatings Market Size Outlook by Application, 2021- 2034
Rest of Asia Pacific Nanocoatings Market Size Outlook by End-User, 2021- 2034
28. Brazil Nanocoatings Market Analysis and Outlook, 2021- 2034
Key Statistics
Brazil Nanocoatings Market Size Outlook by Type, 2021- 2034
Brazil Nanocoatings Market Size Outlook by Application, 2021- 2034
Brazil Nanocoatings Market Size Outlook by End-User, 2021- 2034
29. Argentina Nanocoatings Market Analysis and Outlook, 2021- 2034
Key Statistics
Argentina Nanocoatings Market Size Outlook by Type, 2021- 2034
Argentina Nanocoatings Market Size Outlook by Application, 2021- 2034
Argentina Nanocoatings Market Size Outlook by End-User, 2021- 2034
30. Rest of South America Nanocoatings Market Analysis and Outlook, 2021- 2034
Key Statistics
Rest of South America Nanocoatings Market Size Outlook by Type, 2021- 2034
Rest of South America Nanocoatings Market Size Outlook by Application, 2021- 2034
Rest of South America Nanocoatings Market Size Outlook by End-User, 2021- 2034
31. United Arab Emirates Nanocoatings Market Analysis and Outlook, 2021- 2034
Key Statistics
United Arab Emirates Nanocoatings Market Size Outlook by Type, 2021- 2034
United Arab Emirates Nanocoatings Market Size Outlook by Application, 2021- 2034
United Arab Emirates Nanocoatings Market Size Outlook by End-User, 2021- 2034
32. Saudi Arabia Nanocoatings Market Analysis and Outlook, 2021- 2034
Key Statistics
Saudi Arabia Nanocoatings Market Size Outlook by Type, 2021- 2034
Saudi Arabia Nanocoatings Market Size Outlook by Application, 2021- 2034
Saudi Arabia Nanocoatings Market Size Outlook by End-User, 2021- 2034
33. Rest of Middle East Nanocoatings Market Analysis and Outlook, 2021- 2034
Key Statistics
Rest of Middle East Nanocoatings Market Size Outlook by Type, 2021- 2034
Rest of Middle East Nanocoatings Market Size Outlook by Application, 2021- 2034
Rest of Middle East Nanocoatings Market Size Outlook by End-User, 2021- 2034
34. South Africa Nanocoatings Market Analysis and Outlook, 2021- 2034
Key Statistics
South Africa Nanocoatings Market Size Outlook by Type, 2021- 2034
South Africa Nanocoatings Market Size Outlook by Application, 2021- 2034
South Africa Nanocoatings Market Size Outlook by End-User, 2021- 2034
35. Rest of Africa Nanocoatings Market Analysis and Outlook, 2021- 2034
Key Statistics
Rest of Africa Nanocoatings Market Size Outlook by Type, 2021- 2034
Rest of Africa Nanocoatings Market Size Outlook by Application, 2021- 2034
Rest of Africa Nanocoatings Market Size Outlook by End-User, 2021- 2034
36. Key Companies
Market Share Analysis
AMS Vans LLC
Brotherwood Automobility
Electric Mobility Euro
Focaccia Group Srl
GM Coachwork
Mobility Networks
Pride Mobility
Revability
Toyota Mobility
Vantage Mobility
Company Benchmarking
Financial Analysis
37. Recent Market Developments
38. Appendix
Looking Ahead
Research Methodology
Legal Disclaimer
