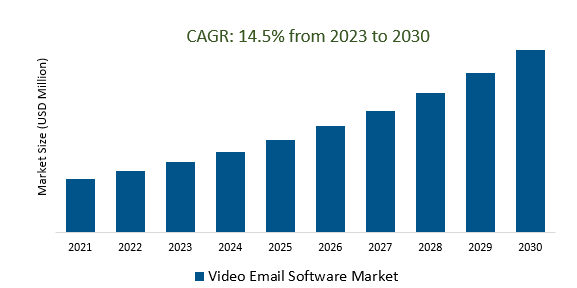
The Global Video Email Software Market Size is estimated to register 14.5% growth over the forecast period from 2023 to 2030.
The market growth is driven by an increasing with the increased reliance on digital communication, security, and compliance have become paramount concerns in the Video Email Software Market. Organizations are placing a strong emphasis on ensuring that video email platforms adhere to industry regulations and data protection standards. Encryption, secure sharing options, and compliance with privacy regulations are key factors influencing the adoption of video email software, particularly in industries with strict security requirements. Leading Companies focusing on Artificial Intelligence-Enhanced Personalization, Virtual and Augmented Reality Integration, Blockchain for Enhanced Security and Transparency, and others to boost market shares in the industry.
Market Overview
The Video Email Software Market facilitates the creation, integration, and tracking of video content in email communication. It has gained prominence with the surge in remote work, providing a visually engaging means of interaction. Key functionalities include video creation, seamless email platform integration, analytics for performance tracking, personalization features, and robust security measures. Current trends involve AI integration for enhanced personalization, mobile optimization, and the incorporation of interactive elements within videos. Looking ahead, the market's future scope includes advancements in AI-driven personalization, potential integration with virtual and augmented reality, and the adoption of blockchain for heightened security.
Market Dynamics
Market Trends- Video email software bridges the gap between remote teams, fostering engagement and collaboration.
Video email software enhances communication and collaboration within remote teams by seamlessly integrating video content into email communication. This technology goes beyond traditional text-based emails, providing a visually compelling platform for conveying messages, updates, and project details. By fostering a more engaging and dynamic exchange of information, it bridges the gap between geographically dispersed team members, reducing communication barriers associated with remote work. Video emails offer a personalized and impactful means for virtual presentations, training sessions, and team updates, contributing to a more connected and effective remote work environment.
Market Driver- AI-powered video email software drives engagement, personalization, and streamlined communication.
AI-powered video email software transforms communication by driving engagement, personalization, and efficiency. Leveraging artificial intelligence, these platforms analyze user behaviors for highly personalized video content, enhancing relevance and impact. Automated features like transcription and content analysis streamline communication processes, saving time and increasing efficiency. The integration of AI ensures tailored messages, making the software crucial for various contexts, from marketing to internal team collaboration. In a landscape where organizations prioritize efficient and personalized communication, the AI-powered Video Email Software Market stands out as a leading innovator.
Market Opportunity- Video email software adapts to mobile preferences, enabling seamless communication on the go.
Video email software has adapted to mobile preferences, ensuring seamless communication on smartphones and tablets. This evolution allows users to easily create, send, and view video emails on the go, enhancing accessibility and user experience. With user-friendly interfaces and responsive designs, the software caters to the increasing demand for flexible work environments and mobile-centric communication, aligning with the evolving preferences of users and organizations.
Market Share Analysis- Cloud Based Video Email Software Market will register the fastest growth
The Global Video Email Software Market is analyzed across Cloud Based, On-Premises, and others. Cloud Based is poised to register the fastest growth. The Cloud-Based Video Email Software Market provides solutions for creating, sending, and receiving video emails through cloud platforms, eliminating the need for on-premises infrastructure. This segment caters to the demand for flexible and remotely accessible communication tools, especially in the context of remote work. Users can access video email features through web browsers or applications, benefiting from cloud infrastructure's scalability and ease of maintenance. The market is expected to evolve in tandem with advancements in cloud technology and the increasing adoption of cloud-based solutions across industries.
Market Share Analysis- Retail held a significant market share in 2023
The Global Video Email Software Market is analyzed across various applications including Retail, Real Estate, and others. Of these, Retail held a significant market share in 2023. The Retail Video Email Software Market serves the retail industry by providing video email solutions tailored to enhance customer engagement and communication. This software likely offers features such as personalized promotions, product showcases through video content, and integration with retail-specific tools like CRM systems and e-commerce platforms. Aligned with the retail sector's emphasis on digital marketing and personalized customer experiences, this market facilitates visually appealing and interactive communication strategies.
Video Email Software Market Segmentation
By Type
By Application
- Retail
- Real Estate
- Others
By Organization Size
By Solution
- Communication
- Marketing
- Sales
- Advertising
- Others
By Region
- North America (United States, Canada, Mexico)
- Europe (Germany, France, United Kingdom, Spain, Italy, Others)
- Asia Pacific (China, India, Japan, South Korea, Australia, Others)
- Latin America (Brazil, Argentina, Others)
- Middle East and Africa (Saudi Arabia, UAE, Kuwait, Other Middle East, South Africa, Nigeria, Other Africa)
Video Email Software Market Companies
- Lyceum Technologies (Brazil)
- Vidyard (Canada)
- BombBomb (United States)
- Dubb (United States)
- Covideo (United States)
- Bonjoro (Australia)
- OneMob (United States)
- ScreenRec (United States)
- LogMeIn (United States)
- Magnifi (New York)
*List not exhaustive
Video Email Software Market Outlook 2023
1 Market Overview
1.1 Introduction to the Video Email Software Market
1.2 Scope of the Study
1.3 Research Objective
1.3.1 Key Market Scope and Segments
1.3.2 Players Covered
1.3.3 Years Considered
2 Executive Summary
2.1 2023 Video Email Software Industry- Market Statistics
3 Market Dynamics
3.1 Market Drivers
3.2 Market Challenges
3.3 Market Opportunities
3.4 Market Trends
4 Market Factor Analysis
4.1 Porter’s Five Forces
4.2 Market Entropy
4.2.1 Global Video Email Software Market Companies with Area Served
4.2.2 Products Offerings Global Video Email Software Market
5 COVID-19 Impact Analysis and Outlook Scenarios
5.1.1 Covid-19 Impact Analysis
5.1.2 post-COVID-19 Scenario- Low Growth Case
5.1.3 post-COVID-19 Scenario- Reference Growth Case
5.1.4 post-COVID-19 Scenario- Low Growth Case
6 Global Video Email Software Market Trends
6.1 Global Video Email Software Revenue (USD Million) and CAGR (%) by Type (2018-2030)
6.2 Global Video Email Software Revenue (USD Million) and CAGR (%) by Applications (2018-2030)
6.3 Global Video Email Software Revenue (USD Million) and CAGR (%) by regions (2018-2030)
7 Global Video Email Software Market Revenue (USD Million) by Type, and Applications (2018-2022)
7.1 Global Video Email Software Revenue (USD Million) by Type (2018-2022)
7.1.1 Global Video Email Software Revenue (USD Million), Market Share (%) by Type (2018-2022)
7.2 Global Video Email Software Revenue (USD Million) by Applications (2018-2022)
7.2.1 Global Video Email Software Revenue (USD Million), Market Share (%) by Applications (2018-2022)
8 Global Video Email Software Development Regional Status and Outlook
8.1 Global Video Email Software Revenue (USD Million) By Regions (2018-2022)
8.2 North America Video Email Software Revenue (USD Million) by Type, and Application (2018-2022)
8.2.1 North America Video Email Software Revenue (USD Million) by Country (2018-2022)
8.2.2 North America Video Email Software Revenue (USD Million) by Type (2018-2022)
8.2.3 North America Video Email Software Revenue (USD Million) by Applications (2018-2022)
8.3 Europe Video Email Software Revenue (USD Million), by Type, and Applications (USD Million) (2018-2022)
8.3.1 Europe Video Email Software Revenue (USD Million), by Country (2018-2022)
8.3.2 Europe Video Email Software Revenue (USD Million) by Type (2018-2022)
8.3.3 Europe Video Email Software Revenue (USD Million) by Applications (2018-2022)
8.4 Asia Pacific Video Email Software Revenue (USD Million), and Revenue (USD Million) by Type, and Applications (2018-2022)
8.4.1 Asia Pacific Video Email Software Revenue (USD Million) by Country (2018-2022)
8.4.2 Asia Pacific Video Email Software Revenue (USD Million) by Type (2018-2022)
8.4.3 Asia Pacific Video Email Software Revenue (USD Million) by Applications (2018-2022)
8.5 South America Video Email Software Revenue (USD Million), by Type, and Applications (2018-2022)
8.5.1 South America Video Email Software Revenue (USD Million), by Country (2018-2022)
8.5.2 South America Video Email Software Revenue (USD Million) by Type (2018-2022)
8.5.3 South America Video Email Software Revenue (USD Million) by Applications (2018-2022)
8.6 Middle East and Africa Video Email Software Revenue (USD Million), by Type, Technology, Application, Thickness (2018-2022)
8.6.1 Middle East and Africa Video Email Software Revenue (USD Million) by Country (2018-2022)
8.6.2 Middle East and Africa Video Email Software Revenue (USD Million) by Type (2018-2022)
8.6.3 Middle East and Africa Video Email Software Revenue (USD Million) by Applications (2018-2022)
9 Company Profiles
10 Global Video Email Software Market Revenue (USD Million), by Type, and Applications (2023-2030)
10.1 Global Video Email Software Revenue (USD Million) and Market Share (%) by Type (2023-2030)
10.1.1 Global Video Email Software Revenue (USD Million), and Market Share (%) by Type (2023-2030)
10.2 Global Video Email Software Revenue (USD Million) and Market Share (%) by Applications (2023-2030)
10.2.1 Global Video Email Software Revenue (USD Million), and Market Share (%) by Applications (2023-2030)
11 Global Video Email Software Development Regional Status and Outlook Forecast
11.1 Global Video Email Software Revenue (USD Million) By Regions (2023-2030)
11.2 North America Video Email Software Revenue (USD Million) by Type, and Applications (2023-2030)
11.2.1 North America Video Email Software Revenue (USD) Million by Country (2023-2030)
11.2.2 North America Video Email Software Revenue (USD Million), by Type (2023-2030)
11.2.3 North America Video Email Software Revenue (USD Million), Market Share (%) by Applications (2023-2030)
11.3 Europe Video Email Software Revenue (USD Million), by Type, and Applications (2023-2030)
11.3.1 Europe Video Email Software Revenue (USD Million), by Country (2023-2030)
11.3.2 Europe Video Email Software Revenue (USD Million), by Type (2023-2030)
11.3.3 Europe Video Email Software Revenue (USD Million), by Applications (2023-2030)
11.4 Asia Pacific Video Email Software Revenue (USD Million) by Type, and Applications (2023-2030)
11.4.1 Asia Pacific Video Email Software Revenue (USD Million), by Country (2023-2030)
11.4.2 Asia Pacific Video Email Software Revenue (USD Million), by Type (2023-2030)
11.4.3 Asia Pacific Video Email Software Revenue (USD Million), by Applications (2023-2030)
11.5 South America Video Email Software Revenue (USD Million), by Type, and Applications (2023-2030)
11.5.1 South America Video Email Software Revenue (USD Million), by Country (2023-2030)
11.5.2 South America Video Email Software Revenue (USD Million), by Type (2023-2030)
11.5.3 South America Video Email Software Revenue (USD Million), by Applications (2023-2030)
11.6 Middle East and Africa Video Email Software Revenue (USD Million), by Type, and Applications (2023-2030)
11.6.1 Middle East and Africa Video Email Software Revenue (USD Million), by region (2023-2030)
11.6.2 Middle East and Africa Video Email Software Revenue (USD Million), by Type (2023-2030)
11.6.3 Middle East and Africa Video Email Software Revenue (USD Million), by Applications (2023-2030)
12 Methodology and Data Sources
12.1 Methodology/Research Approach
12.1.1 Research Programs/Design
12.1.2 Market Size Estimation
12.1.3 Market Breakdown and Data Triangulation
12.2 Data Sources
12.2.1 Secondary Sources
12.2.2 Primary Sources
12.3 Disclaimer
List of Tables
Table 1 Market Segmentation Analysis
Table 2 Global Video Email Software Market Companies with Areas Served
Table 3 Products Offerings Global Video Email Software Market
Table 4 Low Growth Scenario Forecasts
Table 5 Reference Case Growth Scenario
Table 6 High Growth Case Scenario
Table 7 Global Video Email Software Revenue (USD Million) And CAGR (%) By Type (2018-2030)
Table 8 Global Video Email Software Revenue (USD Million) And CAGR (%) By Applications (2018-2030)
Table 9 Global Video Email Software Revenue (USD Million) And CAGR (%) By Regions (2018-2030)
Table 10 Global Video Email Software Revenue (USD Million) By Type (2018-2022)
Table 11 Global Video Email Software Revenue Market Share (%) By Type (2018-2022)
Table 12 Global Video Email Software Revenue (USD Million) By Applications (2018-2022)
Table 13 Global Video Email Software Revenue Market Share (%) By Applications (2018-2022)
Table 14 Global Video Email Software Market Revenue (USD Million) By Regions (2018-2022)
Table 15 Global Video Email Software Market Share (%) By Regions (2018-2022)
Table 16 North America Video Email Software Revenue (USD Million) By Country (2018-2022)
Table 17 North America Video Email Software Revenue (USD Million) By Type (2018-2022)
Table 18 North America Video Email Software Revenue (USD Million) By Applications (2018-2022)
Table 19 Europe Video Email Software Revenue (USD Million) By Country (2018-2022)
Table 20 Europe Video Email Software Revenue (USD Million) By Type (2018-2022)
Table 21 Europe Video Email Software Revenue (USD Million) By Applications (2018-2022)
Table 22 Asia Pacific Video Email Software Revenue (USD Million) By Country (2018-2022)
Table 23 Asia Pacific Video Email Software Revenue (USD Million) By Type (2018-2022)
Table 24 Asia Pacific Video Email Software Revenue (USD Million) By Applications (2018-2022)
Table 25 South America Video Email Software Revenue (USD Million) By Country (2018-2022)
Table 26 South America Video Email Software Revenue (USD Million) By Type (2018-2022)
Table 27 South America Video Email Software Revenue (USD Million) By Applications (2018-2022)
Table 28 Middle East and Africa Video Email Software Revenue (USD Million) By Region (2018-2022)
Table 29 Middle East and Africa Video Email Software Revenue (USD Million) By Type (2018-2022)
Table 30 Middle East and Africa Video Email Software Revenue (USD Million) By Applications (2018-2022)
Table 31 Financial Analysis
Table 32 Global Video Email Software Revenue (USD Million) By Type (2023-2030)
Table 33 Global Video Email Software Revenue Market Share (%) By Type (2023-2030)
Table 34 Global Video Email Software Revenue (USD Million) By Applications (2023-2030)
Table 35 Global Video Email Software Revenue Market Share (%) By Applications (2023-2030)
Table 36 Global Video Email Software Market Revenue (USD Million), And Revenue (USD Million) By Regions (2023-2030)
Table 37 North America Video Email Software Revenue (USD)By Country (2023-2030)
Table 38 North America Video Email Software Revenue (USD Million) By Type (2023-2030)
Table 39 North America Video Email Software Revenue (USD Million) By Applications (2023-2030)
Table 40 Europe Video Email Software Revenue (USD Million) By Country (2023-2030)
Table 41 Europe Video Email Software Revenue (USD Million) By Type (2023-2030)
Table 42 Europe Video Email Software Revenue (USD Million) By Applications (2023-2030)
Table 43 Asia Pacific Video Email Software Revenue (USD Million) By Country (2023-2030)
Table 44 Asia Pacific Video Email Software Revenue (USD Million) By Type (2023-2030)
Table 45 Asia Pacific Video Email Software Revenue (USD Million) By Applications (2023-2030)
Table 46 South America Video Email Software Revenue (USD Million) By Country (2023-2030)
Table 47 South America Video Email Software Revenue (USD Million) By Type (2023-2030)
Table 48 South America Video Email Software Revenue (USD Million) By Applications (2023-2030)
Table 49 Middle East and Africa Video Email Software Revenue (USD Million) By Region (2023-2030)
Table 50 Middle East and Africa Video Email Software Revenue (USD Million) By Region (2023-2030)
Table 51 Middle East and Africa Video Email Software Revenue (USD Million) By Type (2023-2030)
Table 52 Middle East and Africa Video Email Software Revenue (USD Million) By Applications (2023-2030)
Table 53 Research Programs/Design for This Report
Table 54 Key Data Information from Secondary Sources
Table 55 Key Data Information from Primary Sources
List of Figures
Figure 1 Market Scope
Figure 2 Porter’s Five Forces
Figure 3 Global Video Email Software Revenue (USD Million) By Type (2018-2022)
Figure 4 Global Video Email Software Revenue Market Share (%) By Type (2022)
Figure 5 Global Video Email Software Revenue (USD Million) By Applications (2018-2022)
Figure 6 Global Video Email Software Revenue Market Share (%) By Applications (2022)
Figure 7 Global Video Email Software Market Revenue (USD Million) By Regions (2018-2022)
Figure 8 Global Video Email Software Market Share (%) By Regions (2022)
Figure 9 North America Video Email Software Revenue (USD Million) By Country (2018-2022)
Figure 10 North America Video Email Software Revenue (USD Million) By Type (2018-2022)
Figure 11 North America Video Email Software Revenue (USD Million) By Applications (2018-2022)
Figure 12 Europe Video Email Software Revenue (USD Million) By Country (2018-2022)
Figure 13 Europe Video Email Software Revenue (USD Million) By Type (2018-2022)
Figure 14 Europe Video Email Software Revenue (USD Million) By Applications (2018-2022)
Figure 15 Asia Pacific Video Email Software Revenue (USD Million) By Country (2018-2022)
Figure 16 Asia Pacific Video Email Software Revenue (USD Million) By Type (2018-2022)
Figure 17 Asia Pacific Video Email Software Revenue (USD Million) By Applications (2018-2022)
Figure 18 South America Video Email Software Revenue (USD Million) By Country (2018-2022)
Figure 19 South America Video Email Software Revenue (USD Million) By Type (2018-2022)
Figure 20 South America Video Email Software Revenue (USD Million) By Applications (2018-2022)
Figure 21 Middle East and Africa Video Email Software Revenue (USD Million) By Region (2018-2022)
Figure 22 Middle East and Africa Video Email Software Revenue (USD Million) By Type (2018-2022)
Figure 23 Middle East and Africa Video Email Software Revenue (USD Million) By Applications (2018-2022)
Figure 24 Global Video Email Software Revenue (USD Million) By Type (2023-2030)
Figure 25 Global Video Email Software Revenue Market Share (%) By Type (2030)
Figure 26 Global Video Email Software Revenue (USD Million) By Applications (2023-2030)
Figure 27 Global Video Email Software Revenue Market Share (%) By Applications (2030)
Figure 28 Global Video Email Software Market Revenue (USD Million) By Regions (2023-2030)
Figure 29 North America Video Email Software Revenue (USD Million) By Country (2023-2030)
Figure 30 North America Video Email Software Revenue (USD Million) By Type (2023-2030)
Figure 31 North America Video Email Software Revenue (USD Million) By Applications (2023-2030)
Figure 32 Europe Video Email Software Revenue (USD Million) By Country (2023-2030)
Figure 33 Europe Video Email Software Revenue (USD Million) By Type (2023-2030)
Figure 34 Europe Video Email Software Revenue (USD Million) By Applications (2023-2030)
Figure 35 Asia Pacific Video Email Software Revenue (USD Million) By Country (2023-2030)
Figure 36 Asia Pacific Video Email Software Revenue (USD Million) By Type (2023-2030)
Figure 37 Asia Pacific Video Email Software Revenue (USD Million) By Applications (2023-2030)
Figure 38 South America Video Email Software Revenue (USD Million) By Country (2023-2030)
Figure 39 South America Video Email Software Revenue (USD Million) By Type (2023-2030)
Figure 40 South America Video Email Software Revenue (USD Million) By Applications (2023-2030)
Figure 41 Middle East and Africa Video Email Software Revenue (USD Million) By Region (2023-2030)
Figure 42 Middle East and Africa Video Email Software Revenue (USD Million) By Region (2023-2030)
Figure 43 Middle East and Africa Video Email Software Revenue (USD Million) By Type (2023-2030)
Figure 44 Middle East and Africa Video Email Software Revenue (USD Million) By Applications (2023-2030)
Figure 45 Bottom-Up and Top-Down Approaches for This Report
Figure 46 Data Triangulation
