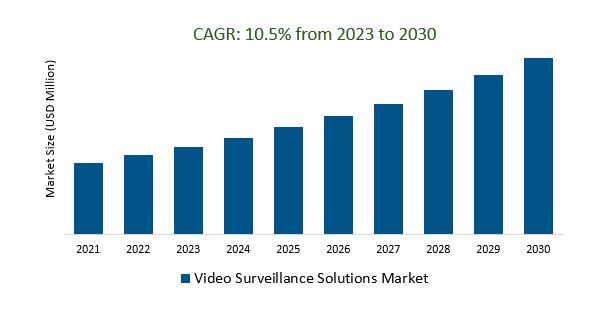
The Global Video Surveillance Solutions Market Size is estimated to register 10.5% growth over the forecast period from 2023 to 2030.
The market growth is driven by the increasing Ongoing security threats and incidents that drive the demand for video surveillance as a means of deterring and responding to criminal activities. Leading companies that are focused on Technological Advancements, Increased Security Concerns, Urbanization and Smart Cities, Transportation and Critical Infrastructure, AI and Analytics, Cloud-Based Solutions, and others to boost market shares in the industry.
Market Overview
The Video Surveillance Solutions Market is a rapidly growing industry, valued in the tens of billions of dollars, driven by increasing security concerns, technological advancements, and applications in security, traffic management, retail, smart cities, and more. Key components include cameras, video management software, storage solutions, analytics, and networking infrastructure, with trends such as artificial intelligence integration, cloud-based solutions, and IoT connectivity shaping the market's evolution. However, challenges include privacy concerns, cybersecurity threats, data protection regulations, and initial implementation costs.
Market Dynamics
Market Trends - Video surveillance solutions can protect assets and boost productivity in the industrial and manufacturing sector
Video surveillance solutions in the industrial and manufacturing sectors enhance security by deterring theft and unauthorized access, protecting valuable assets and equipment, ensuring safety compliance, and aiding in quality control. They also contribute to operational efficiency by monitoring processes and workflows, offering remote access for real-time monitoring and decision-making, helping manage employee productivity, providing crucial documentation for investigations, and serving as a deterrent against theft. When implemented within legal and ethical boundaries, these systems are valuable tools for improving overall security and productivity in industrial and manufacturing settings.
Market Driver- Retail and commercial applications are driving the video surveillance solutions market
Retail and commercial applications are major drivers of the video surveillance solutions market. These industries utilize video surveillance for security, loss prevention, employee productivity monitoring, customer safety, operational efficiency, data analytics, compliance, and remote monitoring. The integration of advanced technologies like AI and machine learning has further enhanced the capabilities of video surveillance systems in these sectors.
Market Opportunity-Introduction of Data Analytics and Insights
Data analytics and insights play a crucial role in the video surveillance solutions market. They enable businesses and organizations to extract valuable information from the vast amount of video data collected through surveillance systems. These insights help in identifying trends, anomalies, and potential security threats. With the application of advanced analytics techniques, such as facial recognition and object detection, businesses can not only enhance security but also gain valuable business intelligence. This data-driven approach allows for more informed decision-making, optimizing operational processes, and improving overall efficiency in various sectors, including retail, commercial, and beyond.
Market Share Analysis- Hardware Video Surveillance Solutions Market will register the fastest growth
The Global Video Surveillance Solutions Market is analyzed across Hardware, Software, and others. Hardware is poised to register the fastest growth. The hardware segment is pivotal in the video surveillance solutions market, encompassing cameras, recorders, storage, and networking equipment. Continuous innovation in camera technology, higher resolution, increased storage capacity, and efficient data transmission meet the demand for reliable and high-quality hardware across sectors, enhancing security and surveillance capabilities through technological upgrades and integration with software and analytics solutions.
Market Share Analysis- Commercial held a significant market share in 2023
The Global Video Surveillance Solutions Market is analyzed across various applications including Commercial, Industrial, and others. Of these, Commercial held a significant market share in 2023. The commercial sector is a significant driver of the video surveillance solutions market, using these systems for security, safety, and operational improvements. Businesses in various industries employ video surveillance to enhance security, prevent theft, monitor employees, ensure customer safety, optimize operations, and comply with regulations. Integration of advanced technologies like AI and analytics is increasingly common, expanding the capabilities of video surveillance systems for improved efficiency and safety.
Video Surveillance Solutions Market Segmentation
By Type
By Application
- Commercial
- Industrial
- Others
By Sales Channel
- Direct Channel
- Distribution Channel
By Region
- North America (United States, Canada, Mexico)
- Europe (Germany, France, United Kingdom, Spain, Italy, Others)
- Asia Pacific (China, India, Japan, South Korea, Australia, Others)
- Latin America (Brazil, Argentina, Others)
- Middle East and Africa (Saudi Arabia, UAE, Kuwait, Other Middle East, South Africa, Nigeria, Other Africa)
Video Surveillance Solutions Market Companies
- D-Link Corporation
- IndigoVision
- Vista IT Solutions
- Avigilon
- Cisco
- Honeywell
- Axis Communication
- Genetec
- HKVISION
- Vivotek
- Panasonic
- Milestone Systems
- Costar Technologies
- Johnson Controls
- Comcast
- Eagle Eye Networks
- Pacific Controls
- Brivo
- MIRASYS
- Duranc
- Stanley Black & Decker
*List not exhaustive
Video Surveillance Solutions Market Outlook 2023
1 Market Overview
1.1 Introduction to the Video Surveillance Solutions Market
1.2 Scope of the Study
1.3 Research Objective
1.3.1 Key Market Scope and Segments
1.3.2 Players Covered
1.3.3 Years Considered
2 Executive Summary
2.1 2023 Video Surveillance Solutions Industry- Market Statistics
3 Market Dynamics
3.1 Market Drivers
3.2 Market Challenges
3.3 Market Opportunities
3.4 Market Trends
4 Market Factor Analysis
4.1 Porter’s Five Forces
4.2 Market Entropy
4.2.1 Global Video Surveillance Solutions Market Companies with Area Served
4.2.2 Products Offerings Global Video Surveillance Solutions Market
5 COVID-19 Impact Analysis and Outlook Scenarios
5.1.1 Covid-19 Impact Analysis
5.1.2 Post-COVID-19 Scenario- Low Growth Case
5.1.3 Post-COVID-19 Scenario- Reference Growth Case
5.1.4 Post-COVID-19 Scenario- Low Growth Case
6 Global Video Surveillance Solutions Market Trends
6.1 Global Video Surveillance Solutions Revenue (USD Million) and CAGR (%) by Type (2018-2030)
6.2 Global Video Surveillance Solutions Revenue (USD Million) and CAGR (%) by Applications (2018-2030)
6.3 Global Video Surveillance Solutions Revenue (USD Million) and CAGR (%) by Regions (2018-2030)
7 Global Video Surveillance Solutions Market Revenue (USD Million) by Type, and Applications (2018-2022)
7.1 Global Video Surveillance Solutions Revenue (USD Million) by Type (2018-2022)
7.1.1 Global Video Surveillance Solutions Revenue (USD Million), Market Share (%) by Type (2018-2022)
7.2 Global Video Surveillance Solutions Revenue (USD Million) by Applications (2018-2022)
7.2.1 Global Video Surveillance Solutions Revenue (USD Million), Market Share (%) by Applications (2018-2022)
8 Global Video Surveillance Solutions Development Regional Status and Outlook
8.1 Global Video Surveillance Solutions Revenue (USD Million) By Regions (2018-2022)
8.2 North America Video Surveillance Solutions Revenue (USD Million) by Type, and Application (2018-2022)
8.2.1 North America Video Surveillance Solutions Revenue (USD Million) by Country (2018-2022)
8.2.2 North America Video Surveillance Solutions Revenue (USD Million) by Type (2018-2022)
8.2.3 North America Video Surveillance Solutions Revenue (USD Million) by Applications (2018-2022)
8.3 Europe Video Surveillance Solutions Revenue (USD Million), by Type, and Applications (USD Million) (2018-2022)
8.3.1 Europe Video Surveillance Solutions Revenue (USD Million), by Country (2018-2022)
8.3.2 Europe Video Surveillance Solutions Revenue (USD Million) by Type (2018-2022)
8.3.3 Europe Video Surveillance Solutions Revenue (USD Million) by Applications (2018-2022)
8.4 Asia Pacific Video Surveillance Solutions Revenue (USD Million), and Revenue (USD Million) by Type, and Applications (2018-2022)
8.4.1 Asia Pacific Video Surveillance Solutions Revenue (USD Million) by Country (2018-2022)
8.4.2 Asia Pacific Video Surveillance Solutions Revenue (USD Million) by Type (2018-2022)
8.4.3 Asia Pacific Video Surveillance Solutions Revenue (USD Million) by Applications (2018-2022)
8.5 South America Video Surveillance Solutions Revenue (USD Million), by Type, and Applications (2018-2022)
8.5.1 South America Video Surveillance Solutions Revenue (USD Million), by Country (2018-2022)
8.5.2 South America Video Surveillance Solutions Revenue (USD Million) by Type (2018-2022)
8.5.3 South America Video Surveillance Solutions Revenue (USD Million) by Applications (2018-2022)
8.6 Middle East and Africa Video Surveillance Solutions Revenue (USD Million), by Type, Technology, Application, Thickness (2018-2022)
8.6.1 Middle East and Africa Video Surveillance Solutions Revenue (USD Million) by Country (2018-2022)
8.6.2 Middle East and Africa Video Surveillance Solutions Revenue (USD Million) by Type (2018-2022)
8.6.3 Middle East and Africa Video Surveillance Solutions Revenue (USD Million) by Applications (2018-2022)
9 Company Profiles
10 Global Video Surveillance Solutions Market Revenue (USD Million), by Type, and Applications (2023-2030)
10.1 Global Video Surveillance Solutions Revenue (USD Million) and Market Share (%) by Type (2023-2030)
10.1.1 Global Video Surveillance Solutions Revenue (USD Million), and Market Share (%) by Type (2023-2030)
10.2 Global Video Surveillance Solutions Revenue (USD Million) and Market Share (%) by Applications (2023-2030)
10.2.1 Global Video Surveillance Solutions Revenue (USD Million), and Market Share (%) by Applications (2023-2030)
11 Global Video Surveillance Solutions Development Regional Status and Outlook Forecast
11.1 Global Video Surveillance Solutions Revenue (USD Million) By Regions (2023-2030)
11.2 North America Video Surveillance Solutions Revenue (USD Million) by Type, and Applications (2023-2030)
11.2.1 North America Video Surveillance Solutions Revenue (USD) Million by Country (2023-2030)
11.2.2 North America Video Surveillance Solutions Revenue (USD Million), by Type (2023-2030)
11.2.3 North America Video Surveillance Solutions Revenue (USD Million), Market Share (%) by Applications (2023-2030)
11.3 Europe Video Surveillance Solutions Revenue (USD Million), by Type, and Applications (2023-2030)
11.3.1 Europe Video Surveillance Solutions Revenue (USD Million), by Country (2023-2030)
11.3.2 Europe Video Surveillance Solutions Revenue (USD Million), by Type (2023-2030)
11.3.3 Europe Video Surveillance Solutions Revenue (USD Million), by Applications (2023-2030)
11.4 Asia Pacific Video Surveillance Solutions Revenue (USD Million) by Type, and Applications (2023-2030)
11.4.1 Asia Pacific Video Surveillance Solutions Revenue (USD Million), by Country (2023-2030)
11.4.2 Asia Pacific Video Surveillance Solutions Revenue (USD Million), by Type (2023-2030)
11.4.3 Asia Pacific Video Surveillance Solutions Revenue (USD Million), by Applications (2023-2030)
11.5 South America Video Surveillance Solutions Revenue (USD Million), by Type, and Applications (2023-2030)
11.5.1 South America Video Surveillance Solutions Revenue (USD Million), by Country (2023-2030)
11.5.2 South America Video Surveillance Solutions Revenue (USD Million), by Type (2023-2030)
11.5.3 South America Video Surveillance Solutions Revenue (USD Million), by Applications (2023-2030)
11.6 Middle East and Africa Video Surveillance Solutions Revenue (USD Million), by Type, and Applications (2023-2030)
11.6.1 Middle East and Africa Video Surveillance Solutions Revenue (USD Million), by Region (2023-2030)
11.6.2 Middle East and Africa Video Surveillance Solutions Revenue (USD Million), by Type (2023-2030)
11.6.3 Middle East and Africa Video Surveillance Solutions Revenue (USD Million), by Applications (2023-2030)
12 Methodology and Data Sources
12.1 Methodology/Research Approach
12.1.1 Research Programs/Design
12.1.2 Market Size Estimation
12.1.3 Market Breakdown and Data Triangulation
12.2 Data Sources
12.2.1 Secondary Sources
12.2.2 Primary Sources
12.3 Disclaimer
List of Tables
Table 1 Market Segmentation Analysis
Table 2 Global Video Surveillance Solutions Market Companies with Areas Served
Table 3 Products Offerings Global Video Surveillance Solutions Market
Table 4 Low Growth Scenario Forecasts
Table 5 Reference Case Growth Scenario
Table 6 High Growth Case Scenario
Table 7 Global Video Surveillance Solutions Revenue (USD Million) And CAGR (%) By Type (2018-2030)
Table 8 Global Video Surveillance Solutions Revenue (USD Million) And CAGR (%) By Applications (2018-2030)
Table 9 Global Video Surveillance Solutions Revenue (USD Million) And CAGR (%) By Regions (2018-2030)
Table 10 Global Video Surveillance Solutions Revenue (USD Million) By Type (2018-2022)
Table 11 Global Video Surveillance Solutions Revenue Market Share (%) By Type (2018-2022)
Table 12 Global Video Surveillance Solutions Revenue (USD Million) By Applications (2018-2022)
Table 13 Global Video Surveillance Solutions Revenue Market Share (%) By Applications (2018-2022)
Table 14 Global Video Surveillance Solutions Market Revenue (USD Million) By Regions (2018-2022)
Table 15 Global Video Surveillance Solutions Market Share (%) By Regions (2018-2022)
Table 16 North America Video Surveillance Solutions Revenue (USD Million) By Country (2018-2022)
Table 17 North America Video Surveillance Solutions Revenue (USD Million) By Type (2018-2022)
Table 18 North America Video Surveillance Solutions Revenue (USD Million) By Applications (2018-2022)
Table 19 Europe Video Surveillance Solutions Revenue (USD Million) By Country (2018-2022)
Table 20 Europe Video Surveillance Solutions Revenue (USD Million) By Type (2018-2022)
Table 21 Europe Video Surveillance Solutions Revenue (USD Million) By Applications (2018-2022)
Table 22 Asia Pacific Video Surveillance Solutions Revenue (USD Million) By Country (2018-2022)
Table 23 Asia Pacific Video Surveillance Solutions Revenue (USD Million) By Type (2018-2022)
Table 24 Asia Pacific Video Surveillance Solutions Revenue (USD Million) By Applications (2018-2022)
Table 25 South America Video Surveillance Solutions Revenue (USD Million) By Country (2018-2022)
Table 26 South America Video Surveillance Solutions Revenue (USD Million) By Type (2018-2022)
Table 27 South America Video Surveillance Solutions Revenue (USD Million) By Applications (2018-2022)
Table 28 Middle East and Africa Video Surveillance Solutions Revenue (USD Million) By Region (2018-2022)
Table 29 Middle East and Africa Video Surveillance Solutions Revenue (USD Million) By Type (2018-2022)
Table 30 Middle East and Africa Video Surveillance Solutions Revenue (USD Million) By Applications (2018-2022)
Table 31 Financial Analysis
Table 32 Global Video Surveillance Solutions Revenue (USD Million) By Type (2023-2030)
Table 33 Global Video Surveillance Solutions Revenue Market Share (%) By Type (2023-2030)
Table 34 Global Video Surveillance Solutions Revenue (USD Million) By Applications (2023-2030)
Table 35 Global Video Surveillance Solutions Revenue Market Share (%) By Applications (2023-2030)
Table 36 Global Video Surveillance Solutions Market Revenue (USD Million), And Revenue (USD Million) By Regions (2023-2030)
Table 37 North America Video Surveillance Solutions Revenue (USD)By Country (2023-2030)
Table 38 North America Video Surveillance Solutions Revenue (USD Million) By Type (2023-2030)
Table 39 North America Video Surveillance Solutions Revenue (USD Million) By Applications (2023-2030)
Table 40 Europe Video Surveillance Solutions Revenue (USD Million) By Country (2023-2030)
Table 41 Europe Video Surveillance Solutions Revenue (USD Million) By Type (2023-2030)
Table 42 Europe Video Surveillance Solutions Revenue (USD Million) By Applications (2023-2030)
Table 43 Asia Pacific Video Surveillance Solutions Revenue (USD Million) By Country (2023-2030)
Table 44 Asia Pacific Video Surveillance Solutions Revenue (USD Million) By Type (2023-2030)
Table 45 Asia Pacific Video Surveillance Solutions Revenue (USD Million) By Applications (2023-2030)
Table 46 South America Video Surveillance Solutions Revenue (USD Million) By Country (2023-2030)
Table 47 South America Video Surveillance Solutions Revenue (USD Million) By Type (2023-2030)
Table 48 South America Video Surveillance Solutions Revenue (USD Million) By Applications (2023-2030)
Table 49 Middle East and Africa Video Surveillance Solutions Revenue (USD Million) By Region (2023-2030)
Table 50 Middle East and Africa Video Surveillance Solutions Revenue (USD Million) By Region (2023-2030)
Table 51 Middle East and Africa Video Surveillance Solutions Revenue (USD Million) By Type (2023-2030)
Table 52 Middle East and Africa Video Surveillance Solutions Revenue (USD Million) By Applications (2023-2030)
Table 53 Research Programs/Design for This Report
Table 54 Key Data Information from Secondary Sources
Table 55 Key Data Information from Primary Sources
List of Figures
Figure 1 Market Scope
Figure 2 Porter’s Five Forces
Figure 3 Global Video Surveillance Solutions Revenue (USD Million) By Type (2018-2022)
Figure 4 Global Video Surveillance Solutions Revenue Market Share (%) By Type (2022)
Figure 5 Global Video Surveillance Solutions Revenue (USD Million) By Applications (2018-2022)
Figure 6 Global Video Surveillance Solutions Revenue Market Share (%) By Applications (2022)
Figure 7 Global Video Surveillance Solutions Market Revenue (USD Million) By Regions (2018-2022)
Figure 8 Global Video Surveillance Solutions Market Share (%) By Regions (2022)
Figure 9 North America Video Surveillance Solutions Revenue (USD Million) By Country (2018-2022)
Figure 10 North America Video Surveillance Solutions Revenue (USD Million) By Type (2018-2022)
Figure 11 North America Video Surveillance Solutions Revenue (USD Million) By Applications (2018-2022)
Figure 12 Europe Video Surveillance Solutions Revenue (USD Million) By Country (2018-2022)
Figure 13 Europe Video Surveillance Solutions Revenue (USD Million) By Type (2018-2022)
Figure 14 Europe Video Surveillance Solutions Revenue (USD Million) By Applications (2018-2022)
Figure 15 Asia Pacific Video Surveillance Solutions Revenue (USD Million) By Country (2018-2022)
Figure 16 Asia Pacific Video Surveillance Solutions Revenue (USD Million) By Type (2018-2022)
Figure 17 Asia Pacific Video Surveillance Solutions Revenue (USD Million) By Applications (2018-2022)
Figure 18 South America Video Surveillance Solutions Revenue (USD Million) By Country (2018-2022)
Figure 19 South America Video Surveillance Solutions Revenue (USD Million) By Type (2018-2022)
Figure 20 South America Video Surveillance Solutions Revenue (USD Million) By Applications (2018-2022)
Figure 21 Middle East and Africa Video Surveillance Solutions Revenue (USD Million) By Region (2018-2022)
Figure 22 Middle East and Africa Video Surveillance Solutions Revenue (USD Million) By Type (2018-2022)
Figure 23 Middle East and Africa Video Surveillance Solutions Revenue (USD Million) By Applications (2018-2022)
Figure 24 Global Video Surveillance Solutions Revenue (USD Million) By Type (2023-2030)
Figure 25 Global Video Surveillance Solutions Revenue Market Share (%) By Type (2030)
Figure 26 Global Video Surveillance Solutions Revenue (USD Million) By Applications (2023-2030)
Figure 27 Global Video Surveillance Solutions Revenue Market Share (%) By Applications (2030)
Figure 28 Global Video Surveillance Solutions Market Revenue (USD Million) By Regions (2023-2030)
Figure 29 North America Video Surveillance Solutions Revenue (USD Million) By Country (2023-2030)
Figure 30 North America Video Surveillance Solutions Revenue (USD Million) By Type (2023-2030)
Figure 31 North America Video Surveillance Solutions Revenue (USD Million) By Applications (2023-2030)
Figure 32 Europe Video Surveillance Solutions Revenue (USD Million) By Country (2023-2030)
Figure 33 Europe Video Surveillance Solutions Revenue (USD Million) By Type (2023-2030)
Figure 34 Europe Video Surveillance Solutions Revenue (USD Million) By Applications (2023-2030)
Figure 35 Asia Pacific Video Surveillance Solutions Revenue (USD Million) By Country (2023-2030)
Figure 36 Asia Pacific Video Surveillance Solutions Revenue (USD Million) By Type (2023-2030)
Figure 37 Asia Pacific Video Surveillance Solutions Revenue (USD Million) By Applications (2023-2030)
Figure 38 South America Video Surveillance Solutions Revenue (USD Million) By Country (2023-2030)
Figure 39 South America Video Surveillance Solutions Revenue (USD Million) By Type (2023-2030)
Figure 40 South America Video Surveillance Solutions Revenue (USD Million) By Applications (2023-2030)
Figure 41 Middle East and Africa Video Surveillance Solutions Revenue (USD Million) By Region (2023-2030)
Figure 42 Middle East and Africa Video Surveillance Solutions Revenue (USD Million) By Region (2023-2030)
Figure 43 Middle East and Africa Video Surveillance Solutions Revenue (USD Million) By Type (2023-2030)
Figure 44 Middle East and Africa Video Surveillance Solutions Revenue (USD Million) By Applications (2023-2030)
Figure 45 Bottom-Up and Top-Down Approaches For This Report
Figure 46 Data Triangulation
