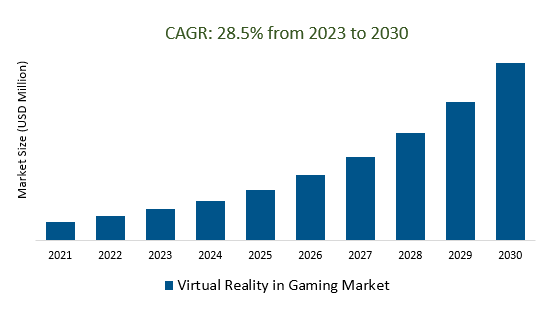
The Global Virtual Reality in Gaming Market Size is estimated to register 28.5% growth over the forecast period from 2023 to 2030.
The market growth is driven by increasing investments from both tech giants and venture capitalists have boosted the VR gaming market, enabling the development of innovative VR products and services. Leading Companies focusing on Enhanced Hardware, Content Diversity, Cross-Platform Play, Health and Fitness VR, and others to boost market shares in the industry.
Market Overview
The virtual reality (VR) gaming market was a rapidly growing sector driven by technological advancements, expanding content offerings, and the rise of eSports. High-quality content, wireless and standalone VR options, and social experiences were key drivers. However, challenges included high entry costs and concerns related to motion sickness. Future trends encompassed cross-platform play, augmented reality integration, health and fitness applications, educational uses, and market expansion, particularly in emerging regions like Asia.
Market Dynamics
Market Trends- Higher resolution displays are essential for providing a more immersive and realistic VR gaming experience
Higher-resolution displays are an essential element in the Virtual Reality (VR) gaming market, as they play a pivotal role in delivering a truly immersive and realistic experience to gamers. In VR, the quality of the visual experience is paramount, and higher-resolution displays are fundamental for achieving this. They enable sharper, more detailed graphics and reduce the screen-door effect, where visible lines or grid patterns can detract from immersion. With improved resolutions, textures, environments, and character models appear more lifelike, enhancing the sense of presence and making VR environments feel more convincing.
Market Driver- The demand for wireless VR headsets is growing rapidly in the gaming market.
The demand for wireless VR headsets is experiencing rapid growth in the gaming market, representing a significant shift in the industry. Wireless VR headsets offer players greater freedom of movement and convenience, eliminating the need for tethered connections to powerful PCs or consoles. This untethered experience not only enhances comfort and accessibility but also opens up new possibilities for location-based and mobile VR gaming. Gamers can engage in immersive experiences without being constrained by wires, making VR gaming more user-friendly and appealing to a broader audience. This shift aligns with the industry's trajectory towards increased convenience, paving the way for a more inclusive and dynamic future for virtual reality in gaming.
Market Opportunity- The integration of augmented reality (AR) with VR gaming is creating new and innovative gaming experiences
The integration of augmented reality (AR) with VR gaming is at the forefront of creating groundbreaking gaming experiences. This convergence of AR and VR technologies, often referred to as mixed reality (MR), blends virtual and real-world elements, offering players a dynamic and interactive fusion of digital and physical surroundings. Through AR-VR integration, gamers can see and interact with computer-generated objects or characters within their actual physical environment, which not only adds an extra layer of immersion but also unlocks a multitude of creative gameplay possibilities.
Market Share Analysis- Hardware Virtual Reality in Gaming Market will register the fastest growth
The Global Virtual Reality in Gaming Market is analyzed across Hardware, Software, and others. Hardware is poised to register the fastest growth. The hardware segment in the virtual reality (VR) gaming market comprises VR headsets, motion controllers, tracking sensors, and the necessary computing hardware. Key companies such as Oculus, HTC, Sony, and Valve are major players in the production of VR hardware. Continuous innovation in display technology, ergonomics, and performance aims to enhance the immersive gaming experience. The market is closely tied to software development, with content creators optimizing games for the latest hardware. Advancements in wireless and standalone VR solutions aim to increase accessibility, but cost and hardware requirements remain challenges.
Market Share Analysis- PC held a significant market share in 2023
The Global Virtual Reality in the Gaming Market is analyzed across various Connecting Devices including Gaming Console, PCs, Desktop, Smartphones, and others. Of these, PC held a significant market share in 2023. VR-ready PCs in the gaming market are high-performance computers equipped with powerful processors, high-end graphics cards, ample RAM, and fast storage to run VR content effectively. These systems are essential for immersive VR gaming experiences, especially for demanding, graphically intensive games. The market is driven by the growing popularity of VR gaming but is hindered by the high cost of such PCs and the need for regular hardware upgrades to keep pace with VR advancements. For the latest information, consult recent industry reports and news sources.
Virtual Reality in Gaming Market Segmentation
By Component
By Connecting Device
- Gaming Console
- PC
- Desktop
- Smartphone
By End-User
- Commercial Space
- Individual
By Region
- North America (United States, Canada, Mexico)
- Europe (Germany, France, United Kingdom, Spain, Italy, Others)
- Asia Pacific (China, India, Japan, South Korea, Australia, Others)
- Latin America (Brazil, Argentina, Others)
- Middle East and Africa (Saudi Arabia, UAE, Kuwait, Other Middle East, South Africa, Nigeria, Other Africa)
Virtual Reality in Gaming Market Companies
- Virtuix Omni
- Oculus VR
- Valve Corporation
- Google LLC
- Intel Corporation
- Nintendo Co. Limited
- Microsoft Corporation
- HTC Vive
- Samsung Corporation
*List not exhaustive
Virtual Reality in Gaming Market Outlook 2023
1 Market Overview
1.1 Introduction to the Virtual Reality in Gaming Market
1.2 Scope of the Study
1.3 Research Objective
1.3.1 Key Market Scope and Segments
1.3.2 Players Covered
1.3.3 Years Considered
2 Executive Summary
2.1 2023 Virtual Reality in Gaming Industry- Market Statistics
3 Market Dynamics
3.1 Market Drivers
3.2 Market Challenges
3.3 Market Opportunities
3.4 Market Trends
4 Market Factor Analysis
4.1 Porter’s Five Forces
4.2 Market Entropy
4.2.1 Global Virtual Reality in Gaming Market Companies with Area Served
4.2.2 Products Offerings Global Virtual Reality in Gaming Market
5 COVID-19 Impact Analysis and Outlook Scenarios
5.1.1 Covid-19 Impact Analysis
5.1.2 post-COVID-19 Scenario- Low Growth Case
5.1.3 post-COVID-19 Scenario- Reference Growth Case
5.1.4 post-COVID-19 Scenario- Low Growth Case
6 Global Virtual Reality in Gaming Market Trends
6.1 Global Virtual Reality in Gaming Revenue (USD Million) and CAGR (%) by Type (2018-2030)
6.2 Global Virtual Reality in Gaming Revenue (USD Million) and CAGR (%) by Applications (2018-2030)
6.3 Global Virtual Reality in Gaming Revenue (USD Million) and CAGR (%) by regions (2018-2030)
7 Global Virtual Reality in Gaming Market Revenue (USD Million) by Type, and Applications (2018-2022)
7.1 Global Virtual Reality in Gaming Revenue (USD Million) by Type (2018-2022)
7.1.1 Global Virtual Reality in Gaming Revenue (USD Million), Market Share (%) by Type (2018-2022)
7.2 Global Virtual Reality in Gaming Revenue (USD Million) by Applications (2018-2022)
7.2.1 Global Virtual Reality in Gaming Revenue (USD Million), Market Share (%) by Applications (2018-2022)
8 Global Virtual Reality in Gaming Development Regional Status and Outlook
8.1 Global Virtual Reality in Gaming Revenue (USD Million) By Regions (2018-2022)
8.2 North America Virtual Reality in Gaming Revenue (USD Million) by Type, and Application (2018-2022)
8.2.1 North America Virtual Reality in Gaming Revenue (USD Million) by Country (2018-2022)
8.2.2 North America Virtual Reality in Gaming Revenue (USD Million) by Type (2018-2022)
8.2.3 North America Virtual Reality in Gaming Revenue (USD Million) by Applications (2018-2022)
8.3 Europe Virtual Reality in Gaming Revenue (USD Million), by Type, and Applications (USD Million) (2018-2022)
8.3.1 Europe Virtual Reality in Gaming Revenue (USD Million), by Country (2018-2022)
8.3.2 Europe Virtual Reality in Gaming Revenue (USD Million) by Type (2018-2022)
8.3.3 Europe Virtual Reality in Gaming Revenue (USD Million) by Applications (2018-2022)
8.4 Asia Pacific Virtual Reality in Gaming Revenue (USD Million), and Revenue (USD Million) by Type, and Applications (2018-2022)
8.4.1 Asia Pacific Virtual Reality in Gaming Revenue (USD Million) by Country (2018-2022)
8.4.2 Asia Pacific Virtual Reality in Gaming Revenue (USD Million) by Type (2018-2022)
8.4.3 Asia Pacific Virtual Reality in Gaming Revenue (USD Million) by Applications (2018-2022)
8.5 South America Virtual Reality in Gaming Revenue (USD Million), by Type, and Applications (2018-2022)
8.5.1 South America Virtual Reality in Gaming Revenue (USD Million), by Country (2018-2022)
8.5.2 South America Virtual Reality in Gaming Revenue (USD Million) by Type (2018-2022)
8.5.3 South America Virtual Reality in Gaming Revenue (USD Million) by Applications (2018-2022)
8.6 Middle East and Africa Virtual Reality in Gaming Revenue (USD Million), by Type, Technology, Application, Thickness (2018-2022)
8.6.1 Middle East and Africa Virtual Reality in Gaming Revenue (USD Million) by Country (2018-2022)
8.6.2 Middle East and Africa Virtual Reality in Gaming Revenue (USD Million) by Type (2018-2022)
8.6.3 Middle East and Africa Virtual Reality in Gaming Revenue (USD Million) by Applications (2018-2022)
9 Company Profiles
10 Global Virtual Reality in Gaming Market Revenue (USD Million), by Type, and Applications (2023-2030)
10.1 Global Virtual Reality in Gaming Revenue (USD Million) and Market Share (%) by Type (2023-2030)
10.1.1 Global Virtual Reality in Gaming Revenue (USD Million), and Market Share (%) by Type (2023-2030)
10.2 Global Virtual Reality in Gaming Revenue (USD Million) and Market Share (%) by Applications (2023-2030)
10.2.1 Global Virtual Reality in Gaming Revenue (USD Million), and Market Share (%) by Applications (2023-2030)
11 Global Virtual Reality in Gaming Development Regional Status and Outlook Forecast
11.1 Global Virtual Reality in Gaming Revenue (USD Million) By Regions (2023-2030)
11.2 North America Virtual Reality in Gaming Revenue (USD Million) by Type, and Applications (2023-2030)
11.2.1 North America Virtual Reality in Gaming Revenue (USD) Million by Country (2023-2030)
11.2.2 North America Virtual Reality in Gaming Revenue (USD Million), by Type (2023-2030)
11.2.3 North America Virtual Reality in Gaming Revenue (USD Million), Market Share (%) by Applications (2023-2030)
11.3 Europe Virtual Reality in Gaming Revenue (USD Million), by Type, and Applications (2023-2030)
11.3.1 Europe Virtual Reality in Gaming Revenue (USD Million), by Country (2023-2030)
11.3.2 Europe Virtual Reality in Gaming Revenue (USD Million), by Type (2023-2030)
11.3.3 Europe Virtual Reality in Gaming Revenue (USD Million), by Applications (2023-2030)
11.4 Asia Pacific Virtual Reality in Gaming Revenue (USD Million) by Type, and Applications (2023-2030)
11.4.1 Asia Pacific Virtual Reality in Gaming Revenue (USD Million), by Country (2023-2030)
11.4.2 Asia Pacific Virtual Reality in Gaming Revenue (USD Million), by Type (2023-2030)
11.4.3 Asia Pacific Virtual Reality in Gaming Revenue (USD Million), by Applications (2023-2030)
11.5 South America Virtual Reality in Gaming Revenue (USD Million), by Type, and Applications (2023-2030)
11.5.1 South America Virtual Reality in Gaming Revenue (USD Million), by Country (2023-2030)
11.5.2 South America Virtual Reality in Gaming Revenue (USD Million), by Type (2023-2030)
11.5.3 South America Virtual Reality in Gaming Revenue (USD Million), by Applications (2023-2030)
11.6 Middle East and Africa Virtual Reality in Gaming Revenue (USD Million), by Type, and Applications (2023-2030)
11.6.1 Middle East and Africa Virtual Reality in Gaming Revenue (USD Million), by region (2023-2030)
11.6.2 Middle East and Africa Virtual Reality in Gaming Revenue (USD Million), by Type (2023-2030)
11.6.3 Middle East and Africa Virtual Reality in Gaming Revenue (USD Million), by Applications (2023-2030)
12 Methodology and Data Sources
12.1 Methodology/Research Approach
12.1.1 Research Programs/Design
12.1.2 Market Size Estimation
12.1.3 Market Breakdown and Data Triangulation
12.2 Data Sources
12.2.1 Secondary Sources
12.2.2 Primary Sources
12.3 Disclaimer
List of Tables
Table 1 Market Segmentation Analysis
Table 2 Global Virtual Reality in Gaming Market Companies with Areas Served
Table 3 Products Offerings Global Virtual Reality in Gaming Market
Table 4 Low Growth Scenario Forecasts
Table 5 Reference Case Growth Scenario
Table 6 High Growth Case Scenario
Table 7 Global Virtual Reality in Gaming Revenue (USD Million) And CAGR (%) By Type (2018-2030)
Table 8 Global Virtual Reality in Gaming Revenue (USD Million) And CAGR (%) By Applications (2018-2030)
Table 9 Global Virtual Reality in Gaming Revenue (USD Million) And CAGR (%) By Regions (2018-2030)
Table 10 Global Virtual Reality in Gaming Revenue (USD Million) By Type (2018-2022)
Table 11 Global Virtual Reality in Gaming Revenue Market Share (%) By Type (2018-2022)
Table 12 Global Virtual Reality in Gaming Revenue (USD Million) By Applications (2018-2022)
Table 13 Global Virtual Reality in Gaming Revenue Market Share (%) By Applications (2018-2022)
Table 14 Global Virtual Reality in Gaming Market Revenue (USD Million) By Regions (2018-2022)
Table 15 Global Virtual Reality in Gaming Market Share (%) By Regions (2018-2022)
Table 16 North America Virtual Reality in Gaming Revenue (USD Million) By Country (2018-2022)
Table 17 North America Virtual Reality in Gaming Revenue (USD Million) By Type (2018-2022)
Table 18 North America Virtual Reality in Gaming Revenue (USD Million) By Applications (2018-2022)
Table 19 Europe Virtual Reality in Gaming Revenue (USD Million) By Country (2018-2022)
Table 20 Europe Virtual Reality in Gaming Revenue (USD Million) By Type (2018-2022)
Table 21 Europe Virtual Reality in Gaming Revenue (USD Million) By Applications (2018-2022)
Table 22 Asia Pacific Virtual Reality in Gaming Revenue (USD Million) By Country (2018-2022)
Table 23 Asia Pacific Virtual Reality in Gaming Revenue (USD Million) By Type (2018-2022)
Table 24 Asia Pacific Virtual Reality in Gaming Revenue (USD Million) By Applications (2018-2022)
Table 25 South America Virtual Reality in Gaming Revenue (USD Million) By Country (2018-2022)
Table 26 South America Virtual Reality in Gaming Revenue (USD Million) By Type (2018-2022)
Table 27 South America Virtual Reality in Gaming Revenue (USD Million) By Applications (2018-2022)
Table 28 Middle East and Africa Virtual Reality in Gaming Revenue (USD Million) By Region (2018-2022)
Table 29 Middle East and Africa Virtual Reality in Gaming Revenue (USD Million) By Type (2018-2022)
Table 30 Middle East and Africa Virtual Reality in Gaming Revenue (USD Million) By Applications (2018-2022)
Table 31 Financial Analysis
Table 32 Global Virtual Reality in Gaming Revenue (USD Million) By Type (2023-2030)
Table 33 Global Virtual Reality in Gaming Revenue Market Share (%) By Type (2023-2030)
Table 34 Global Virtual Reality in Gaming Revenue (USD Million) By Applications (2023-2030)
Table 35 Global Virtual Reality in Gaming Revenue Market Share (%) By Applications (2023-2030)
Table 36 Global Virtual Reality in Gaming Market Revenue (USD Million), And Revenue (USD Million) By Regions (2023-2030)
Table 37 North America Virtual Reality in Gaming Revenue (USD)By Country (2023-2030)
Table 38 North America Virtual Reality in Gaming Revenue (USD Million) By Type (2023-2030)
Table 39 North America Virtual Reality in Gaming Revenue (USD Million) By Applications (2023-2030)
Table 40 Europe Virtual Reality in Gaming Revenue (USD Million) By Country (2023-2030)
Table 41 Europe Virtual Reality in Gaming Revenue (USD Million) By Type (2023-2030)
Table 42 Europe Virtual Reality in Gaming Revenue (USD Million) By Applications (2023-2030)
Table 43 Asia Pacific Virtual Reality in Gaming Revenue (USD Million) By Country (2023-2030)
Table 44 Asia Pacific Virtual Reality in Gaming Revenue (USD Million) By Type (2023-2030)
Table 45 Asia Pacific Virtual Reality in Gaming Revenue (USD Million) By Applications (2023-2030)
Table 46 South America Virtual Reality in Gaming Revenue (USD Million) By Country (2023-2030)
Table 47 South America Virtual Reality in Gaming Revenue (USD Million) By Type (2023-2030)
Table 48 South America Virtual Reality in Gaming Revenue (USD Million) By Applications (2023-2030)
Table 49 Middle East and Africa Virtual Reality in Gaming Revenue (USD Million) By Region (2023-2030)
Table 50 Middle East and Africa Virtual Reality in Gaming Revenue (USD Million) By Region (2023-2030)
Table 51 Middle East and Africa Virtual Reality in Gaming Revenue (USD Million) By Type (2023-2030)
Table 52 Middle East and Africa Virtual Reality in Gaming Revenue (USD Million) By Applications (2023-2030)
Table 53 Research Programs/Design for This Report
Table 54 Key Data Information from Secondary Sources
Table 55 Key Data Information from Primary Sources
List of Figures
Figure 1 Market Scope
Figure 2 Porter’s Five Forces
Figure 3 Global Virtual Reality in Gaming Revenue (USD Million) By Type (2018-2022)
Figure 4 Global Virtual Reality in Gaming Revenue Market Share (%) By Type (2022)
Figure 5 Global Virtual Reality in Gaming Revenue (USD Million) By Applications (2018-2022)
Figure 6 Global Virtual Reality in Gaming Revenue Market Share (%) By Applications (2022)
Figure 7 Global Virtual Reality in Gaming Market Revenue (USD Million) By Regions (2018-2022)
Figure 8 Global Virtual Reality in Gaming Market Share (%) By Regions (2022)
Figure 9 North America Virtual Reality in Gaming Revenue (USD Million) By Country (2018-2022)
Figure 10 North America Virtual Reality in Gaming Revenue (USD Million) By Type (2018-2022)
Figure 11 North America Virtual Reality in Gaming Revenue (USD Million) By Applications (2018-2022)
Figure 12 Europe Virtual Reality in Gaming Revenue (USD Million) By Country (2018-2022)
Figure 13 Europe Virtual Reality in Gaming Revenue (USD Million) By Type (2018-2022)
Figure 14 Europe Virtual Reality in Gaming Revenue (USD Million) By Applications (2018-2022)
Figure 15 Asia Pacific Virtual Reality in Gaming Revenue (USD Million) By Country (2018-2022)
Figure 16 Asia Pacific Virtual Reality in Gaming Revenue (USD Million) By Type (2018-2022)
Figure 17 Asia Pacific Virtual Reality in Gaming Revenue (USD Million) By Applications (2018-2022)
Figure 18 South America Virtual Reality in Gaming Revenue (USD Million) By Country (2018-2022)
Figure 19 South America Virtual Reality in Gaming Revenue (USD Million) By Type (2018-2022)
Figure 20 South America Virtual Reality in Gaming Revenue (USD Million) By Applications (2018-2022)
Figure 21 Middle East and Africa Virtual Reality in Gaming Revenue (USD Million) By Region (2018-2022)
Figure 22 Middle East and Africa Virtual Reality in Gaming Revenue (USD Million) By Type (2018-2022)
Figure 23 Middle East and Africa Virtual Reality in Gaming Revenue (USD Million) By Applications (2018-2022)
Figure 24 Global Virtual Reality in Gaming Revenue (USD Million) By Type (2023-2030)
Figure 25 Global Virtual Reality in Gaming Revenue Market Share (%) By Type (2030)
Figure 26 Global Virtual Reality in Gaming Revenue (USD Million) By Applications (2023-2030)
Figure 27 Global Virtual Reality in Gaming Revenue Market Share (%) By Applications (2030)
Figure 28 Global Virtual Reality in Gaming Market Revenue (USD Million) By Regions (2023-2030)
Figure 29 North America Virtual Reality in Gaming Revenue (USD Million) By Country (2023-2030)
Figure 30 North America Virtual Reality in Gaming Revenue (USD Million) By Type (2023-2030)
Figure 31 North America Virtual Reality in Gaming Revenue (USD Million) By Applications (2023-2030)
Figure 32 Europe Virtual Reality in Gaming Revenue (USD Million) By Country (2023-2030)
Figure 33 Europe Virtual Reality in Gaming Revenue (USD Million) By Type (2023-2030)
Figure 34 Europe Virtual Reality in Gaming Revenue (USD Million) By Applications (2023-2030)
Figure 35 Asia Pacific Virtual Reality in Gaming Revenue (USD Million) By Country (2023-2030)
Figure 36 Asia Pacific Virtual Reality in Gaming Revenue (USD Million) By Type (2023-2030)
Figure 37 Asia Pacific Virtual Reality in Gaming Revenue (USD Million) By Applications (2023-2030)
Figure 38 South America Virtual Reality in Gaming Revenue (USD Million) By Country (2023-2030)
Figure 39 South America Virtual Reality in Gaming Revenue (USD Million) By Type (2023-2030)
Figure 40 South America Virtual Reality in Gaming Revenue (USD Million) By Applications (2023-2030)
Figure 41 Middle East and Africa Virtual Reality in Gaming Revenue (USD Million) By Region (2023-2030)
Figure 42 Middle East and Africa Virtual Reality in Gaming Revenue (USD Million) By Region (2023-2030)
Figure 43 Middle East and Africa Virtual Reality in Gaming Revenue (USD Million) By Type (2023-2030)
Figure 44 Middle East and Africa Virtual Reality in Gaming Revenue (USD Million) By Applications (2023-2030)
Figure 45 Bottom-Up and Top-Down Approaches for This Report
Figure 46 Data Triangulation
