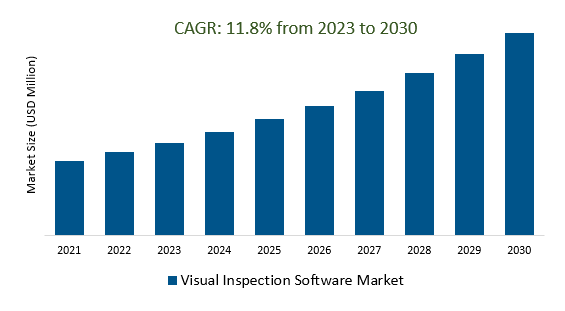
The Global Visual Inspection Software Market Size is estimated to register 11.8% growth over the forecast period from 2023 to 2030.
The market growth is driven by an increasing Industries such as automotive, electronics, and pharmaceuticals have increasingly stringent quality standards, necessitating more sophisticated visual inspection solutions. Leading Companies focusing on Artificial Intelligence and Machine Learning, Augmented Reality (AR) and Virtual Reality (VR), Enhanced 3D and Depth Sensing, Cloud-Based Solutions, Edge Computing, Sustainability and Green Manufacturing, Cybersecurity, Healthcare and Pharmaceutical Applications, and others to boost market shares in the industry.
Market Overview
The visual inspection software market, characterized by its steady growth and technological advancements, has been fueled by the increasing demand for quality control and automation across various industries. Key segments include component inspection, surface inspection, pattern recognition, and 3D inspection. Notable drivers and trends include the adoption of Industry 4.0, the integration of artificial intelligence and machine learning, globalization, IoT integration, and compliance with environmental and safety regulations. Visual inspection software plays a pivotal role in ensuring supply chain resilience and consistent quality control. For the latest insights, it is recommended to refer to current market reports and industry sources.
Market Dynamics
Market Trends- Visual inspection software is used in smart manufacturing to automate and improve the accuracy of quality control and inspection tasks
Visual inspection software is a critical component of smart manufacturing, where automation and precision are paramount. This technology plays a pivotal role in enhancing quality control and inspection processes by harnessing the power of artificial intelligence and machine learning. It enables the rapid detection of defects and anomalies in products and components, ensuring that they meet stringent quality standards. As Industry 4.0 and automation gain traction, this technology is pivotal for maintaining high standards in a competitive global market.
Market Driver- Advancements in camera technology are driving the demand for visual inspection software
Advancements in camera technology have become a driving force in the surging demand for visual inspection software. High-resolution cameras and faster image capture capabilities enable more detailed and precise inspections, crucial in industries like automotive, electronics, and healthcare, where quality control is paramount. These innovations empower the software to provide enhanced image analysis, ensuring that defects and anomalies are detected with greater accuracy and efficiency.
Market Opportunity- Visual inspection software is becoming more accurate and complete with the introduction of 3D and depth-sensing technologies
The integration of 3D and depth sensing technologies is significantly enhancing the accuracy and completeness of visual inspection software, particularly in industries like automotive and aerospace, where precise measurements and defect detection are crucial. This innovation allows for more comprehensive and detailed product analysis, ensuring compliance with stringent quality standards and optimizing manufacturing processes. As a result, the adoption of these technologies is making visual inspection software an indispensable tool for industries focused on achieving top-tier quality control and precision.
Market Share Analysis- AI Based Visual Inspection Software Market will register the fastest growth
The Global Visual Inspection Software Market is analyzed across AI-based, Others, and others. AI-Based is poised to register the fastest growth. The AI-based Visual Inspection Software Market has seen rapid growth, driven by the demand for precise and efficient quality control in industries like manufacturing, automotive, electronics, and pharmaceuticals. Leveraging artificial intelligence and machine learning, this software offers automation, precise defect detection, pattern recognition, customization, real-time analysis, and predictive maintenance. It is a critical component of Industry 4.0 initiatives, ensuring compliance with quality standards and supporting continuous improvement while expanding its global presence.
Market Share Analysis- Automotive held a significant market share in 2023
The Global Visual Inspection Software Market is analyzed across various applications including Automotive, Medical Devices, General Manufacturing, Consumer Electronics, and others. Of these, Automotive held a significant market share in 2023. The automotive industry plays a pivotal role in the Visual Inspection Software Market, with a high demand for precise quality control and efficiency. Visual inspection software is extensively applied in the inspection of automotive components and assemblies, ensuring the quality of engines, transmissions, safety systems, and assembly line processes. The adoption of AI-based solutions is growing, improving defect detection and product quality. Automotive manufacturers increasingly rely on advanced inspection software to meet stringent quality standards, and safety regulations, and optimize their production processes.
Visual Inspection Software Market Segmentation
By Type
By Application
- Automotive
- Medical Devices
- General Manufacturing
- Consumer Electronics
- Others
By Region
- North America (United States, Canada, Mexico)
- Europe (Germany, France, United Kingdom, Spain, Italy, Others)
- Asia Pacific (China, India, Japan, South Korea, Australia, Others)
- Latin America (Brazil, Argentina, Others)
- Middle East and Africa (Saudi Arabia, UAE, Kuwait, Other Middle East, South Africa, Nigeria, Other Africa)
Visual Inspection Software Market Companies
- ATS Global
- Radiant Vision Systems
- Rohde & Schwarz
- Cognex
- ScienceSoft
- Zoyen Intelligent
- Mettler Toledo
- Teledyne DALSA
- Neurala
- 3DUniversum
- Lumiform
- PEKAT Vision
- Craftworks GmbH
- FARO
*List not exhaustive
Visual Inspection Software Market Outlook 2023
1 Market Overview
1.1 Introduction to the Visual Inspection Software Market
1.2 Scope of the Study
1.3 Research Objective
1.3.1 Key Market Scope and Segments
1.3.2 Players Covered
1.3.3 Years Considered
2 Executive Summary
2.1 2023 Visual Inspection Software Industry- Market Statistics
3 Market Dynamics
3.1 Market Drivers
3.2 Market Challenges
3.3 Market Opportunities
3.4 Market Trends
4 Market Factor Analysis
4.1 Porter’s Five Forces
4.2 Market Entropy
4.2.1 Global Visual Inspection Software Market Companies with Area Served
4.2.2 Products Offerings Global Visual Inspection Software Market
5 COVID-19 Impact Analysis and Outlook Scenarios
5.1.1 Covid-19 Impact Analysis
5.1.2 post-COVID-19 Scenario- Low Growth Case
5.1.3 post-COVID-19 Scenario- Reference Growth Case
5.1.4 post-COVID-19 Scenario- Low Growth Case
6 Global Visual Inspection Software Market Trends
6.1 Global Visual Inspection Software Revenue (USD Million) and CAGR (%) by Type (2018-2030)
6.2 Global Visual Inspection Software Revenue (USD Million) and CAGR (%) by Applications (2018-2030)
6.3 Global Visual Inspection Software Revenue (USD Million) and CAGR (%) by regions (2018-2030)
7 Global Visual Inspection Software Market Revenue (USD Million) by Type, and Applications (2018-2022)
7.1 Global Visual Inspection Software Revenue (USD Million) by Type (2018-2022)
7.1.1 Global Visual Inspection Software Revenue (USD Million), Market Share (%) by Type (2018-2022)
7.2 Global Visual Inspection Software Revenue (USD Million) by Applications (2018-2022)
7.2.1 Global Visual Inspection Software Revenue (USD Million), Market Share (%) by Applications (2018-2022)
8 Global Visual Inspection Software Development Regional Status and Outlook
8.1 Global Visual Inspection Software Revenue (USD Million) By Regions (2018-2022)
8.2 North America Visual Inspection Software Revenue (USD Million) by Type, and Application (2018-2022)
8.2.1 North America Visual Inspection Software Revenue (USD Million) by Country (2018-2022)
8.2.2 North America Visual Inspection Software Revenue (USD Million) by Type (2018-2022)
8.2.3 North America Visual Inspection Software Revenue (USD Million) by Applications (2018-2022)
8.3 Europe Visual Inspection Software Revenue (USD Million), by Type, and Applications (USD Million) (2018-2022)
8.3.1 Europe Visual Inspection Software Revenue (USD Million), by Country (2018-2022)
8.3.2 Europe Visual Inspection Software Revenue (USD Million) by Type (2018-2022)
8.3.3 Europe Visual Inspection Software Revenue (USD Million) by Applications (2018-2022)
8.4 Asia Pacific Visual Inspection Software Revenue (USD Million), and Revenue (USD Million) by Type, and Applications (2018-2022)
8.4.1 Asia Pacific Visual Inspection Software Revenue (USD Million) by Country (2018-2022)
8.4.2 Asia Pacific Visual Inspection Software Revenue (USD Million) by Type (2018-2022)
8.4.3 Asia Pacific Visual Inspection Software Revenue (USD Million) by Applications (2018-2022)
8.5 South America Visual Inspection Software Revenue (USD Million), by Type, and Applications (2018-2022)
8.5.1 South America Visual Inspection Software Revenue (USD Million), by Country (2018-2022)
8.5.2 South America Visual Inspection Software Revenue (USD Million) by Type (2018-2022)
8.5.3 South America Visual Inspection Software Revenue (USD Million) by Applications (2018-2022)
8.6 Middle East and Africa Visual Inspection Software Revenue (USD Million), by Type, Technology, Application, Thickness (2018-2022)
8.6.1 Middle East and Africa Visual Inspection Software Revenue (USD Million) by Country (2018-2022)
8.6.2 Middle East and Africa Visual Inspection Software Revenue (USD Million) by Type (2018-2022)
8.6.3 Middle East and Africa Visual Inspection Software Revenue (USD Million) by Applications (2018-2022)
9 Company Profiles
10 Global Visual Inspection Software Market Revenue (USD Million), by Type, and Applications (2023-2030)
10.1 Global Visual Inspection Software Revenue (USD Million) and Market Share (%) by Type (2023-2030)
10.1.1 Global Visual Inspection Software Revenue (USD Million), and Market Share (%) by Type (2023-2030)
10.2 Global Visual Inspection Software Revenue (USD Million) and Market Share (%) by Applications (2023-2030)
10.2.1 Global Visual Inspection Software Revenue (USD Million), and Market Share (%) by Applications (2023-2030)
11 Global Visual Inspection Software Development Regional Status and Outlook Forecast
11.1 Global Visual Inspection Software Revenue (USD Million) By Regions (2023-2030)
11.2 North America Visual Inspection Software Revenue (USD Million) by Type, and Applications (2023-2030)
11.2.1 North America Visual Inspection Software Revenue (USD) Million by Country (2023-2030)
11.2.2 North America Visual Inspection Software Revenue (USD Million), by Type (2023-2030)
11.2.3 North America Visual Inspection Software Revenue (USD Million), Market Share (%) by Applications (2023-2030)
11.3 Europe Visual Inspection Software Revenue (USD Million), by Type, and Applications (2023-2030)
11.3.1 Europe Visual Inspection Software Revenue (USD Million), by Country (2023-2030)
11.3.2 Europe Visual Inspection Software Revenue (USD Million), by Type (2023-2030)
11.3.3 Europe Visual Inspection Software Revenue (USD Million), by Applications (2023-2030)
11.4 Asia Pacific Visual Inspection Software Revenue (USD Million) by Type, and Applications (2023-2030)
11.4.1 Asia Pacific Visual Inspection Software Revenue (USD Million), by Country (2023-2030)
11.4.2 Asia Pacific Visual Inspection Software Revenue (USD Million), by Type (2023-2030)
11.4.3 Asia Pacific Visual Inspection Software Revenue (USD Million), by Applications (2023-2030)
11.5 South America Visual Inspection Software Revenue (USD Million), by Type, and Applications (2023-2030)
11.5.1 South America Visual Inspection Software Revenue (USD Million), by Country (2023-2030)
11.5.2 South America Visual Inspection Software Revenue (USD Million), by Type (2023-2030)
11.5.3 South America Visual Inspection Software Revenue (USD Million), by Applications (2023-2030)
11.6 Middle East and Africa Visual Inspection Software Revenue (USD Million), by Type, and Applications (2023-2030)
11.6.1 Middle East and Africa Visual Inspection Software Revenue (USD Million), by region (2023-2030)
11.6.2 Middle East and Africa Visual Inspection Software Revenue (USD Million), by Type (2023-2030)
11.6.3 Middle East and Africa Visual Inspection Software Revenue (USD Million), by Applications (2023-2030)
12 Methodology and Data Sources
12.1 Methodology/Research Approach
12.1.1 Research Programs/Design
12.1.2 Market Size Estimation
12.1.3 Market Breakdown and Data Triangulation
12.2 Data Sources
12.2.1 Secondary Sources
12.2.2 Primary Sources
12.3 Disclaimer
List of Tables
Table 1 Market Segmentation Analysis
Table 2 Global Visual Inspection Software Market Companies with Areas Served
Table 3 Products Offerings Global Visual Inspection Software Market
Table 4 Low Growth Scenario Forecasts
Table 5 Reference Case Growth Scenario
Table 6 High Growth Case Scenario
Table 7 Global Visual Inspection Software Revenue (USD Million) And CAGR (%) By Type (2018-2030)
Table 8 Global Visual Inspection Software Revenue (USD Million) And CAGR (%) By Applications (2018-2030)
Table 9 Global Visual Inspection Software Revenue (USD Million) And CAGR (%) By Regions (2018-2030)
Table 10 Global Visual Inspection Software Revenue (USD Million) By Type (2018-2022)
Table 11 Global Visual Inspection Software Revenue Market Share (%) By Type (2018-2022)
Table 12 Global Visual Inspection Software Revenue (USD Million) By Applications (2018-2022)
Table 13 Global Visual Inspection Software Revenue Market Share (%) By Applications (2018-2022)
Table 14 Global Visual Inspection Software Market Revenue (USD Million) By Regions (2018-2022)
Table 15 Global Visual Inspection Software Market Share (%) By Regions (2018-2022)
Table 16 North America Visual Inspection Software Revenue (USD Million) By Country (2018-2022)
Table 17 North America Visual Inspection Software Revenue (USD Million) By Type (2018-2022)
Table 18 North America Visual Inspection Software Revenue (USD Million) By Applications (2018-2022)
Table 19 Europe Visual Inspection Software Revenue (USD Million) By Country (2018-2022)
Table 20 Europe Visual Inspection Software Revenue (USD Million) By Type (2018-2022)
Table 21 Europe Visual Inspection Software Revenue (USD Million) By Applications (2018-2022)
Table 22 Asia Pacific Visual Inspection Software Revenue (USD Million) By Country (2018-2022)
Table 23 Asia Pacific Visual Inspection Software Revenue (USD Million) By Type (2018-2022)
Table 24 Asia Pacific Visual Inspection Software Revenue (USD Million) By Applications (2018-2022)
Table 25 South America Visual Inspection Software Revenue (USD Million) By Country (2018-2022)
Table 26 South America Visual Inspection Software Revenue (USD Million) By Type (2018-2022)
Table 27 South America Visual Inspection Software Revenue (USD Million) By Applications (2018-2022)
Table 28 Middle East and Africa Visual Inspection Software Revenue (USD Million) By Region (2018-2022)
Table 29 Middle East and Africa Visual Inspection Software Revenue (USD Million) By Type (2018-2022)
Table 30 Middle East and Africa Visual Inspection Software Revenue (USD Million) By Applications (2018-2022)
Table 31 Financial Analysis
Table 32 Global Visual Inspection Software Revenue (USD Million) By Type (2023-2030)
Table 33 Global Visual Inspection Software Revenue Market Share (%) By Type (2023-2030)
Table 34 Global Visual Inspection Software Revenue (USD Million) By Applications (2023-2030)
Table 35 Global Visual Inspection Software Revenue Market Share (%) By Applications (2023-2030)
Table 36 Global Visual Inspection Software Market Revenue (USD Million), And Revenue (USD Million) By Regions (2023-2030)
Table 37 North America Visual Inspection Software Revenue (USD)By Country (2023-2030)
Table 38 North America Visual Inspection Software Revenue (USD Million) By Type (2023-2030)
Table 39 North America Visual Inspection Software Revenue (USD Million) By Applications (2023-2030)
Table 40 Europe Visual Inspection Software Revenue (USD Million) By Country (2023-2030)
Table 41 Europe Visual Inspection Software Revenue (USD Million) By Type (2023-2030)
Table 42 Europe Visual Inspection Software Revenue (USD Million) By Applications (2023-2030)
Table 43 Asia Pacific Visual Inspection Software Revenue (USD Million) By Country (2023-2030)
Table 44 Asia Pacific Visual Inspection Software Revenue (USD Million) By Type (2023-2030)
Table 45 Asia Pacific Visual Inspection Software Revenue (USD Million) By Applications (2023-2030)
Table 46 South America Visual Inspection Software Revenue (USD Million) By Country (2023-2030)
Table 47 South America Visual Inspection Software Revenue (USD Million) By Type (2023-2030)
Table 48 South America Visual Inspection Software Revenue (USD Million) By Applications (2023-2030)
Table 49 Middle East and Africa Visual Inspection Software Revenue (USD Million) By Region (2023-2030)
Table 50 Middle East and Africa Visual Inspection Software Revenue (USD Million) By Region (2023-2030)
Table 51 Middle East and Africa Visual Inspection Software Revenue (USD Million) By Type (2023-2030)
Table 52 Middle East and Africa Visual Inspection Software Revenue (USD Million) By Applications (2023-2030)
Table 53 Research Programs/Design for This Report
Table 54 Key Data Information from Secondary Sources
Table 55 Key Data Information from Primary Sources
List of Figures
Figure 1 Market Scope
Figure 2 Porter’s Five Forces
Figure 3 Global Visual Inspection Software Revenue (USD Million) By Type (2018-2022)
Figure 4 Global Visual Inspection Software Revenue Market Share (%) By Type (2022)
Figure 5 Global Visual Inspection Software Revenue (USD Million) By Applications (2018-2022)
Figure 6 Global Visual Inspection Software Revenue Market Share (%) By Applications (2022)
Figure 7 Global Visual Inspection Software Market Revenue (USD Million) By Regions (2018-2022)
Figure 8 Global Visual Inspection Software Market Share (%) By Regions (2022)
Figure 9 North America Visual Inspection Software Revenue (USD Million) By Country (2018-2022)
Figure 10 North America Visual Inspection Software Revenue (USD Million) By Type (2018-2022)
Figure 11 North America Visual Inspection Software Revenue (USD Million) By Applications (2018-2022)
Figure 12 Europe Visual Inspection Software Revenue (USD Million) By Country (2018-2022)
Figure 13 Europe Visual Inspection Software Revenue (USD Million) By Type (2018-2022)
Figure 14 Europe Visual Inspection Software Revenue (USD Million) By Applications (2018-2022)
Figure 15 Asia Pacific Visual Inspection Software Revenue (USD Million) By Country (2018-2022)
Figure 16 Asia Pacific Visual Inspection Software Revenue (USD Million) By Type (2018-2022)
Figure 17 Asia Pacific Visual Inspection Software Revenue (USD Million) By Applications (2018-2022)
Figure 18 South America Visual Inspection Software Revenue (USD Million) By Country (2018-2022)
Figure 19 South America Visual Inspection Software Revenue (USD Million) By Type (2018-2022)
Figure 20 South America Visual Inspection Software Revenue (USD Million) By Applications (2018-2022)
Figure 21 Middle East and Africa Visual Inspection Software Revenue (USD Million) By Region (2018-2022)
Figure 22 Middle East and Africa Visual Inspection Software Revenue (USD Million) By Type (2018-2022)
Figure 23 Middle East and Africa Visual Inspection Software Revenue (USD Million) By Applications (2018-2022)
Figure 24 Global Visual Inspection Software Revenue (USD Million) By Type (2023-2030)
Figure 25 Global Visual Inspection Software Revenue Market Share (%) By Type (2030)
Figure 26 Global Visual Inspection Software Revenue (USD Million) By Applications (2023-2030)
Figure 27 Global Visual Inspection Software Revenue Market Share (%) By Applications (2030)
Figure 28 Global Visual Inspection Software Market Revenue (USD Million) By Regions (2023-2030)
Figure 29 North America Visual Inspection Software Revenue (USD Million) By Country (2023-2030)
Figure 30 North America Visual Inspection Software Revenue (USD Million) By Type (2023-2030)
Figure 31 North America Visual Inspection Software Revenue (USD Million) By Applications (2023-2030)
Figure 32 Europe Visual Inspection Software Revenue (USD Million) By Country (2023-2030)
Figure 33 Europe Visual Inspection Software Revenue (USD Million) By Type (2023-2030)
Figure 34 Europe Visual Inspection Software Revenue (USD Million) By Applications (2023-2030)
Figure 35 Asia Pacific Visual Inspection Software Revenue (USD Million) By Country (2023-2030)
Figure 36 Asia Pacific Visual Inspection Software Revenue (USD Million) By Type (2023-2030)
Figure 37 Asia Pacific Visual Inspection Software Revenue (USD Million) By Applications (2023-2030)
Figure 38 South America Visual Inspection Software Revenue (USD Million) By Country (2023-2030)
Figure 39 South America Visual Inspection Software Revenue (USD Million) By Type (2023-2030)
Figure 40 South America Visual Inspection Software Revenue (USD Million) By Applications (2023-2030)
Figure 41 Middle East and Africa Visual Inspection Software Revenue (USD Million) By Region (2023-2030)
Figure 42 Middle East and Africa Visual Inspection Software Revenue (USD Million) By Region (2023-2030)
Figure 43 Middle East and Africa Visual Inspection Software Revenue (USD Million) By Type (2023-2030)
Figure 44 Middle East and Africa Visual Inspection Software Revenue (USD Million) By Applications (2023-2030)
Figure 45 Bottom-Up and Top-Down Approaches for This Report
Figure 46 Data Triangulation
