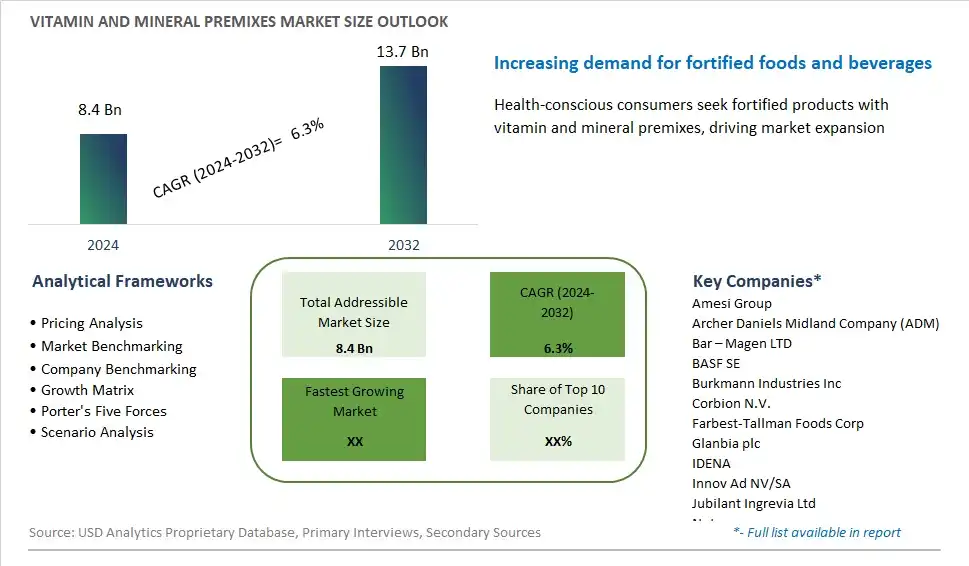
Global Vitamin and Mineral Premixes Market Size is valued at $8.4 Billion in 2024 and is forecast to register a growth rate (CAGR) of 6.3% to reach $13.7 Billion by 2032.
The global Vitamin and Mineral Premixes Market Comprehensive Study analyzes and forecasts the market size across 6 regions and 24 countries for diverse segments -By Type (Vitamin & Mineral Combination, Vitamin, Mineral), By Form (Dry, Liquid), By Application (Bakery Products, Dairy Products, Healthcare, Nutritional Products, Dietary Supplements, Feed, Personal Care Products, Others), By Functionality (Bone health, Skin health, Energy, Immunity, Digestion, Others)
An Introduction to Vitamin and Mineral Premixes Market
Vitamin and mineral premixes are customized blends of essential vitamins, minerals, and other nutritional additives used in food, beverage, and dietary supplement products to fortify or enrich their nutritional content in 2024. These premixes are carefully formulated to meet specific nutritional requirements and regulatory standards, ensuring accurate dosing and uniform distribution of vitamins and minerals in finished products. Vitamin and mineral premixes are commonly used in fortified foods such as breakfast cereals, dairy products, infant formula, and nutritional supplements, where they help to address nutrient deficiencies and support overall health and wellness. With increasing consumer awareness of nutrition and wellness, the market for vitamin and mineral premixes is expanding, driven by innovations in ingredient sourcing, formulation technology, and nutritional science that enable manufacturers to develop tailored solutions to meet diverse dietary needs and consumer preferences.
Vitamin and Mineral Premixes Competitive Landscape
The market report analyses the leading companies in the industry including Amesi Group, Archer Daniels Midland Company (ADM), Bar – Magen LTD, BASF SE, Burkmann Industries Inc, Corbion N.V., Farbest-Tallman Foods Corp, Glanbia plc, IDENA, Innov Ad NV/SA, Jubilant Ingrevia Ltd, Nutreco, Royal DSM N.V., SA Premix, Spansules Pharmatech Pvt. Ltd, SternVitamin GmbH & Co. KG, Vitablend Nederland BV, Wright Enrichment Inc, Zagro, and Others.
Vitamin and Mineral Premixes Market Dynamics
Vitamin and Mineral Premixes Market Trend: Growing Demand for Fortified Foods and Beverages
A prominent market trend for vitamin and mineral premixes is the growing demand for fortified foods and beverages. As consumers become increasingly health-conscious, there is a rising awareness of the importance of essential vitamins and minerals in maintaining overall health and well-being. This trend has fueled the demand for fortified products across various food and beverage categories, including dairy, bakery, breakfast cereals, beverages, and infant nutrition. Manufacturers are incorporating vitamin and mineral premixes into their formulations to enhance the nutritional profile of their products and meet the growing consumer demand for functional foods that offer added health benefits.
Market Driver: Increasing Focus on Nutritional Supplementation and Wellness
A key market driver for vitamin and mineral premixes is the increasing focus on nutritional supplementation and wellness. With growing concerns about nutrient deficiencies and lifestyle-related health issues, consumers are turning to dietary supplements and fortified foods to fill nutritional gaps and support their overall health and wellness goals. Vitamin and mineral premixes serve as convenient and cost-effective solutions for food and beverage manufacturers to fortify their products with essential nutrients, catering to the rising demand for functional and nutritionally enhanced offerings. This driver is propelled by consumers' desire for products that support immune health, energy levels, cognitive function, and other aspects of well-being.
Market Opportunity: Customized Formulations for Targeted Health Benefits
An opportunity within the market for vitamin and mineral premixes lies in the development of customized formulations for targeted health benefits. As consumer preferences for health and wellness become more personalized, there is a growing demand for tailored nutrition solutions that address specific health concerns and lifestyle needs. Manufacturers can capitalize on this opportunity by offering vitamin and mineral premixes customized to deliver targeted health benefits, such as immune support, bone health, heart health, and skin health. By collaborating with food and beverage brands to develop customized formulations, premix suppliers can differentiate their offerings, meet the diverse needs of consumers, and create value-added solutions that resonate with health-conscious consumers.
Vitamin and Mineral Premixes Market Share Analysis: Vitamin & Mineral Combination held the dominant market share in 2024
In the Vitamin and Mineral Premixes Market, the Vitamin & Mineral Combination segment is the largest category, driven by its comprehensive formulations and widespread applications across various industries. Vitamin and mineral combinations offer a convenient solution for manufacturers seeking to fortify their products with a broad spectrum of essential nutrients. These premixes are extensively used in the food and beverage, pharmaceutical, and dietary supplement industries to enhance the nutritional value of products such as fortified foods, beverages, vitamins, and dietary supplements. The synergistic effects of combining vitamins and minerals enable manufacturers to address multiple nutritional needs with a single ingredient, appealing to consumers seeking convenient and comprehensive supplementation. With the increasing demand for functional foods, personalized nutrition, and preventive healthcare, the Vitamin & Mineral Combination segment continues to dominate the market, presenting significant opportunities for premix manufacturers to innovate and meet evolving consumer needs.
Vitamin and Mineral Premixes Market Share Analysis: Liquid market is poised to register the fastest growth rae over the forecast period to 2032
Among the segments in the Vitamin and Mineral Premixes Market, the Liquid category is the fastest-growing segment, propelled by its advantages in formulation flexibility, ease of incorporation, and enhanced bioavailability. Liquid premixes offer manufacturers the ability to create customized blends of vitamins and minerals in precise concentrations, allowing for tailored formulations to meet specific product requirements. Additionally, liquid premixes facilitate homogenous distribution within final products, ensuring uniform fortification and consistent nutritional content. Further, the liquid form enables faster absorption and assimilation of nutrients by the body compared to dry formulations, appealing to consumers seeking quick and effective supplementation. With the growing demand for functional beverages, fortified juices, and liquid dietary supplements, the Liquid segment presents significant growth opportunities for premix manufacturers to innovate and cater to evolving consumer preferences for convenient and efficient nutrient delivery.
Vitamin and Mineral Premixes Market Share Analysis: Dietary Supplements held the dominant market share in 2024
Within the Vitamin and Mineral Premixes Market, the Dietary Supplements segment is the largest category, driven by the increasing consumer demand for health and wellness products and the growing prevalence of nutrient deficiencies. Dietary supplements fortified with vitamins and minerals offer a convenient and effective way for consumers to meet their daily nutritional needs and address specific health concerns. These supplements are available in various forms such as capsules, tablets, soft gels, and powders, catering to diverse consumer preferences and lifestyles. Further, the rising awareness of preventive healthcare and the importance of maintaining optimal nutrition further contribute to the popularity of dietary supplements fortified with premixes. With consumers prioritizing proactive approaches to health and wellness, the Dietary Supplements segment continues to dominate the market, presenting significant opportunities for premix manufacturers to innovate and expand their product offerings to meet evolving consumer demands for convenient and effective nutritional supplementation.
Vitamin and Mineral Premixes Market Segmentation
By Type
Vitamin & Mineral Combination
Vitamin
Mineral
By Form
Dry
Liquid
By Application
Bakery Products
Dairy Products
Healthcare
Nutritional Products
Dietary Supplements
Feed
Personal Care Products
Others
By Functionality
Bone health
Skin health
Energy
Immunity
Digestion
Others
Countries Analyzed
North America (US, Canada, Mexico)
Europe (Germany, UK, France, Spain, Italy, Russia, Rest of Europe)
Asia Pacific (China, India, Japan, South Korea, Australia, South East Asia, Rest of Asia)
South America (Brazil, Argentina, Rest of South America)
Middle East and Africa (Saudi Arabia, UAE, Rest of Middle East, South Africa, Egypt, Rest of Africa)
Vitamin and Mineral Premixes Companies Profiled in the Study
Amesi Group
Archer Daniels Midland Company (ADM)
Bar – Magen LTD
BASF SE
Burkmann Industries Inc
Corbion N.V.
Farbest-Tallman Foods Corp
Glanbia plc
IDENA
Innov Ad NV/SA
Jubilant Ingrevia Ltd
Nutreco
Royal DSM N.V.
SA Premix
Spansules Pharmatech Pvt. Ltd
SternVitamin GmbH & Co. KG
Vitablend Nederland BV
Wright Enrichment Inc
Zagro
*- List Not Exhaustive
Chapter 1. TABLE OF CONTENTS
Chapter 2. Introduction to Vitamin and Mineral Premixes Market
2.1. Market Overview
2.2. Key Statistics and Report Highlights
2.3. Scope of the Comprehensive Study
2.3.1. Market Definition
2.3.2 Countries and Regions Covered
2.3.3 Research Objective
2.3.4 Units, Currency, and Conversions
2.3.5 Industry Value Chain
2.4. Key Market Segments
2.5. Key Companies
2.6. Study Period
Chapter 3. Strategic Analysis Review
3.1. Vitamin and Mineral Premixes Pricing Analysis and Forecast
3.2. Porter’s Five Forces
3.3. Market Ecosystem
3.4. SWOT Analysis
3.5. Regulatory Scenario
3.3. Effects of Inflation, Russia-Ukraine War, moderating economic growth, and other macroeconomic factors
Chapter 4. Competitive Landscape
4.1. Market Share Analysis
4.1.1. Global Vitamin and Mineral Premixes Market Share by Company, 2023
4.1.2. Product Offerings of Leading Vitamin and Mineral Premixes Companies
4.2. Market Entropy
4.2.1. New Product Launches in the Industry
4.2.2. Mergers, Acquisitions, Joint ventures, and Partnerships
4.3. Key Strategies and Best Practices
Chapter 5. Global Market Projections: Best, Reference, and Low Case Scenarios
5.1. Growth Analysis- Case Scenario Definitions
5.2. Low Growth Case Scenario Forecasts
5.3. Reference Growth Case Scenario Forecasts
5.4. High Growth Case Scenario Forecasts
Chapter 6. Market Dynamics
6.1. Vitamin and Mineral Premixes Market Drivers
6.2. Vitamin and Mineral Premixes Market Challenges
6.6. Vitamin and Mineral Premixes Market Opportunities
6.4. Vitamin and Mineral Premixes Market Trends
Chapter 7. Global Vitamin and Mineral Premixes Market Outlook Trends
7.1. Global Vitamin and Mineral Premixes Revenue (USD Million) and CAGR (%) by Type (2021-2032)
7.2. Global Vitamin and Mineral Premixes Revenue (USD Million) and CAGR (%) by Application (2021-2032)
7.3. Global Vitamin and Mineral Premixes Revenue (USD Million) and CAGR (%) by Product (2021-2032)
By Type
Vitamin & Mineral Combination
Vitamin
Mineral
By Form
Dry
Liquid
By Application
Bakery Products
Dairy Products
Healthcare
Nutritional Products
Dietary Supplements
Feed
Personal Care Products
Others
By Functionality
Bone health
Skin health
Energy
Immunity
Digestion
Others
Chapter 8. Global Vitamin and Mineral Premixes Regional Analysis and Outlook
8.1. Global Vitamin and Mineral Premixes Revenue (USD Million) By Regions (2021- 2032)
8.2. North America Vitamin and Mineral Premixes Revenue (USD Million) by Country (2021-2032)
8.2.1. United States Vitamin and Mineral Premixes Regional Analysis and Outlook
8.2.2. Canada Vitamin and Mineral Premixes Regional Analysis and Outlook
8.2.3. Mexico Vitamin and Mineral Premixes Regional Analysis and Outlook
8.3. Europe Vitamin and Mineral Premixes Revenue (USD Million), by Country (2021-2032)
8.3.1. Germany Vitamin and Mineral Premixes Regional Analysis and Outlook
8.3.2. France Vitamin and Mineral Premixes Regional Analysis and Outlook
8.3.3. United Kingdom Vitamin and Mineral Premixes Regional Analysis and Outlook
8.3.4. Spain Vitamin and Mineral Premixes Regional Analysis and Outlook
8.3.5. Italy Vitamin and Mineral Premixes Regional Analysis and Outlook
8.3.6. Russia Vitamin and Mineral Premixes Regional Analysis and Outlook
8.3.7. Rest of Europe Vitamin and Mineral Premixes Regional Analysis and Outlook
8.4. Asia Pacific Vitamin and Mineral Premixes Revenue (USD Million) by Country (2021-2032)
8.4.1. China Vitamin and Mineral Premixes Regional Analysis and Outlook
8.4.2. Japan Vitamin and Mineral Premixes Regional Analysis and Outlook
8.4.3. India Vitamin and Mineral Premixes Regional Analysis and Outlook
8.4.4. South Korea Vitamin and Mineral Premixes Regional Analysis and Outlook
8.4.5. Australia Vitamin and Mineral Premixes Regional Analysis and Outlook
8.4.6. South East Asia Vitamin and Mineral Premixes Regional Analysis and Outlook
8.4.7. Rest of Asia Pacific Vitamin and Mineral Premixes Regional Analysis and Outlook
8.5. South America Vitamin and Mineral Premixes Revenue (USD Million), by Country (2021-2032)
8.5.1. Brazil Vitamin and Mineral Premixes Regional Analysis and Outlook
8.5.2. Argentina Vitamin and Mineral Premixes Regional Analysis and Outlook
8.5.3. Rest of South America Vitamin and Mineral Premixes Regional Analysis and Outlook
8.6. Middle East and Africa Vitamin and Mineral Premixes Revenue (USD Million) by Country (2021-2032)
8.6.1. Middle East Vitamin and Mineral Premixes Regional Analysis and Outlook
8.6.2. Africa Vitamin and Mineral Premixes Regional Analysis and Outlook
Chapter 9. North America Vitamin and Mineral Premixes Analysis and Outlook
9.1. North America Vitamin and Mineral Premixes Revenue (USD Million) by Segments (2021-2032)
9.1.1. North America Vitamin and Mineral Premixes Revenue (USD Million) by Type (2021-2032)
9.1.2. North America Vitamin and Mineral Premixes Revenue (USD Million) by Application (2021-2032)
9.1.3. North America Vitamin and Mineral Premixes Revenue (USD Million) by Product (2021-2032)
By Type
Vitamin & Mineral Combination
Vitamin
Mineral
By Form
Dry
Liquid
By Application
Bakery Products
Dairy Products
Healthcare
Nutritional Products
Dietary Supplements
Feed
Personal Care Products
Others
By Functionality
Bone health
Skin health
Energy
Immunity
Digestion
Others
Chapter 10. Europe Vitamin and Mineral Premixes Analysis and Outlook
10.1. Europe Vitamin and Mineral Premixes Revenue (USD Million), by Segments (USD Million) (2021-2032)
10.1.1. Europe Vitamin and Mineral Premixes Revenue (USD Million) by Type (2021-2032)
10.1.2. Europe Vitamin and Mineral Premixes Revenue (USD Million) by Application (2021-2032)
10.1.3. Europe Vitamin and Mineral Premixes Revenue (USD Million) by Product (2021-2032)
By Type
Vitamin & Mineral Combination
Vitamin
Mineral
By Form
Dry
Liquid
By Application
Bakery Products
Dairy Products
Healthcare
Nutritional Products
Dietary Supplements
Feed
Personal Care Products
Others
By Functionality
Bone health
Skin health
Energy
Immunity
Digestion
Others
Chapter 11. Asia Pacific Vitamin and Mineral Premixes Analysis and Outlook
11.1. Asia Pacific Vitamin and Mineral Premixes Revenue (USD Million), and Revenue (USD Million) by Segments (2021-2032)
11.1.1. Asia Pacific Vitamin and Mineral Premixes Revenue (USD Million) by Type (2021-2032)
11.1.2. Asia Pacific Vitamin and Mineral Premixes Revenue (USD Million) by Application (2021-2032)
11.1.3. Asia Pacific Vitamin and Mineral Premixes Revenue (USD Million) by Product (2021-2032)
By Type
Vitamin & Mineral Combination
Vitamin
Mineral
By Form
Dry
Liquid
By Application
Bakery Products
Dairy Products
Healthcare
Nutritional Products
Dietary Supplements
Feed
Personal Care Products
Others
By Functionality
Bone health
Skin health
Energy
Immunity
Digestion
Others
Chapter 12. South America Vitamin and Mineral Premixes Analysis and Outlook
12.1. South America Vitamin and Mineral Premixes Revenue (USD Million), by Segments (2021-2032)
12.1.1. South America Vitamin and Mineral Premixes Revenue (USD Million) by Type (2021-2032)
12.1.2. South America Vitamin and Mineral Premixes Revenue (USD Million) by Application (2021-2032)
12.1.3. South America Vitamin and Mineral Premixes Revenue (USD Million) by Product (2021-2032)
By Type
Vitamin & Mineral Combination
Vitamin
Mineral
By Form
Dry
Liquid
By Application
Bakery Products
Dairy Products
Healthcare
Nutritional Products
Dietary Supplements
Feed
Personal Care Products
Others
By Functionality
Bone health
Skin health
Energy
Immunity
Digestion
Others
Chapter 13. Middle East and Africa Vitamin and Mineral Premixes Analysis and Outlook
13.1. Middle East and Africa Vitamin and Mineral Premixes Revenue (USD Million), by Segments (2021-2032)
13.1.1. Middle East and Africa Vitamin and Mineral Premixes Revenue (USD Million) by Type (2021-2032)
13.1.2. Middle East and Africa Vitamin and Mineral Premixes Revenue (USD Million) by Application (2021-2032)
13.1.3. Middle East and Africa Vitamin and Mineral Premixes Revenue (USD Million) by Product (2021-2032)
By Type
Vitamin & Mineral Combination
Vitamin
Mineral
By Form
Dry
Liquid
By Application
Bakery Products
Dairy Products
Healthcare
Nutritional Products
Dietary Supplements
Feed
Personal Care Products
Others
By Functionality
Bone health
Skin health
Energy
Immunity
Digestion
Others
Chapter 14. Vitamin and Mineral Premixes Company Profiles
14.1 Business Overview
14.2 Product Profiles
14.3 SWOT Profiles
14.5 Recent Developments
14.6 Financial Profile
List of Companies
Amesi Group
Archer Daniels Midland Company (ADM)
Bar – Magen LTD
BASF SE
Burkmann Industries Inc
Corbion N.V.
Farbest-Tallman Foods Corp
Glanbia plc
IDENA
Innov Ad NV/SA
Jubilant Ingrevia Ltd
Nutreco
Royal DSM N.V.
SA Premix
Spansules Pharmatech Pvt. Ltd
SternVitamin GmbH & Co. KG
Vitablend Nederland BV
Wright Enrichment Inc
Zagro
15. Methodology and Data Sources
15.1 Customization Offerings
15.2 Subscription Services
15.3 Related Reports
15.4 Publisher Expertise
LIST OF TABLES
Table 1 Market Segmentation Analysis
Table 2 Global Vitamin and Mineral Premixes Market Share of Leading Companies, 2023
Table 3 Product Offerings of Leading Companies
Table 4 Low Growth Scenario Forecasts
Table 5 Reference Case Growth Scenario
Table 6 High Growth Case Scenario
Table 7 Global Vitamin and Mineral Premixes Revenue (USD Million) And CAGR (%) By Type (2021-2032)
Table 8 Global Vitamin and Mineral Premixes Revenue (USD Million) And CAGR (%) By Application (2021-2032)
Table 9 Global Vitamin and Mineral Premixes Revenue (USD Million) And CAGR (%) By Product (2021-2032)
Table 10 Global Vitamin and Mineral Premixes Market Revenue (USD Million) By Regions (2021-2032)
Table 11 Global Vitamin and Mineral Premixes Market Share (%) By Regions (2021-2032)
Table 12 North America Vitamin and Mineral Premixes Revenue (USD Million) By Country (2021-2032)
Table 13 Europe Vitamin and Mineral Premixes Revenue (USD Million) By Country (2021-2032)
Table 14 Asia Pacific Vitamin and Mineral Premixes Revenue (USD Million) By Country (2021-2032)
Table 15 South America Vitamin and Mineral Premixes Revenue (USD Million) By Country (2021-2032)
Table 16 Middle East and Africa Vitamin and Mineral Premixes Revenue (USD Million) By Region (2021-2032)
Table 17 North America Vitamin and Mineral Premixes Revenue (USD Million) By Type (2021-2032)
Table 18 North America Vitamin and Mineral Premixes Revenue (USD Million) By Application (2021-2032)
Table 19 North America Vitamin and Mineral Premixes Revenue (USD Million) By Product (2021-2032)
Table 20 Europe Vitamin and Mineral Premixes Revenue (USD Million) By Type (2021-2032)
Table 21 Europe Vitamin and Mineral Premixes Revenue (USD Million) By Application (2021-2032)
Table 22 Europe Vitamin and Mineral Premixes Revenue (USD Million) By Product (2021-2032)
Table 23 Asia Pacific Vitamin and Mineral Premixes Revenue (USD Million) By Type (2021-2032)
Table 24 Asia Pacific Vitamin and Mineral Premixes Revenue (USD Million) By Application (2021-2032)
Table 25 Asia Pacific Vitamin and Mineral Premixes Revenue (USD Million) By Product (2021-2032)
Table 26 South America Vitamin and Mineral Premixes Revenue (USD Million) By Type (2021-2032)
Table 27 South America Vitamin and Mineral Premixes Revenue (USD Million) By Application (2021-2032)
Table 28 South America Vitamin and Mineral Premixes Revenue (USD Million) By Product (2021-2032)
Table 29 Middle East and Africa Vitamin and Mineral Premixes Revenue (USD Million) By Type (2021-2032)
Table 30 Middle East and Africa Vitamin and Mineral Premixes Revenue (USD Million) By Application (2021-2032)
Table 31 Middle East and Africa Vitamin and Mineral Premixes Revenue (USD Million) By Product (2021-2032)
LIST OF FIGURES
Figure 1. Market Scope
Figure 2. Pricing Forecasts Per Unit, 2023- 2032
Figure 3. Porter’s Five Forces
Figure 4. Global Vitamin and Mineral Premixes Market Revenue (USD Million) By Regions (2021-2032)
Figure 5. Global Vitamin and Mineral Premixes Market Share (%) By Regions (2023)
Figure 6. North America Vitamin and Mineral Premixes Revenue (USD Million) By Country (2021-2032)
Figure 7. United States Vitamin and Mineral Premixes Revenue (USD Million) By Country (2021-2032)
Figure 8. Canada Vitamin and Mineral Premixes Revenue (USD Million) By Country (2021-2032)
Figure 9. Mexico Vitamin and Mineral Premixes Revenue (USD Million) By Country (2021-2032)
Figure 10. Europe Vitamin and Mineral Premixes Revenue (USD Million) By Country (2021-2032)
Figure 11. Germany Vitamin and Mineral Premixes Revenue (USD Million) By Country (2021-2032)
Figure 12. France Vitamin and Mineral Premixes Revenue (USD Million) By Country (2021-2032)
Figure 13. United Kingdom Vitamin and Mineral Premixes Revenue (USD Million) By Country (2021-2032)
Figure 14. Spain Vitamin and Mineral Premixes Revenue (USD Million) By Country (2021-2032)
Figure 15. Italy Vitamin and Mineral Premixes Revenue (USD Million) By Country (2021-2032)
Figure 16. Russia Vitamin and Mineral Premixes Revenue (USD Million) By Country (2021-2032)
Figure 17. Rest of Europe Vitamin and Mineral Premixes Revenue (USD Million) By Country (2021-2032)
Figure 11. Asia Pacific Vitamin and Mineral Premixes Revenue (USD Million) By Country (2021-2032)
Figure 12. China Vitamin and Mineral Premixes Revenue (USD Million) By Country (2021-2032)
Figure 13. Japan Vitamin and Mineral Premixes Revenue (USD Million) By Country (2021-2032)
Figure 14. India Vitamin and Mineral Premixes Revenue (USD Million) By Country (2021-2032)
Figure 15. South Korea Vitamin and Mineral Premixes Revenue (USD Million) By Country (2021-2032)
Figure 16. Australia Vitamin and Mineral Premixes Revenue (USD Million) By Country (2021-2032)
Figure 17. South East Asia Vitamin and Mineral Premixes Revenue (USD Million) By Country (2021-2032)
Figure 18. South America Vitamin and Mineral Premixes Revenue (USD Million) By Country (2021-2032)
Figure 19. Brazil Vitamin and Mineral Premixes Revenue (USD Million) By Country (2021-2032)
Figure 20. Argentina Vitamin and Mineral Premixes Revenue (USD Million) By Country (2021-2032)
Figure 21. Rest of Asia Pacific Vitamin and Mineral Premixes Revenue (USD Million) By Country (2021-2032)
Figure 22. Middle East and Africa Vitamin and Mineral Premixes Revenue (USD Million) By Region (2021-2032)
Figure 23. Saudi Arabia Vitamin and Mineral Premixes Revenue (USD Million) By Region (2021-2032)
Figure 24. The UAE Vitamin and Mineral Premixes Revenue (USD Million) By Region (2021-2032)
Figure 25. Rest of Middle East Vitamin and Mineral Premixes Revenue (USD Million) By Region (2021-2032)
Figure 26. South Africa Vitamin and Mineral Premixes Revenue (USD Million) By Region (2021-2032)
Figure 27. Africa Vitamin and Mineral Premixes Revenue (USD Million) By Region (2021-2032)
Figure 28. North America Vitamin and Mineral Premixes Revenue (USD Million) By Type (2021-2032)
Figure 29. North America Vitamin and Mineral Premixes Revenue (USD Million) By Application (2021-2032)
Figure 30. North America Vitamin and Mineral Premixes Revenue (USD Million) By Product (2021-2032)
Figure 31. Europe Vitamin and Mineral Premixes Revenue (USD Million) By Type (2021-2032)
Figure 32. Europe Vitamin and Mineral Premixes Revenue (USD Million) By Application (2021-2032)
Figure 33. Europe Vitamin and Mineral Premixes Revenue (USD Million) By Product (2021-2032)
Figure 34. Asia Pacific Vitamin and Mineral Premixes Revenue (USD Million) By Type (2021-2032)
Figure 35. Asia Pacific Vitamin and Mineral Premixes Revenue (USD Million) By Application (2021-2032)
Figure 36. Asia Pacific Vitamin and Mineral Premixes Revenue (USD Million) By Product (2021-2032)
Figure 37. South America Vitamin and Mineral Premixes Revenue (USD Million) By Type (2021-2032)
Figure 38. South America Vitamin and Mineral Premixes Revenue (USD Million) By Application (2021-2032)
Figure 39. South America Vitamin and Mineral Premixes Revenue (USD Million) By Product (2021-2032)
Figure 40. Middle East and Africa Vitamin and Mineral Premixes Revenue (USD Million) By Type (2021-2032)
Figure 41. Middle East and Africa Vitamin and Mineral Premixes Revenue (USD Million) By Application (2021-2032)
Figure 42. Middle East and Africa Vitamin and Mineral Premixes Revenue (USD Million) By Product (2021-2032)
By Type
Vitamin & Mineral Combination
Vitamin
Mineral
By Form
Dry
Liquid
By Application
Bakery Products
Dairy Products
Healthcare
Nutritional Products
Dietary Supplements
Feed
Personal Care Products
Others
By Functionality
Bone health
Skin health
Energy
Immunity
Digestion
Others
Countries Analyzed
North America (US, Canada, Mexico)
Europe (Germany, UK, France, Spain, Italy, Russia, Rest of Europe)
Asia Pacific (China, India, Japan, South Korea, Australia, South East Asia, Rest of Asia)
South America (Brazil, Argentina, Rest of South America)
Middle East and Africa (Saudi Arabia, UAE, Rest of Middle East, South Africa, Egypt, Rest of Africa)
