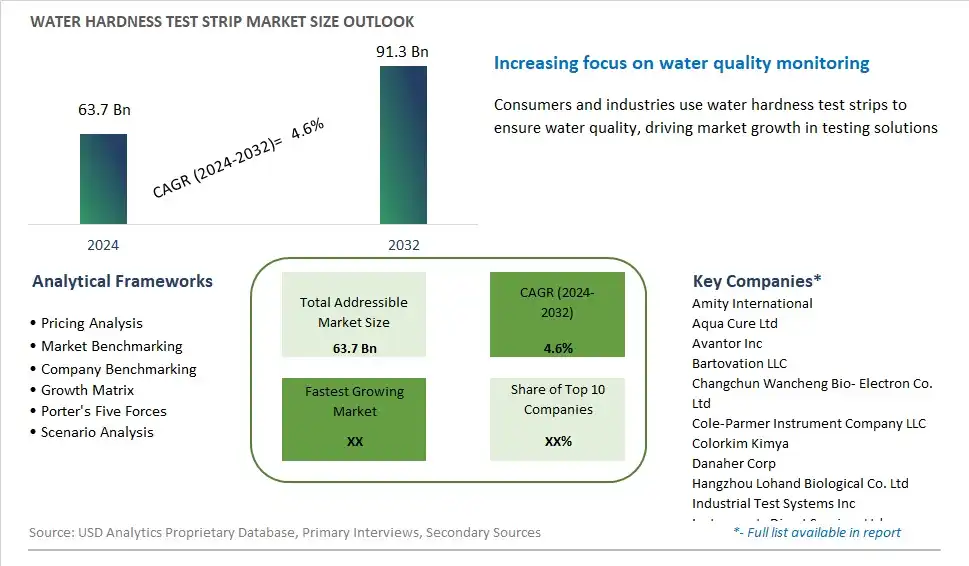
Global Water Hardness Test Strip Market Size is valued at $63.7 Billion in 2024 and is forecast to register a growth rate (CAGR) of 4.6% to reach $91.3 Billion by 2032.
The global Water Hardness Test Strip Market Comprehensive Study analyzes and forecasts the market size across 6 regions and 24 countries for diverse segments -By Type (Calcium Concentration Measurement, Magnesium Concentration Measurement.), By Application (Industrial, Laboratory, Others), By sales channel (Retail, Non-retail)
An Introduction to Water Hardness Test Strip Market
Water hardness test strips are simple, convenient tools used to measure the mineral content, specifically calcium and magnesium ions, in water sources in 2024. These test strips typically contain reagents that react with calcium and magnesium ions, producing color changes that can be compared to a color chart to determine the water hardness level. Water hardness test strips are widely used in households, laboratories, and industrial settings to assess water quality, prevent scale buildup in plumbing systems, and optimize detergent usage in laundry and dishwashing. With increasing concerns about water quality, scale formation, and appliance maintenance, the market for water hardness test strips is expanding, driven by innovations in test strip design, sensitivity, and accuracy that provide users with reliable and cost-effective solutions for monitoring and managing water hardness levels in various applications.
Water Hardness Test Strip Competitive Landscape
The market report analyses the leading companies in the industry including Amity International, Aqua Cure Ltd, Avantor Inc, Bartovation LLC, Changchun Wancheng Bio- Electron Co. Ltd, Cole-Parmer Instrument Company LLC, Colorkim Kimya, Danaher Corp, Hangzhou Lohand Biological Co. Ltd, Industrial Test Systems Inc, Instruments Direct Services Ltd, Isolab Laborgerate GmbH, Johnson Test Paper Ltd, LaMotte Company, Merck KGaA, Serim Research Corp, Simplex Health, Spectris, Thermo Fischer Scientific Inc, US Water Systems Inc, and Others.
Water Hardness Test Strip Market Dynamics
Water Hardness Test Strip Market Trend: Increasing Awareness of Water Quality
A prominent market trend for water hardness test strips is the increasing awareness of water quality among consumers and businesses. With growing concerns about water contamination, pollutants, and mineral content, there is a heightened interest in understanding the hardness levels of drinking water and other water sources. This trend is driving individuals, households, and businesses to seek convenient and affordable methods to assess water hardness accurately. As a result, the demand for water hardness test strips is on the rise, reflecting the broader trend of proactive water quality management.
Market Driver: Regulatory Compliance and Water Treatment Standards
A key market driver for water hardness test strips is regulatory compliance and adherence to water treatment standards. Government regulations and industry standards mandate the monitoring and maintenance of water quality in various sectors, including residential, commercial, industrial, and healthcare. Water hardness, which refers to the concentration of minerals like calcium and magnesium in water, can affect the performance of water treatment systems, equipment, and appliances. Therefore, businesses and organizations must regularly test water hardness levels to ensure compliance with regulatory requirements and optimize water treatment processes. This necessity drives the demand for accurate and reliable water hardness test strips as essential tools for water quality management and compliance.
Market Opportunity: Expansion of Consumer and Industrial Applications
An opportunity within the market for water hardness test strips lies in the expansion of consumer and industrial applications. Beyond traditional uses in residential settings, such as testing household tap water, there is a growing demand for water hardness testing in various industries, including agriculture, food and beverage production, healthcare facilities, and laboratories. Additionally, businesses involved in water treatment, filtration, and purification systems require precise water hardness measurements to design and optimize their products and services. By catering to a diverse range of applications and industries, manufacturers of water hardness test strips can capitalize on the expanding market demand and establish themselves as trusted suppliers of reliable water quality testing solutions.
Water Hardness Test Strip Market Share Analysis: Calcium Concentration Measurement held the dominant market share in 2024
In the Water Hardness Test Strip Market, the Calcium Concentration Measurement segment is the largest category, primarily driven by the prevalence of calcium as a predominant mineral contributing to water hardness. Calcium ions are a common component of water hardness, originating from dissolved calcium carbonate and calcium sulfate minerals in groundwater sources. As calcium concentration serves as a key indicator of water hardness levels, test strips designed specifically for calcium measurement are widely used by consumers, businesses, and industries to assess water quality and determine appropriate water treatment measures. Additionally, calcium concentration measurements are essential for various applications, including household water softening systems, industrial processes, and agricultural irrigation systems. With the growing importance of water quality management and the need to mitigate issues associated with hard water, the Calcium Concentration Measurement segment continues to dominate the Water Hardness Test Strip Market, presenting significant opportunities for manufacturers to meet the demand for accurate and reliable water testing solutions.
Water Hardness Test Strip Market Share Analysis: Industrial market is poised to register the fastest growth rae over the forecast period to 2032
Among the segments in the Water Hardness Test Strip Market, the Industrial category is the fastest-growing segment, driven by increasing demand for water quality monitoring and treatment solutions in industrial processes. Industries rely on accurate water hardness testing to ensure optimal performance of equipment, prevent scale buildup, and maintain product quality. Water hardness can adversely affect industrial operations by causing scaling in boilers, cooling towers, and machinery, leading to decreased efficiency and increased maintenance costs. Consequently, industries such as manufacturing, power generation, and food processing are increasingly investing in water hardness test strips for regular monitoring and effective water treatment measures. With stringent regulations governing water quality standards and the emphasis on sustainable practices, the Industrial segment presents significant growth opportunities for manufacturers to innovate and provide specialized test strip solutions tailored to the needs of industrial applications, driving the rapid expansion of the Water Hardness Test Strip Market in this segment.
Water Hardness Test Strip Market Share Analysis: Retail held the dominant market share in 2024
In the Water Hardness Test Strip Market, the Retail segment is the largest category, primarily driven by the accessibility and convenience of retail sales channels for consumers seeking water testing solutions. Retail outlets such as supermarkets, hardware stores, and online platforms offer a wide range of water hardness test strips to cater to residential customers, businesses, and small-scale users. These retail channels provide easy access to test strips, enabling consumers to quickly assess water quality in their homes, offices, or recreational facilities. Additionally, retail packaging often includes user-friendly instructions and educational materials, empowering consumers to make informed decisions about water treatment options. With growing awareness of water quality issues and the increasing trend towards DIY water testing, the Retail segment continues to dominate the market, presenting significant opportunities for retailers and manufacturers to expand their product offerings and reach a broader customer base.
Water Hardness Test Strip Market Segmentation
By Type
Calcium Concentration Measurement
Magnesium Concentration Measurement.
By Application
Industrial
Laboratory
Others
By sales channel
Retail
Non-retail
Countries Analyzed
North America (US, Canada, Mexico)
Europe (Germany, UK, France, Spain, Italy, Russia, Rest of Europe)
Asia Pacific (China, India, Japan, South Korea, Australia, South East Asia, Rest of Asia)
South America (Brazil, Argentina, Rest of South America)
Middle East and Africa (Saudi Arabia, UAE, Rest of Middle East, South Africa, Egypt, Rest of Africa)
Water Hardness Test Strip Companies Profiled in the Study
Amity International
Aqua Cure Ltd
Avantor Inc
Bartovation LLC
Changchun Wancheng Bio- Electron Co. Ltd
Cole-Parmer Instrument Company LLC
Colorkim Kimya
Danaher Corp
Hangzhou Lohand Biological Co. Ltd
Industrial Test Systems Inc
Instruments Direct Services Ltd
Isolab Laborgerate GmbH
Johnson Test Paper Ltd
LaMotte Company
Merck KGaA
Serim Research Corp
Simplex Health
Spectris
Thermo Fischer Scientific Inc
US Water Systems Inc
*- List Not Exhaustive
Chapter 1. TABLE OF CONTENTS
Chapter 2. Introduction to Water Hardness Test Strip Market
2.1. Market Overview
2.2. Key Statistics and Report Highlights
2.3. Scope of the Comprehensive Study
2.3.1. Market Definition
2.3.2 Countries and Regions Covered
2.3.3 Research Objective
2.3.4 Units, Currency, and Conversions
2.3.5 Industry Value Chain
2.4. Key Market Segments
2.5. Key Companies
2.6. Study Period
Chapter 3. Strategic Analysis Review
3.1. Water Hardness Test Strip Pricing Analysis and Forecast
3.2. Porter’s Five Forces
3.3. Market Ecosystem
3.4. SWOT Analysis
3.5. Regulatory Scenario
3.3. Effects of Inflation, Russia-Ukraine War, moderating economic growth, and other macroeconomic factors
Chapter 4. Competitive Landscape
4.1. Market Share Analysis
4.1.1. Global Water Hardness Test Strip Market Share by Company, 2023
4.1.2. Product Offerings of Leading Water Hardness Test Strip Companies
4.2. Market Entropy
4.2.1. New Product Launches in the Industry
4.2.2. Mergers, Acquisitions, Joint ventures, and Partnerships
4.3. Key Strategies and Best Practices
Chapter 5. Global Market Projections: Best, Reference, and Low Case Scenarios
5.1. Growth Analysis- Case Scenario Definitions
5.2. Low Growth Case Scenario Forecasts
5.3. Reference Growth Case Scenario Forecasts
5.4. High Growth Case Scenario Forecasts
Chapter 6. Market Dynamics
6.1. Water Hardness Test Strip Market Drivers
6.2. Water Hardness Test Strip Market Challenges
6.6. Water Hardness Test Strip Market Opportunities
6.4. Water Hardness Test Strip Market Trends
Chapter 7. Global Water Hardness Test Strip Market Outlook Trends
7.1. Global Water Hardness Test Strip Revenue (USD Million) and CAGR (%) by Type (2021-2032)
7.2. Global Water Hardness Test Strip Revenue (USD Million) and CAGR (%) by Application (2021-2032)
7.3. Global Water Hardness Test Strip Revenue (USD Million) and CAGR (%) by Product (2021-2032)
By Type
Calcium Concentration Measurement
Magnesium Concentration Measurement.
By Application
Industrial
Laboratory
Others
By sales channel
Retail
Non-retail
Chapter 8. Global Water Hardness Test Strip Regional Analysis and Outlook
8.1. Global Water Hardness Test Strip Revenue (USD Million) By Regions (2021- 2032)
8.2. North America Water Hardness Test Strip Revenue (USD Million) by Country (2021-2032)
8.2.1. United States Water Hardness Test Strip Regional Analysis and Outlook
8.2.2. Canada Water Hardness Test Strip Regional Analysis and Outlook
8.2.3. Mexico Water Hardness Test Strip Regional Analysis and Outlook
8.3. Europe Water Hardness Test Strip Revenue (USD Million), by Country (2021-2032)
8.3.1. Germany Water Hardness Test Strip Regional Analysis and Outlook
8.3.2. France Water Hardness Test Strip Regional Analysis and Outlook
8.3.3. United Kingdom Water Hardness Test Strip Regional Analysis and Outlook
8.3.4. Spain Water Hardness Test Strip Regional Analysis and Outlook
8.3.5. Italy Water Hardness Test Strip Regional Analysis and Outlook
8.3.6. Russia Water Hardness Test Strip Regional Analysis and Outlook
8.3.7. Rest of Europe Water Hardness Test Strip Regional Analysis and Outlook
8.4. Asia Pacific Water Hardness Test Strip Revenue (USD Million) by Country (2021-2032)
8.4.1. China Water Hardness Test Strip Regional Analysis and Outlook
8.4.2. Japan Water Hardness Test Strip Regional Analysis and Outlook
8.4.3. India Water Hardness Test Strip Regional Analysis and Outlook
8.4.4. South Korea Water Hardness Test Strip Regional Analysis and Outlook
8.4.5. Australia Water Hardness Test Strip Regional Analysis and Outlook
8.4.6. South East Asia Water Hardness Test Strip Regional Analysis and Outlook
8.4.7. Rest of Asia Pacific Water Hardness Test Strip Regional Analysis and Outlook
8.5. South America Water Hardness Test Strip Revenue (USD Million), by Country (2021-2032)
8.5.1. Brazil Water Hardness Test Strip Regional Analysis and Outlook
8.5.2. Argentina Water Hardness Test Strip Regional Analysis and Outlook
8.5.3. Rest of South America Water Hardness Test Strip Regional Analysis and Outlook
8.6. Middle East and Africa Water Hardness Test Strip Revenue (USD Million) by Country (2021-2032)
8.6.1. Middle East Water Hardness Test Strip Regional Analysis and Outlook
8.6.2. Africa Water Hardness Test Strip Regional Analysis and Outlook
Chapter 9. North America Water Hardness Test Strip Analysis and Outlook
9.1. North America Water Hardness Test Strip Revenue (USD Million) by Segments (2021-2032)
9.1.1. North America Water Hardness Test Strip Revenue (USD Million) by Type (2021-2032)
9.1.2. North America Water Hardness Test Strip Revenue (USD Million) by Application (2021-2032)
9.1.3. North America Water Hardness Test Strip Revenue (USD Million) by Product (2021-2032)
By Type
Calcium Concentration Measurement
Magnesium Concentration Measurement.
By Application
Industrial
Laboratory
Others
By sales channel
Retail
Non-retail
Chapter 10. Europe Water Hardness Test Strip Analysis and Outlook
10.1. Europe Water Hardness Test Strip Revenue (USD Million), by Segments (USD Million) (2021-2032)
10.1.1. Europe Water Hardness Test Strip Revenue (USD Million) by Type (2021-2032)
10.1.2. Europe Water Hardness Test Strip Revenue (USD Million) by Application (2021-2032)
10.1.3. Europe Water Hardness Test Strip Revenue (USD Million) by Product (2021-2032)
By Type
Calcium Concentration Measurement
Magnesium Concentration Measurement.
By Application
Industrial
Laboratory
Others
By sales channel
Retail
Non-retail
Chapter 11. Asia Pacific Water Hardness Test Strip Analysis and Outlook
11.1. Asia Pacific Water Hardness Test Strip Revenue (USD Million), and Revenue (USD Million) by Segments (2021-2032)
11.1.1. Asia Pacific Water Hardness Test Strip Revenue (USD Million) by Type (2021-2032)
11.1.2. Asia Pacific Water Hardness Test Strip Revenue (USD Million) by Application (2021-2032)
11.1.3. Asia Pacific Water Hardness Test Strip Revenue (USD Million) by Product (2021-2032)
By Type
Calcium Concentration Measurement
Magnesium Concentration Measurement.
By Application
Industrial
Laboratory
Others
By sales channel
Retail
Non-retail
Chapter 12. South America Water Hardness Test Strip Analysis and Outlook
12.1. South America Water Hardness Test Strip Revenue (USD Million), by Segments (2021-2032)
12.1.1. South America Water Hardness Test Strip Revenue (USD Million) by Type (2021-2032)
12.1.2. South America Water Hardness Test Strip Revenue (USD Million) by Application (2021-2032)
12.1.3. South America Water Hardness Test Strip Revenue (USD Million) by Product (2021-2032)
By Type
Calcium Concentration Measurement
Magnesium Concentration Measurement.
By Application
Industrial
Laboratory
Others
By sales channel
Retail
Non-retail
Chapter 13. Middle East and Africa Water Hardness Test Strip Analysis and Outlook
13.1. Middle East and Africa Water Hardness Test Strip Revenue (USD Million), by Segments (2021-2032)
13.1.1. Middle East and Africa Water Hardness Test Strip Revenue (USD Million) by Type (2021-2032)
13.1.2. Middle East and Africa Water Hardness Test Strip Revenue (USD Million) by Application (2021-2032)
13.1.3. Middle East and Africa Water Hardness Test Strip Revenue (USD Million) by Product (2021-2032)
By Type
Calcium Concentration Measurement
Magnesium Concentration Measurement.
By Application
Industrial
Laboratory
Others
By sales channel
Retail
Non-retail
Chapter 14. Water Hardness Test Strip Company Profiles
14.1 Business Overview
14.2 Product Profiles
14.3 SWOT Profiles
14.5 Recent Developments
14.6 Financial Profile
List of Companies
Amity International
Aqua Cure Ltd
Avantor Inc
Bartovation LLC
Changchun Wancheng Bio- Electron Co. Ltd
Cole-Parmer Instrument Company LLC
Colorkim Kimya
Danaher Corp
Hangzhou Lohand Biological Co. Ltd
Industrial Test Systems Inc
Instruments Direct Services Ltd
Isolab Laborgerate GmbH
Johnson Test Paper Ltd
LaMotte Company
Merck KGaA
Serim Research Corp
Simplex Health
Spectris
Thermo Fischer Scientific Inc
US Water Systems Inc
15. Methodology and Data Sources
15.1 Customization Offerings
15.2 Subscription Services
15.3 Related Reports
15.4 Publisher Expertise
LIST OF TABLES
Table 1 Market Segmentation Analysis
Table 2 Global Water Hardness Test Strip Market Share of Leading Companies, 2023
Table 3 Product Offerings of Leading Companies
Table 4 Low Growth Scenario Forecasts
Table 5 Reference Case Growth Scenario
Table 6 High Growth Case Scenario
Table 7 Global Water Hardness Test Strip Revenue (USD Million) And CAGR (%) By Type (2021-2032)
Table 8 Global Water Hardness Test Strip Revenue (USD Million) And CAGR (%) By Application (2021-2032)
Table 9 Global Water Hardness Test Strip Revenue (USD Million) And CAGR (%) By Product (2021-2032)
Table 10 Global Water Hardness Test Strip Market Revenue (USD Million) By Regions (2021-2032)
Table 11 Global Water Hardness Test Strip Market Share (%) By Regions (2021-2032)
Table 12 North America Water Hardness Test Strip Revenue (USD Million) By Country (2021-2032)
Table 13 Europe Water Hardness Test Strip Revenue (USD Million) By Country (2021-2032)
Table 14 Asia Pacific Water Hardness Test Strip Revenue (USD Million) By Country (2021-2032)
Table 15 South America Water Hardness Test Strip Revenue (USD Million) By Country (2021-2032)
Table 16 Middle East and Africa Water Hardness Test Strip Revenue (USD Million) By Region (2021-2032)
Table 17 North America Water Hardness Test Strip Revenue (USD Million) By Type (2021-2032)
Table 18 North America Water Hardness Test Strip Revenue (USD Million) By Application (2021-2032)
Table 19 North America Water Hardness Test Strip Revenue (USD Million) By Product (2021-2032)
Table 20 Europe Water Hardness Test Strip Revenue (USD Million) By Type (2021-2032)
Table 21 Europe Water Hardness Test Strip Revenue (USD Million) By Application (2021-2032)
Table 22 Europe Water Hardness Test Strip Revenue (USD Million) By Product (2021-2032)
Table 23 Asia Pacific Water Hardness Test Strip Revenue (USD Million) By Type (2021-2032)
Table 24 Asia Pacific Water Hardness Test Strip Revenue (USD Million) By Application (2021-2032)
Table 25 Asia Pacific Water Hardness Test Strip Revenue (USD Million) By Product (2021-2032)
Table 26 South America Water Hardness Test Strip Revenue (USD Million) By Type (2021-2032)
Table 27 South America Water Hardness Test Strip Revenue (USD Million) By Application (2021-2032)
Table 28 South America Water Hardness Test Strip Revenue (USD Million) By Product (2021-2032)
Table 29 Middle East and Africa Water Hardness Test Strip Revenue (USD Million) By Type (2021-2032)
Table 30 Middle East and Africa Water Hardness Test Strip Revenue (USD Million) By Application (2021-2032)
Table 31 Middle East and Africa Water Hardness Test Strip Revenue (USD Million) By Product (2021-2032)
LIST OF FIGURES
Figure 1. Market Scope
Figure 2. Pricing Forecasts Per Unit, 2023- 2032
Figure 3. Porter’s Five Forces
Figure 4. Global Water Hardness Test Strip Market Revenue (USD Million) By Regions (2021-2032)
Figure 5. Global Water Hardness Test Strip Market Share (%) By Regions (2023)
Figure 6. North America Water Hardness Test Strip Revenue (USD Million) By Country (2021-2032)
Figure 7. United States Water Hardness Test Strip Revenue (USD Million) By Country (2021-2032)
Figure 8. Canada Water Hardness Test Strip Revenue (USD Million) By Country (2021-2032)
Figure 9. Mexico Water Hardness Test Strip Revenue (USD Million) By Country (2021-2032)
Figure 10. Europe Water Hardness Test Strip Revenue (USD Million) By Country (2021-2032)
Figure 11. Germany Water Hardness Test Strip Revenue (USD Million) By Country (2021-2032)
Figure 12. France Water Hardness Test Strip Revenue (USD Million) By Country (2021-2032)
Figure 13. United Kingdom Water Hardness Test Strip Revenue (USD Million) By Country (2021-2032)
Figure 14. Spain Water Hardness Test Strip Revenue (USD Million) By Country (2021-2032)
Figure 15. Italy Water Hardness Test Strip Revenue (USD Million) By Country (2021-2032)
Figure 16. Russia Water Hardness Test Strip Revenue (USD Million) By Country (2021-2032)
Figure 17. Rest of Europe Water Hardness Test Strip Revenue (USD Million) By Country (2021-2032)
Figure 11. Asia Pacific Water Hardness Test Strip Revenue (USD Million) By Country (2021-2032)
Figure 12. China Water Hardness Test Strip Revenue (USD Million) By Country (2021-2032)
Figure 13. Japan Water Hardness Test Strip Revenue (USD Million) By Country (2021-2032)
Figure 14. India Water Hardness Test Strip Revenue (USD Million) By Country (2021-2032)
Figure 15. South Korea Water Hardness Test Strip Revenue (USD Million) By Country (2021-2032)
Figure 16. Australia Water Hardness Test Strip Revenue (USD Million) By Country (2021-2032)
Figure 17. South East Asia Water Hardness Test Strip Revenue (USD Million) By Country (2021-2032)
Figure 18. South America Water Hardness Test Strip Revenue (USD Million) By Country (2021-2032)
Figure 19. Brazil Water Hardness Test Strip Revenue (USD Million) By Country (2021-2032)
Figure 20. Argentina Water Hardness Test Strip Revenue (USD Million) By Country (2021-2032)
Figure 21. Rest of Asia Pacific Water Hardness Test Strip Revenue (USD Million) By Country (2021-2032)
Figure 22. Middle East and Africa Water Hardness Test Strip Revenue (USD Million) By Region (2021-2032)
Figure 23. Saudi Arabia Water Hardness Test Strip Revenue (USD Million) By Region (2021-2032)
Figure 24. The UAE Water Hardness Test Strip Revenue (USD Million) By Region (2021-2032)
Figure 25. Rest of Middle East Water Hardness Test Strip Revenue (USD Million) By Region (2021-2032)
Figure 26. South Africa Water Hardness Test Strip Revenue (USD Million) By Region (2021-2032)
Figure 27. Africa Water Hardness Test Strip Revenue (USD Million) By Region (2021-2032)
Figure 28. North America Water Hardness Test Strip Revenue (USD Million) By Type (2021-2032)
Figure 29. North America Water Hardness Test Strip Revenue (USD Million) By Application (2021-2032)
Figure 30. North America Water Hardness Test Strip Revenue (USD Million) By Product (2021-2032)
Figure 31. Europe Water Hardness Test Strip Revenue (USD Million) By Type (2021-2032)
Figure 32. Europe Water Hardness Test Strip Revenue (USD Million) By Application (2021-2032)
Figure 33. Europe Water Hardness Test Strip Revenue (USD Million) By Product (2021-2032)
Figure 34. Asia Pacific Water Hardness Test Strip Revenue (USD Million) By Type (2021-2032)
Figure 35. Asia Pacific Water Hardness Test Strip Revenue (USD Million) By Application (2021-2032)
Figure 36. Asia Pacific Water Hardness Test Strip Revenue (USD Million) By Product (2021-2032)
Figure 37. South America Water Hardness Test Strip Revenue (USD Million) By Type (2021-2032)
Figure 38. South America Water Hardness Test Strip Revenue (USD Million) By Application (2021-2032)
Figure 39. South America Water Hardness Test Strip Revenue (USD Million) By Product (2021-2032)
Figure 40. Middle East and Africa Water Hardness Test Strip Revenue (USD Million) By Type (2021-2032)
Figure 41. Middle East and Africa Water Hardness Test Strip Revenue (USD Million) By Application (2021-2032)
Figure 42. Middle East and Africa Water Hardness Test Strip Revenue (USD Million) By Product (2021-2032)
By Type
Calcium Concentration Measurement
Magnesium Concentration Measurement.
By Application
Industrial
Laboratory
Others
By sales channel
Retail
Non-retail
Countries Analyzed
North America (US, Canada, Mexico)
Europe (Germany, UK, France, Spain, Italy, Russia, Rest of Europe)
Asia Pacific (China, India, Japan, South Korea, Australia, South East Asia, Rest of Asia)
South America (Brazil, Argentina, Rest of South America)
Middle East and Africa (Saudi Arabia, UAE, Rest of Middle East, South Africa, Egypt, Rest of Africa)
