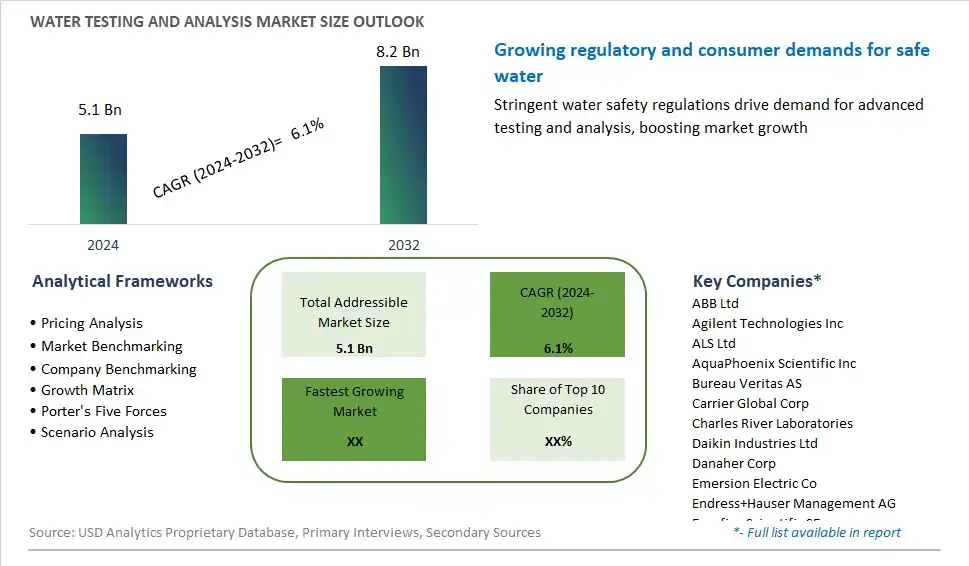
Global Water Testing and Analysis Market Size is valued at $5.1 Billion in 2024 and is forecast to register a growth rate (CAGR) of 6.1% to reach $8.2 Billion by 2032.
The global Water Testing and Analysis Market Comprehensive Study analyzes and forecasts the market size across 6 regions and 24 countries for diverse segments -By Type (TOC Analyzer, PH Meter, Dissolved Oxygen Meter, Conductivity Sensor, Turbidity Meter, Others), By Test (Physicochemical Analysis, Bacteriological Testing), By Method (Membrane Filter, Multiple Tube Dilution, Visual Comparison Method, Spectrometric Method, Titration Method, Others), By End-User (Pharmaceutical, Power, Food and Beverage, Mining, Refineries, Metals, Chemicals, Others)
An Introduction to Water Testing and Analysis Market
Water testing and analysis involve the examination of water samples to assess their chemical, physical, and microbiological properties for various purposes such as drinking water safety, environmental monitoring, and industrial process control in 2024. Water testing methods may include chemical assays, spectroscopy, chromatography, microbiological tests, and sensor technologies, each providing valuable information about water quality, contamination levels, and compliance with regulatory standards. Water testing and analysis are essential for ensuring public health, environmental protection, and regulatory compliance in sectors such as public utilities, agriculture, manufacturing, and healthcare. With growing concerns about water pollution, emerging contaminants, and climate change impacts, the market for water testing and analysis is expanding, driven by investments in testing infrastructure, technology adoption, and regulatory enforcement that enable stakeholders to monitor, manage, and safeguard water resources for present and future generations.
Water Testing and Analysis Competitive Landscape
The market report analyses the leading companies in the industry including ABB Ltd, Agilent Technologies Inc, ALS Ltd, AquaPhoenix Scientific Inc, Bureau Veritas AS, Carrier Global Corp, Charles River Laboratories, Daikin Industries Ltd, Danaher Corp, Emersion Electric Co, Endress+Hauser Management AG, Eurofins Scientific SE, General Electric Company, Honeywell International Inc, Horiba Ltd, Intertek Group PLC, Johnson Controls International PLC, Lennox International Inc, Merieux NutriSciences Corp, Mettler-Toledo International Inc, Neogen Corp, NSF International, SGS S.A., Shimadzu Corp, Suez SA, Thermo Fisher Scientific Inc, Tintometer GmbH, TUV SUD EV, UL LLC, Veolia Environnement SA, and Others.
Water Testing and Analysis Market Dynamics
Water Testing and Analysis Market Trend: Growing Emphasis on Water Safety and Quality
A significant market trend for water testing and analysis is the growing emphasis on water safety and quality across various sectors. With increasing concerns about waterborne contaminants, pollutants, and emerging contaminants like microplastics and pharmaceuticals, there is a heightened awareness of the importance of regular water testing and analysis. This trend is driving governments, industries, municipalities, and individuals to invest in comprehensive water testing and analysis solutions to ensure the safety and quality of drinking water, wastewater, recreational water sources, and industrial water supplies. As a result, there is a rising demand for advanced testing technologies, innovative analytical methods, and robust water quality monitoring programs to address evolving water quality challenges effectively.
Market Driver: Stringent Regulatory Standards and Compliance Requirements
A key market driver for water testing and analysis is the implementation of stringent regulatory standards and compliance requirements governing water quality. Governments worldwide enact regulations and standards to safeguard public health and the environment by setting limits on contaminants, disinfection byproducts, heavy metals, and other parameters in water sources. Compliance with these regulations necessitates regular monitoring, testing, and analysis of water samples to ensure they meet specified quality standards. As a result, industries, municipalities, water utilities, and environmental agencies invest in advanced water testing and analysis technologies and services to achieve regulatory compliance, mitigate risks, and maintain public trust in water safety.
Market Opportunity: Expansion of Point-of-Use and Remote Testing Solutions
An opportunity within the market for water testing and analysis lies in the expansion of point-of-use and remote testing solutions. As the demand for convenient, rapid, and on-site water testing grows, there is an increasing need for portable, handheld, and easy-to-use testing devices and kits that allow users to perform water quality assessments quickly and accurately in various settings. Additionally, the adoption of remote monitoring and digital platforms enables real-time data collection, analysis, and reporting, enhancing the efficiency and accessibility of water testing and analysis processes. By developing and offering innovative point-of-use and remote testing solutions, companies can capitalize on the growing demand for decentralized water testing capabilities in residential, commercial, industrial, and environmental applications.
Water Testing and Analysis Market Share Analysis: pH Meter held the dominant market share in 2024
Within the Water Testing and Analysis Market, the pH Meter segment is the largest category, driven by its essential role in measuring the acidity or alkalinity of water, a fundamental parameter in water quality assessment. pH meters are widely used across various industries, including environmental monitoring, wastewater treatment, agriculture, and food and beverage production, to ensure compliance with regulatory standards and maintain process efficiency. The pH level of water influences chemical reactions, biological processes, and the solubility of minerals, making it a critical indicator of water quality and suitability for specific applications. With the increasing emphasis on water quality management, environmental protection, and public health, the demand for pH meters continues to surge, driving the dominance of the pH Meter segment in the Water Testing and Analysis Market. Additionally, technological advancements, such as portable and digital pH meters, further enhance their usability and accessibility across diverse applications, cementing their position as the largest segment in the market.
Water Testing and Analysis Market Share Analysis: Bacteriological Testing market is poised to register the fastest growth rae over the forecast period to 2032
Among the segments in the Water Testing and Analysis Market, the Bacteriological Testing category is the fastest-growing segment, propelled by increasing concerns over waterborne pathogens and microbial contamination in water sources. Bacteriological testing plays a critical role in assessing water safety by detecting the presence of harmful bacteria, viruses, and parasites that pose risks to human health. With growing awareness of waterborne diseases and outbreaks, regulatory agencies, public health authorities, and industries are intensifying efforts to monitor and ensure microbiological safety in water supplies. Additionally, factors such as urbanization, industrialization, and agricultural activities contribute to microbial pollution, driving the demand for bacteriological testing services and technologies. The adoption of advanced testing methods, such as molecular techniques and rapid detection kits, further accelerates the growth of the Bacteriological Testing segment, making it a key driver in the Water Testing and Analysis Market.
Water Testing and Analysis Market Share Analysis: Spectrometric Method held the dominant market share in 2024
In the Water Testing and Analysis Market, the Spectrometric Method segment is the largest category, primarily due to its accuracy, versatility, and widespread adoption across various industries for water quality assessment. Spectrometric methods utilize instruments such as spectrophotometers and colorimeters to analyze water samples based on their absorption or emission of light at specific wavelengths. This method enables quantitative analysis of various water parameters, including chemical contaminants, nutrients, and pollutants, with high precision and sensitivity. Spectrometric instruments offer rapid results and can simultaneously measure multiple analytes, making them indispensable tools for environmental monitoring, industrial process control, and regulatory compliance. Further, advancements in spectrometric technology, such as portable and field-deployable devices, enhance their usability for on-site testing applications. With the increasing demand for accurate and efficient water analysis solutions, the Spectrometric Method segment continues to dominate the market, presenting significant opportunities for instrument manufacturers and service providers to innovate and address evolving customer needs.
Water Testing and Analysis Market Segmentation
By Type
TOC Analyzer
PH Meter
Dissolved Oxygen Meter
Conductivity Sensor
Turbidity Meter
Others
By Test
Physicochemical Analysis
Bacteriological Testing
By Method
Membrane Filter
Multiple Tube Dilution
Visual Comparison Method
Spectrometric Method
Titration Method
Others
By End-User
Pharmaceutical
Power
Food and Beverage
Mining
Refineries
Metals
Chemicals
Others
Countries Analyzed
North America (US, Canada, Mexico)
Europe (Germany, UK, France, Spain, Italy, Russia, Rest of Europe)
Asia Pacific (China, India, Japan, South Korea, Australia, South East Asia, Rest of Asia)
South America (Brazil, Argentina, Rest of South America)
Middle East and Africa (Saudi Arabia, UAE, Rest of Middle East, South Africa, Egypt, Rest of Africa)
Water Testing and Analysis Companies Profiled in the Study
ABB Ltd
Agilent Technologies Inc
ALS Ltd
AquaPhoenix Scientific Inc
Bureau Veritas AS
Carrier Global Corp
Charles River Laboratories
Daikin Industries Ltd
Danaher Corp
Emersion Electric Co
Endress+Hauser Management AG
Eurofins Scientific SE
General Electric Company
Honeywell International Inc
Horiba Ltd
Intertek Group PLC
Johnson Controls International PLC
Lennox International Inc
Merieux NutriSciences Corp
Mettler-Toledo International Inc
Neogen Corp
NSF International
SGS S.A.
Shimadzu Corp
Suez SA
Thermo Fisher Scientific Inc
Tintometer GmbH
TUV SUD EV
UL LLC
Veolia Environnement SA
*- List Not Exhaustive
Chapter 1. TABLE OF CONTENTS
Chapter 2. Introduction to Water Testing and Analysis Market
2.1. Market Overview
2.2. Key Statistics and Report Highlights
2.3. Scope of the Comprehensive Study
2.3.1. Market Definition
2.3.2 Countries and Regions Covered
2.3.3 Research Objective
2.3.4 Units, Currency, and Conversions
2.3.5 Industry Value Chain
2.4. Key Market Segments
2.5. Key Companies
2.6. Study Period
Chapter 3. Strategic Analysis Review
3.1. Water Testing and Analysis Pricing Analysis and Forecast
3.2. Porter’s Five Forces
3.3. Market Ecosystem
3.4. SWOT Analysis
3.5. Regulatory Scenario
3.3. Effects of Inflation, Russia-Ukraine War, moderating economic growth, and other macroeconomic factors
Chapter 4. Competitive Landscape
4.1. Market Share Analysis
4.1.1. Global Water Testing and Analysis Market Share by Company, 2023
4.1.2. Product Offerings of Leading Water Testing and Analysis Companies
4.2. Market Entropy
4.2.1. New Product Launches in the Industry
4.2.2. Mergers, Acquisitions, Joint ventures, and Partnerships
4.3. Key Strategies and Best Practices
Chapter 5. Global Market Projections: Best, Reference, and Low Case Scenarios
5.1. Growth Analysis- Case Scenario Definitions
5.2. Low Growth Case Scenario Forecasts
5.3. Reference Growth Case Scenario Forecasts
5.4. High Growth Case Scenario Forecasts
Chapter 6. Market Dynamics
6.1. Water Testing and Analysis Market Drivers
6.2. Water Testing and Analysis Market Challenges
6.6. Water Testing and Analysis Market Opportunities
6.4. Water Testing and Analysis Market Trends
Chapter 7. Global Water Testing and Analysis Market Outlook Trends
7.1. Global Water Testing and Analysis Revenue (USD Million) and CAGR (%) by Type (2021-2032)
7.2. Global Water Testing and Analysis Revenue (USD Million) and CAGR (%) by Application (2021-2032)
7.3. Global Water Testing and Analysis Revenue (USD Million) and CAGR (%) by Product (2021-2032)
By Type
TOC Analyzer
PH Meter
Dissolved Oxygen Meter
Conductivity Sensor
Turbidity Meter
Others
By Test
Physicochemical Analysis
Bacteriological Testing
By Method
Membrane Filter
Multiple Tube Dilution
Visual Comparison Method
Spectrometric Method
Titration Method
Others
By End-User
Pharmaceutical
Power
Food and Beverage
Mining
Refineries
Metals
Chemicals
Others
Chapter 8. Global Water Testing and Analysis Regional Analysis and Outlook
8.1. Global Water Testing and Analysis Revenue (USD Million) By Regions (2021- 2032)
8.2. North America Water Testing and Analysis Revenue (USD Million) by Country (2021-2032)
8.2.1. United States Water Testing and Analysis Regional Analysis and Outlook
8.2.2. Canada Water Testing and Analysis Regional Analysis and Outlook
8.2.3. Mexico Water Testing and Analysis Regional Analysis and Outlook
8.3. Europe Water Testing and Analysis Revenue (USD Million), by Country (2021-2032)
8.3.1. Germany Water Testing and Analysis Regional Analysis and Outlook
8.3.2. France Water Testing and Analysis Regional Analysis and Outlook
8.3.3. United Kingdom Water Testing and Analysis Regional Analysis and Outlook
8.3.4. Spain Water Testing and Analysis Regional Analysis and Outlook
8.3.5. Italy Water Testing and Analysis Regional Analysis and Outlook
8.3.6. Russia Water Testing and Analysis Regional Analysis and Outlook
8.3.7. Rest of Europe Water Testing and Analysis Regional Analysis and Outlook
8.4. Asia Pacific Water Testing and Analysis Revenue (USD Million) by Country (2021-2032)
8.4.1. China Water Testing and Analysis Regional Analysis and Outlook
8.4.2. Japan Water Testing and Analysis Regional Analysis and Outlook
8.4.3. India Water Testing and Analysis Regional Analysis and Outlook
8.4.4. South Korea Water Testing and Analysis Regional Analysis and Outlook
8.4.5. Australia Water Testing and Analysis Regional Analysis and Outlook
8.4.6. South East Asia Water Testing and Analysis Regional Analysis and Outlook
8.4.7. Rest of Asia Pacific Water Testing and Analysis Regional Analysis and Outlook
8.5. South America Water Testing and Analysis Revenue (USD Million), by Country (2021-2032)
8.5.1. Brazil Water Testing and Analysis Regional Analysis and Outlook
8.5.2. Argentina Water Testing and Analysis Regional Analysis and Outlook
8.5.3. Rest of South America Water Testing and Analysis Regional Analysis and Outlook
8.6. Middle East and Africa Water Testing and Analysis Revenue (USD Million) by Country (2021-2032)
8.6.1. Middle East Water Testing and Analysis Regional Analysis and Outlook
8.6.2. Africa Water Testing and Analysis Regional Analysis and Outlook
Chapter 9. North America Water Testing and Analysis Analysis and Outlook
9.1. North America Water Testing and Analysis Revenue (USD Million) by Segments (2021-2032)
9.1.1. North America Water Testing and Analysis Revenue (USD Million) by Type (2021-2032)
9.1.2. North America Water Testing and Analysis Revenue (USD Million) by Application (2021-2032)
9.1.3. North America Water Testing and Analysis Revenue (USD Million) by Product (2021-2032)
By Type
TOC Analyzer
PH Meter
Dissolved Oxygen Meter
Conductivity Sensor
Turbidity Meter
Others
By Test
Physicochemical Analysis
Bacteriological Testing
By Method
Membrane Filter
Multiple Tube Dilution
Visual Comparison Method
Spectrometric Method
Titration Method
Others
By End-User
Pharmaceutical
Power
Food and Beverage
Mining
Refineries
Metals
Chemicals
Others
Chapter 10. Europe Water Testing and Analysis Analysis and Outlook
10.1. Europe Water Testing and Analysis Revenue (USD Million), by Segments (USD Million) (2021-2032)
10.1.1. Europe Water Testing and Analysis Revenue (USD Million) by Type (2021-2032)
10.1.2. Europe Water Testing and Analysis Revenue (USD Million) by Application (2021-2032)
10.1.3. Europe Water Testing and Analysis Revenue (USD Million) by Product (2021-2032)
By Type
TOC Analyzer
PH Meter
Dissolved Oxygen Meter
Conductivity Sensor
Turbidity Meter
Others
By Test
Physicochemical Analysis
Bacteriological Testing
By Method
Membrane Filter
Multiple Tube Dilution
Visual Comparison Method
Spectrometric Method
Titration Method
Others
By End-User
Pharmaceutical
Power
Food and Beverage
Mining
Refineries
Metals
Chemicals
Others
Chapter 11. Asia Pacific Water Testing and Analysis Analysis and Outlook
11.1. Asia Pacific Water Testing and Analysis Revenue (USD Million), and Revenue (USD Million) by Segments (2021-2032)
11.1.1. Asia Pacific Water Testing and Analysis Revenue (USD Million) by Type (2021-2032)
11.1.2. Asia Pacific Water Testing and Analysis Revenue (USD Million) by Application (2021-2032)
11.1.3. Asia Pacific Water Testing and Analysis Revenue (USD Million) by Product (2021-2032)
By Type
TOC Analyzer
PH Meter
Dissolved Oxygen Meter
Conductivity Sensor
Turbidity Meter
Others
By Test
Physicochemical Analysis
Bacteriological Testing
By Method
Membrane Filter
Multiple Tube Dilution
Visual Comparison Method
Spectrometric Method
Titration Method
Others
By End-User
Pharmaceutical
Power
Food and Beverage
Mining
Refineries
Metals
Chemicals
Others
Chapter 12. South America Water Testing and Analysis Analysis and Outlook
12.1. South America Water Testing and Analysis Revenue (USD Million), by Segments (2021-2032)
12.1.1. South America Water Testing and Analysis Revenue (USD Million) by Type (2021-2032)
12.1.2. South America Water Testing and Analysis Revenue (USD Million) by Application (2021-2032)
12.1.3. South America Water Testing and Analysis Revenue (USD Million) by Product (2021-2032)
By Type
TOC Analyzer
PH Meter
Dissolved Oxygen Meter
Conductivity Sensor
Turbidity Meter
Others
By Test
Physicochemical Analysis
Bacteriological Testing
By Method
Membrane Filter
Multiple Tube Dilution
Visual Comparison Method
Spectrometric Method
Titration Method
Others
By End-User
Pharmaceutical
Power
Food and Beverage
Mining
Refineries
Metals
Chemicals
Others
Chapter 13. Middle East and Africa Water Testing and Analysis Analysis and Outlook
13.1. Middle East and Africa Water Testing and Analysis Revenue (USD Million), by Segments (2021-2032)
13.1.1. Middle East and Africa Water Testing and Analysis Revenue (USD Million) by Type (2021-2032)
13.1.2. Middle East and Africa Water Testing and Analysis Revenue (USD Million) by Application (2021-2032)
13.1.3. Middle East and Africa Water Testing and Analysis Revenue (USD Million) by Product (2021-2032)
By Type
TOC Analyzer
PH Meter
Dissolved Oxygen Meter
Conductivity Sensor
Turbidity Meter
Others
By Test
Physicochemical Analysis
Bacteriological Testing
By Method
Membrane Filter
Multiple Tube Dilution
Visual Comparison Method
Spectrometric Method
Titration Method
Others
By End-User
Pharmaceutical
Power
Food and Beverage
Mining
Refineries
Metals
Chemicals
Others
Chapter 14. Water Testing and Analysis Company Profiles
14.1 Business Overview
14.2 Product Profiles
14.3 SWOT Profiles
14.5 Recent Developments
14.6 Financial Profile
List of Companies
ABB Ltd
Agilent Technologies Inc
ALS Ltd
AquaPhoenix Scientific Inc
Bureau Veritas AS
Carrier Global Corp
Charles River Laboratories
Daikin Industries Ltd
Danaher Corp
Emersion Electric Co
Endress+Hauser Management AG
Eurofins Scientific SE
General Electric Company
Honeywell International Inc
Horiba Ltd
Intertek Group PLC
Johnson Controls International PLC
Lennox International Inc
Merieux NutriSciences Corp
Mettler-Toledo International Inc
Neogen Corp
NSF International
SGS S.A.
Shimadzu Corp
Suez SA
Thermo Fisher Scientific Inc
Tintometer GmbH
TUV SUD EV
UL LLC
Veolia Environnement SA
15. Methodology and Data Sources
15.1 Customization Offerings
15.2 Subscription Services
15.3 Related Reports
15.4 Publisher Expertise
LIST OF TABLES
Table 1 Market Segmentation Analysis
Table 2 Global Water Testing and Analysis Market Share of Leading Companies, 2023
Table 3 Product Offerings of Leading Companies
Table 4 Low Growth Scenario Forecasts
Table 5 Reference Case Growth Scenario
Table 6 High Growth Case Scenario
Table 7 Global Water Testing and Analysis Revenue (USD Million) And CAGR (%) By Type (2021-2032)
Table 8 Global Water Testing and Analysis Revenue (USD Million) And CAGR (%) By Application (2021-2032)
Table 9 Global Water Testing and Analysis Revenue (USD Million) And CAGR (%) By Product (2021-2032)
Table 10 Global Water Testing and Analysis Market Revenue (USD Million) By Regions (2021-2032)
Table 11 Global Water Testing and Analysis Market Share (%) By Regions (2021-2032)
Table 12 North America Water Testing and Analysis Revenue (USD Million) By Country (2021-2032)
Table 13 Europe Water Testing and Analysis Revenue (USD Million) By Country (2021-2032)
Table 14 Asia Pacific Water Testing and Analysis Revenue (USD Million) By Country (2021-2032)
Table 15 South America Water Testing and Analysis Revenue (USD Million) By Country (2021-2032)
Table 16 Middle East and Africa Water Testing and Analysis Revenue (USD Million) By Region (2021-2032)
Table 17 North America Water Testing and Analysis Revenue (USD Million) By Type (2021-2032)
Table 18 North America Water Testing and Analysis Revenue (USD Million) By Application (2021-2032)
Table 19 North America Water Testing and Analysis Revenue (USD Million) By Product (2021-2032)
Table 20 Europe Water Testing and Analysis Revenue (USD Million) By Type (2021-2032)
Table 21 Europe Water Testing and Analysis Revenue (USD Million) By Application (2021-2032)
Table 22 Europe Water Testing and Analysis Revenue (USD Million) By Product (2021-2032)
Table 23 Asia Pacific Water Testing and Analysis Revenue (USD Million) By Type (2021-2032)
Table 24 Asia Pacific Water Testing and Analysis Revenue (USD Million) By Application (2021-2032)
Table 25 Asia Pacific Water Testing and Analysis Revenue (USD Million) By Product (2021-2032)
Table 26 South America Water Testing and Analysis Revenue (USD Million) By Type (2021-2032)
Table 27 South America Water Testing and Analysis Revenue (USD Million) By Application (2021-2032)
Table 28 South America Water Testing and Analysis Revenue (USD Million) By Product (2021-2032)
Table 29 Middle East and Africa Water Testing and Analysis Revenue (USD Million) By Type (2021-2032)
Table 30 Middle East and Africa Water Testing and Analysis Revenue (USD Million) By Application (2021-2032)
Table 31 Middle East and Africa Water Testing and Analysis Revenue (USD Million) By Product (2021-2032)
LIST OF FIGURES
Figure 1. Market Scope
Figure 2. Pricing Forecasts Per Unit, 2023- 2032
Figure 3. Porter’s Five Forces
Figure 4. Global Water Testing and Analysis Market Revenue (USD Million) By Regions (2021-2032)
Figure 5. Global Water Testing and Analysis Market Share (%) By Regions (2023)
Figure 6. North America Water Testing and Analysis Revenue (USD Million) By Country (2021-2032)
Figure 7. United States Water Testing and Analysis Revenue (USD Million) By Country (2021-2032)
Figure 8. Canada Water Testing and Analysis Revenue (USD Million) By Country (2021-2032)
Figure 9. Mexico Water Testing and Analysis Revenue (USD Million) By Country (2021-2032)
Figure 10. Europe Water Testing and Analysis Revenue (USD Million) By Country (2021-2032)
Figure 11. Germany Water Testing and Analysis Revenue (USD Million) By Country (2021-2032)
Figure 12. France Water Testing and Analysis Revenue (USD Million) By Country (2021-2032)
Figure 13. United Kingdom Water Testing and Analysis Revenue (USD Million) By Country (2021-2032)
Figure 14. Spain Water Testing and Analysis Revenue (USD Million) By Country (2021-2032)
Figure 15. Italy Water Testing and Analysis Revenue (USD Million) By Country (2021-2032)
Figure 16. Russia Water Testing and Analysis Revenue (USD Million) By Country (2021-2032)
Figure 17. Rest of Europe Water Testing and Analysis Revenue (USD Million) By Country (2021-2032)
Figure 11. Asia Pacific Water Testing and Analysis Revenue (USD Million) By Country (2021-2032)
Figure 12. China Water Testing and Analysis Revenue (USD Million) By Country (2021-2032)
Figure 13. Japan Water Testing and Analysis Revenue (USD Million) By Country (2021-2032)
Figure 14. India Water Testing and Analysis Revenue (USD Million) By Country (2021-2032)
Figure 15. South Korea Water Testing and Analysis Revenue (USD Million) By Country (2021-2032)
Figure 16. Australia Water Testing and Analysis Revenue (USD Million) By Country (2021-2032)
Figure 17. South East Asia Water Testing and Analysis Revenue (USD Million) By Country (2021-2032)
Figure 18. South America Water Testing and Analysis Revenue (USD Million) By Country (2021-2032)
Figure 19. Brazil Water Testing and Analysis Revenue (USD Million) By Country (2021-2032)
Figure 20. Argentina Water Testing and Analysis Revenue (USD Million) By Country (2021-2032)
Figure 21. Rest of Asia Pacific Water Testing and Analysis Revenue (USD Million) By Country (2021-2032)
Figure 22. Middle East and Africa Water Testing and Analysis Revenue (USD Million) By Region (2021-2032)
Figure 23. Saudi Arabia Water Testing and Analysis Revenue (USD Million) By Region (2021-2032)
Figure 24. The UAE Water Testing and Analysis Revenue (USD Million) By Region (2021-2032)
Figure 25. Rest of Middle East Water Testing and Analysis Revenue (USD Million) By Region (2021-2032)
Figure 26. South Africa Water Testing and Analysis Revenue (USD Million) By Region (2021-2032)
Figure 27. Africa Water Testing and Analysis Revenue (USD Million) By Region (2021-2032)
Figure 28. North America Water Testing and Analysis Revenue (USD Million) By Type (2021-2032)
Figure 29. North America Water Testing and Analysis Revenue (USD Million) By Application (2021-2032)
Figure 30. North America Water Testing and Analysis Revenue (USD Million) By Product (2021-2032)
Figure 31. Europe Water Testing and Analysis Revenue (USD Million) By Type (2021-2032)
Figure 32. Europe Water Testing and Analysis Revenue (USD Million) By Application (2021-2032)
Figure 33. Europe Water Testing and Analysis Revenue (USD Million) By Product (2021-2032)
Figure 34. Asia Pacific Water Testing and Analysis Revenue (USD Million) By Type (2021-2032)
Figure 35. Asia Pacific Water Testing and Analysis Revenue (USD Million) By Application (2021-2032)
Figure 36. Asia Pacific Water Testing and Analysis Revenue (USD Million) By Product (2021-2032)
Figure 37. South America Water Testing and Analysis Revenue (USD Million) By Type (2021-2032)
Figure 38. South America Water Testing and Analysis Revenue (USD Million) By Application (2021-2032)
Figure 39. South America Water Testing and Analysis Revenue (USD Million) By Product (2021-2032)
Figure 40. Middle East and Africa Water Testing and Analysis Revenue (USD Million) By Type (2021-2032)
Figure 41. Middle East and Africa Water Testing and Analysis Revenue (USD Million) By Application (2021-2032)
Figure 42. Middle East and Africa Water Testing and Analysis Revenue (USD Million) By Product (2021-2032)
By Type
TOC Analyzer
PH Meter
Dissolved Oxygen Meter
Conductivity Sensor
Turbidity Meter
Others
By Test
Physicochemical Analysis
Bacteriological Testing
By Method
Membrane Filter
Multiple Tube Dilution
Visual Comparison Method
Spectrometric Method
Titration Method
Others
By End-User
Pharmaceutical
Power
Food and Beverage
Mining
Refineries
Metals
Chemicals
Others
Countries Analyzed
North America (US, Canada, Mexico)
Europe (Germany, UK, France, Spain, Italy, Russia, Rest of Europe)
Asia Pacific (China, India, Japan, South Korea, Australia, South East Asia, Rest of Asia)
South America (Brazil, Argentina, Rest of South America)
Middle East and Africa (Saudi Arabia, UAE, Rest of Middle East, South Africa, Egypt, Rest of Africa)
