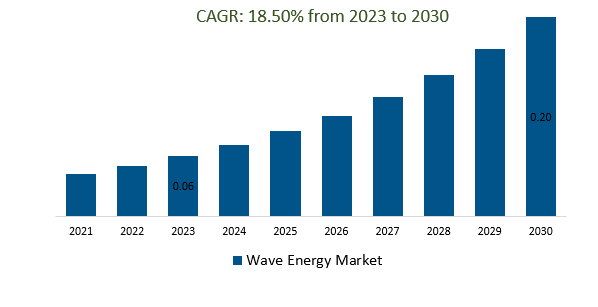
The global Wave Energy Market Size is estimated to be US$ 0.06Billion in 2023 and is poised to register 18.5% growth over the forecast period from 2023 to 2030 to reach US $ 0.20billion in 2030.
The market growth is driven predominantly by the increasing global focus on transitioning to renewable energy sources to mitigate climate change is driving interest in wave energy as a clean and sustainable power generation option. Government incentives, subsidies, and renewable energy targets can play a significant role in promoting the development and deployment of wave energy technologies. Leading companies are focusing on Technological Advancements, Commercial-Scale Deployments, Hybrid Energy Systems, Energy Storage Integration, Grid Integration Solutions, and others to boost market shares in the industry.
Market Overview
The wave energy market involves converting the energy from ocean waves into electricity through various technologies. It is driven by the demand for clean energy sources, abundant wave resources, and technological advancements. Challenges include high costs, intermittent energy generation, and regulatory complexities. The market has progressed from R&D to demonstration projects and is influenced by government policies, investments, and partnerships. Although concentrated in wave-rich regions, the future potential of the market depends on ongoing technology development, cost reduction, and supportive policies, positioning wave energy as a viable contributor to the global renewable energy mix.
Market Dynamics
Market Trends- Companies are launching Energy Security and Independence to attract a consumer base
The wave energy market, energy security and independence involve leveraging wave energy as a domestic and renewable energy source to enhance a nation's energy resilience. By harnessing the power of ocean waves, countries can reduce their dependence on imported fossil fuels, which are subject to price volatility and geopolitical uncertainties. Wave energy systems, once established and optimized, offer a consistent and indigenous energy supply, contributing to a more self-reliant energy portfolio. This can lead to greater stability in energy prices, reduced exposure to global energy market fluctuations, and a strengthened position in achieving sustainable energy goals.
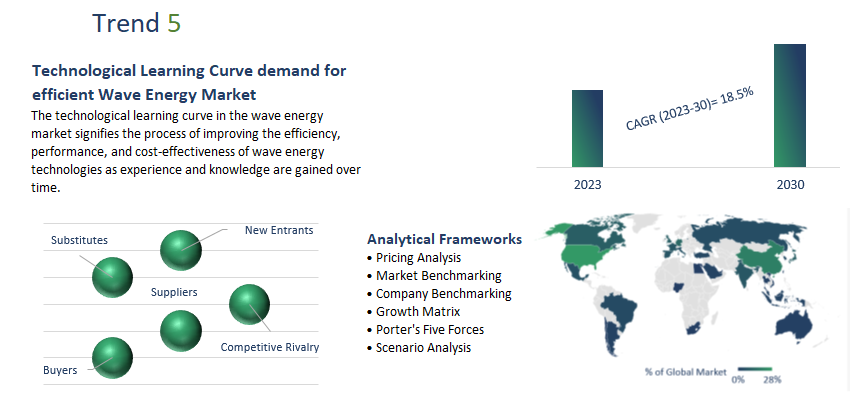
The technological learning curve in the wave energy market signifies the process of improving the efficiency, performance, and cost-effectiveness of wave energy technologies as experience and knowledge are gained over time. As more research, development, and real-world deployment take place, the industry becomes better equipped to address technical challenges, optimize designs, and streamline manufacturing processes. This learning curve often results in reduced costs per unit of energy generated, increased reliability, and improved overall system performance. Lessons learned from early projects, combined with ongoing innovation, contribute to advancing the state of wave energy technology and making it more competitive with established energy sources.
Environmental regulations in the wave energy market refer to the legal frameworks and guidelines set by governments and regulatory bodies to ensure that the deployment and operation of wave energy systems are environmentally responsible and sustainable. These regulations aim to mitigate potential negative impacts on marine ecosystems, coastal environments, and wildlife, while promoting the development of clean and renewable energy sources. By establishing standards for project assessments, permitting, monitoring, and mitigation measures, environmental regulations seek to strike a balance between harnessing wave energy's potential and safeguarding the marine environment. Compliance with these regulations is crucial for gaining public and stakeholder support, as well as for the long-term viability of the wave energy industry.
Oscillating Water Column: The Oscillating Water Column (OWC) is a wave energy converter that captures energy from ocean waves through a partially submerged chamber. As waves enter and retreat, air movement inside the chamber drives a turbine connected to a generator, producing electricity. OWC technology offers simplicity, durability, and reduced environmental impact, but challenges include adapting to varying wave conditions and managing air pressure. Successful OWC deployment hinges on technological advancements, cost reduction, regulatory support, and effective integration into the energy infrastructure.
Power Generation: Power generation in the wave energy market involves converting the kinetic and potential energy of ocean waves into electricity. Various technologies, such as oscillating water columns, point absorbers, attenuators, and overtopping devices, are used to capture wave energy and convert it into a usable form. These technologies typically utilize mechanical, hydraulic, or pneumatic systems to drive turbines or generators, producing electrical power. Power generation from wave energy contributes to the renewable energy mix, supporting sustainability goals and reducing reliance on fossil fuels. Challenges include optimizing efficiency, addressing intermittent wave patterns, and ensuring environmental compatibility. Continued research, technological innovation, and successful commercial deployments are driving the advancement and integration of wave energy into global energy systems.
Segmentation
By Technology
Oscillating Water Column
Oscillating Body Converters
Overtopping Converters
By Deployment
Onshore
Offshore
By Application
Power Generation
Water Desalination
Pumping of Water
Environmental Protection
By Region
North America (United States, Canada, Mexico)
Europe (Germany, France, United Kingdom, Spain, Italy, Others)
Asia Pacific (China, India, Japan, South Korea, Australia, Others)
Latin America (Brazil, Argentina, Others)
Middle East and Africa (Saudi Arabia, UAE, Kuwait, Other Middle East, South Africa, Nigeria, Other Africa)
Key Market Players
AMOG Consulting
Wave Swell Energy, Ltd.
Eco Wave Power, Ltd.
SINN Power GmbH
CorPower Ocean AB
NEMOS GmbH
AWS Ocean Energy Ltd
Atargis Energy Corporation
Ocean Power Technologies, Inc.
Carnegie Clean Energy Ltd
Wave Energy Market Outlook 2023
1 Market Overview
1.1 Introduction to the Wave Energy Market
1.2 Scope of the Study
1.3 Research Objective
1.3.1 Key Market Scope and Segments
1.3.2 Players Covered
1.3.3 Years Considered
2 Executive Summary
2.1 2023 Wave Energy Industry- Market Statistics
3 Market Dynamics
3.1 Market Drivers
3.2 Market Challenges
3.3 Market Opportunities
3.4 Market Trends
4 Market Factor Analysis
4.1 Porter’s Five Forces
4.2 Market Entropy
4.2.1 Global Wave Energy Market Companies with Area Served
4.2.2 Products Offerings Global Wave Energy Market
5 COVID-19 Impact Analysis and Outlook Scenarios
5.1.1 Covid-19 Impact Analysis
5.1.2 Post-COVID-19 Scenario- Low Growth Case
5.1.3 Post-COVID-19 Scenario- Reference Growth Case
5.1.4 Post-COVID-19 Scenario- Low Growth Case
6 Global Wave Energy Market Trends
6.1 Global Wave Energy Revenue (USD Million) and CAGR (%) by Type (2018-2030)
6.2 Global Wave Energy Revenue (USD Million) and CAGR (%) by Applications (2018-2030)
6.3 Global Wave Energy Revenue (USD Million) and CAGR (%) by Regions (2018-2030)
7 Global Wave Energy Market Revenue (USD Million) by Type, and Applications (2018-2022)
7.1 Global Wave Energy Revenue (USD Million) by Type (2018-2022)
7.1.1 Global Wave Energy Revenue (USD Million), Market Share (%) by Type (2018-2022)
7.2 Global Wave Energy Revenue (USD Million) by Applications (2018-2022)
7.2.1 Global Wave Energy Revenue (USD Million), Market Share (%) by Applications (2018-2022)
8 Global Wave Energy Development Regional Status and Outlook
8.1 Global Wave Energy Revenue (USD Million) By Regions (2018-2022)
8.2 North America Wave Energy Revenue (USD Million) by Type, and Application (2018-2022)
8.2.1 North America Wave Energy Revenue (USD Million) by Country (2018-2022)
8.2.2 North America Wave Energy Revenue (USD Million) by Type (2018-2022)
8.2.3 North America Wave Energy Revenue (USD Million) by Applications (2018-2022)
8.3 Europe Wave Energy Revenue (USD Million), by Type, and Applications (USD Million) (2018-2022)
8.3.1 Europe Wave Energy Revenue (USD Million), by Country (2018-2022)
8.3.2 Europe Wave Energy Revenue (USD Million) by Type (2018-2022)
8.3.3 Europe Wave Energy Revenue (USD Million) by Applications (2018-2022)
8.4 Asia Pacific Wave Energy Revenue (USD Million), and Revenue (USD Million) by Type, and Applications (2018-2022)
8.4.1 Asia Pacific Wave Energy Revenue (USD Million) by Country (2018-2022)
8.4.2 Asia Pacific Wave Energy Revenue (USD Million) by Type (2018-2022)
8.4.3 Asia Pacific Wave Energy Revenue (USD Million) by Applications (2018-2022)
8.5 South America Wave Energy Revenue (USD Million), by Type, and Applications (2018-2022)
8.5.1 South America Wave Energy Revenue (USD Million), by Country (2018-2022)
8.5.2 South America Wave Energy Revenue (USD Million) by Type (2018-2022)
8.5.3 South America Wave Energy Revenue (USD Million) by Applications (2018-2022)
8.6 Middle East and Africa Wave Energy Revenue (USD Million), by Type, Technology, Application, Thickness (2018-2022)
8.6.1 Middle East and Africa Wave Energy Revenue (USD Million) by Country (2018-2022)
8.6.2 Middle East and Africa Wave Energy Revenue (USD Million) by Type (2018-2022)
8.6.3 Middle East and Africa Wave Energy Revenue (USD Million) by Applications (2018-2022)
9 Company Profiles
10 Global Wave Energy Market Revenue (USD Million), by Type, and Applications (2023-2030)
10.1 Global Wave Energy Revenue (USD Million) and Market Share (%) by Type (2023-2030)
10.1.1 Global Wave Energy Revenue (USD Million), and Market Share (%) by Type (2023-2030)
10.2 Global Wave Energy Revenue (USD Million) and Market Share (%) by Applications (2023-2030)
10.2.1 Global Wave Energy Revenue (USD Million), and Market Share (%) by Applications (2023-2030)
11 Global Wave Energy Development Regional Status and Outlook Forecast
11.1 Global Wave Energy Revenue (USD Million) By Regions (2023-2030)
11.2 North America Wave Energy Revenue (USD Million) by Type, and Applications (2023-2030)
11.2.1 North America Wave Energy Revenue (USD) Million by Country (2023-2030)
11.2.2 North America Wave Energy Revenue (USD Million), by Type (2023-2030)
11.2.3 North America Wave Energy Revenue (USD Million), Market Share (%) by Applications (2023-2030)
11.3 Europe Wave Energy Revenue (USD Million), by Type, and Applications (2023-2030)
11.3.1 Europe Wave Energy Revenue (USD Million), by Country (2023-2030)
11.3.2 Europe Wave Energy Revenue (USD Million), by Type (2023-2030)
11.3.3 Europe Wave Energy Revenue (USD Million), by Applications (2023-2030)
11.4 Asia Pacific Wave Energy Revenue (USD Million) by Type, and Applications (2023-2030)
11.4.1 Asia Pacific Wave Energy Revenue (USD Million), by Country (2023-2030)
11.4.2 Asia Pacific Wave Energy Revenue (USD Million), by Type (2023-2030)
11.4.3 Asia Pacific Wave Energy Revenue (USD Million), by Applications (2023-2030)
11.5 South America Wave Energy Revenue (USD Million), by Type, and Applications (2023-2030)
11.5.1 South America Wave Energy Revenue (USD Million), by Country (2023-2030)
11.5.2 South America Wave Energy Revenue (USD Million), by Type (2023-2030)
11.5.3 South America Wave Energy Revenue (USD Million), by Applications (2023-2030)
11.6 Middle East and Africa Wave Energy Revenue (USD Million), by Type, and Applications (2023-2030)
11.6.1 Middle East and Africa Wave Energy Revenue (USD Million), by Region (2023-2030)
11.6.2 Middle East and Africa Wave Energy Revenue (USD Million), by Type (2023-2030)
11.6.3 Middle East and Africa Wave Energy Revenue (USD Million), by Applications (2023-2030)
12 Methodology and Data Sources
12.1 Methodology/Research Approach
12.1.1 Research Programs/Design
12.1.2 Market Size Estimation
12.1.3 Market Breakdown and Data Triangulation
12.2 Data Sources
12.2.1 Secondary Sources
12.2.2 Primary Sources
12.3 Disclaimer
List Of Tables
Table 1 Market Segmentation Analysis
Table 2 Global Wave Energy Market Companies with Areas Served
Table 3 Products Offerings Global Wave Energy Market
Table 4 Low Growth Scenario Forecasts
Table 5 Reference Case Growth Scenario
Table 6 High Growth Case Scenario
Table 7 Global Wave Energy Revenue (USD Million) And CAGR (%) By Type (2018-2030)
Table 8 Global Wave Energy Revenue (USD Million) And CAGR (%) By Applications (2018-2030)
Table 9 Global Wave Energy Revenue (USD Million) And CAGR (%) By Regions (2018-2030)
Table 10 Global Wave Energy Revenue (USD Million) By Type (2018-2022)
Table 11 Global Wave Energy Revenue Market Share (%) By Type (2018-2022)
Table 12 Global Wave Energy Revenue (USD Million) By Applications (2018-2022)
Table 13 Global Wave Energy Revenue Market Share (%) By Applications (2018-2022)
Table 14 Global Wave Energy Market Revenue (USD Million) By Regions (2018-2022)
Table 15 Global Wave Energy Market Share (%) By Regions (2018-2022)
Table 16 North America Wave Energy Revenue (USD Million) By Country (2018-2022)
Table 17 North America Wave Energy Revenue (USD Million) By Type (2018-2022)
Table 18 North America Wave Energy Revenue (USD Million) By Applications (2018-2022)
Table 19 Europe Wave Energy Revenue (USD Million) By Country (2018-2022)
Table 20 Europe Wave Energy Revenue (USD Million) By Type (2018-2022)
Table 21 Europe Wave Energy Revenue (USD Million) By Applications (2018-2022)
Table 22 Asia Pacific Wave Energy Revenue (USD Million) By Country (2018-2022)
Table 23 Asia Pacific Wave Energy Revenue (USD Million) By Type (2018-2022)
Table 24 Asia Pacific Wave Energy Revenue (USD Million) By Applications (2018-2022)
Table 25 South America Wave Energy Revenue (USD Million) By Country (2018-2022)
Table 26 South America Wave Energy Revenue (USD Million) By Type (2018-2022)
Table 27 South America Wave Energy Revenue (USD Million) By Applications (2018-2022)
Table 28 Middle East and Africa Wave Energy Revenue (USD Million) By Region (2018-2022)
Table 29 Middle East and Africa Wave Energy Revenue (USD Million) By Type (2018-2022)
Table 30 Middle East and Africa Wave Energy Revenue (USD Million) By Applications (2018-2022)
Table 31 Financial Analysis
Table 32 Global Wave Energy Revenue (USD Million) By Type (2023-2030)
Table 33 Global Wave Energy Revenue Market Share (%) By Type (2023-2030)
Table 34 Global Wave Energy Revenue (USD Million) By Applications (2023-2030)
Table 35 Global Wave Energy Revenue Market Share (%) By Applications (2023-2030)
Table 36 Global Wave Energy Market Revenue (USD Million), And Revenue (USD Million) By Regions (2023-2030)
Table 37 North America Wave Energy Revenue (USD)By Country (2023-2030)
Table 38 North America Wave Energy Revenue (USD Million) By Type (2023-2030)
Table 39 North America Wave Energy Revenue (USD Million) By Applications (2023-2030)
Table 40 Europe Wave Energy Revenue (USD Million) By Country (2023-2030)
Table 41 Europe Wave Energy Revenue (USD Million) By Type (2023-2030)
Table 42 Europe Wave Energy Revenue (USD Million) By Applications (2023-2030)
Table 43 Asia Pacific Wave Energy Revenue (USD Million) By Country (2023-2030)
Table 44 Asia Pacific Wave Energy Revenue (USD Million) By Type (2023-2030)
Table 45 Asia Pacific Wave Energy Revenue (USD Million) By Applications (2023-2030)
Table 46 South America Wave Energy Revenue (USD Million) By Country (2023-2030)
Table 47 South America Wave Energy Revenue (USD Million) By Type (2023-2030)
Table 48 South America Wave Energy Revenue (USD Million) By Applications (2023-2030)
Table 49 Middle East and Africa Wave Energy Revenue (USD Million) By Region (2023-2030)
Table 50 Middle East and Africa Wave Energy Revenue (USD Million) By Region (2023-2030)
Table 51 Middle East and Africa Wave Energy Revenue (USD Million) By Type (2023-2030)
Table 52 Middle East and Africa Wave Energy Revenue (USD Million) By Applications (2023-2030)
Table 53 Research Programs/Design for This Report
Table 54 Key Data Information from Secondary Sources
Table 55 Key Data Information from Primary Sources
List Of Figures
Figure 1 Market Scope
Figure 2 Porter’s Five Forces
Figure 3 Global Wave Energy Revenue (USD Million) By Type (2018-2022)
Figure 4 Global Wave Energy Revenue Market Share (%) By Type (2022)
Figure 5 Global Wave Energy Revenue (USD Million) By Applications (2018-2022)
Figure 6 Global Wave Energy Revenue Market Share (%) By Applications (2022)
Figure 7 Global Wave Energy Market Revenue (USD Million) By Regions (2018-2022)
Figure 8 Global Wave Energy Market Share (%) By Regions (2022)
Figure 9 North America Wave Energy Revenue (USD Million) By Country (2018-2022)
Figure 10 North America Wave Energy Revenue (USD Million) By Type (2018-2022)
Figure 11 North America Wave Energy Revenue (USD Million) By Applications (2018-2022)
Figure 12 Europe Wave Energy Revenue (USD Million) By Country (2018-2022)
Figure 13 Europe Wave Energy Revenue (USD Million) By Type (2018-2022)
Figure 14 Europe Wave Energy Revenue (USD Million) By Applications (2018-2022)
Figure 15 Asia Pacific Wave Energy Revenue (USD Million) By Country (2018-2022)
Figure 16 Asia Pacific Wave Energy Revenue (USD Million) By Type (2018-2022)
Figure 17 Asia Pacific Wave Energy Revenue (USD Million) By Applications (2018-2022)
Figure 18 South America Wave Energy Revenue (USD Million) By Country (2018-2022)
Figure 19 South America Wave Energy Revenue (USD Million) By Type (2018-2022)
Figure 20 South America Wave Energy Revenue (USD Million) By Applications (2018-2022)
Figure 21 Middle East and Africa Wave Energy Revenue (USD Million) By Region (2018-2022)
Figure 22 Middle East and Africa Wave Energy Revenue (USD Million) By Type (2018-2022)
Figure 23 Middle East and Africa Wave Energy Revenue (USD Million) By Applications (2018-2022)
Figure 24 Global Wave Energy Revenue (USD Million) By Type (2023-2030)
Figure 25 Global Wave Energy Revenue Market Share (%) By Type (2030)
Figure 26 Global Wave Energy Revenue (USD Million) By Applications (2023-2030)
Figure 27 Global Wave Energy Revenue Market Share (%) By Applications (2030)
Figure 28 Global Wave Energy Market Revenue (USD Million) By Regions (2023-2030)
Figure 29 North America Wave Energy Revenue (USD Million) By Country (2023-2030)
Figure 30 North America Wave Energy Revenue (USD Million) By Type (2023-2030)
Figure 31 North America Wave Energy Revenue (USD Million) By Applications (2023-2030)
Figure 32 Europe Wave Energy Revenue (USD Million) By Country (2023-2030)
Figure 33 Europe Wave Energy Revenue (USD Million) By Type (2023-2030)
Figure 34 Europe Wave Energy Revenue (USD Million) By Applications (2023-2030)
Figure 35 Asia Pacific Wave Energy Revenue (USD Million) By Country (2023-2030)
Figure 36 Asia Pacific Wave Energy Revenue (USD Million) By Type (2023-2030)
Figure 37 Asia Pacific Wave Energy Revenue (USD Million) By Applications (2023-2030)
Figure 38 South America Wave Energy Revenue (USD Million) By Country (2023-2030)
Figure 39 South America Wave Energy Revenue (USD Million) By Type (2023-2030)
Figure 40 South America Wave Energy Revenue (USD Million) By Applications (2023-2030)
Figure 41 Middle East and Africa Wave Energy Revenue (USD Million) By Region (2023-2030)
Figure 42 Middle East and Africa Wave Energy Revenue (USD Million) By Region (2023-2030)
Figure 43 Middle East and Africa Wave Energy Revenue (USD Million) By Type (2023-2030)
Figure 44 Middle East and Africa Wave Energy Revenue (USD Million) By Applications (2023-2030)
Figure 45 Bottom-Up and Top-Down Approaches For This Report
Figure 46 Data Triangulation
