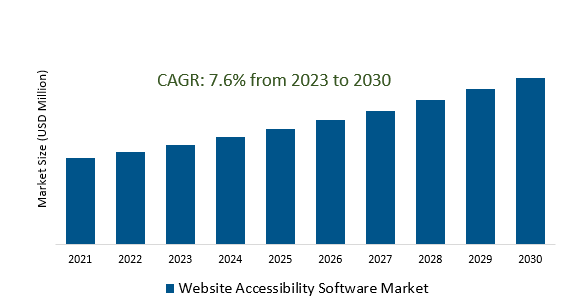
The Website Accessibility Software Market Size is estimated to register 7.6% growth over the forecast period from 2023 to 2030.
Website Accessibility Software Market Overview
Growing awareness about the importance of web accessibility for individuals with disabilities and the advocacy efforts by various organizations are driving the market growth. The increasing shift towards digital platforms and online services across various industries is amplifying the need for accessible websites and applications. Accessibility software providers are integrating AI and machine learning technologies to automate the process of identifying and fixing accessibility issues, which helps in quicker identification and resolution of problems. Accessibility software is being integrated more seamlessly into website development tools and platforms, allowing developers to identify and address accessibility issues during the development phase itself, leading to more accessible websites from the outset. Increased emphasis on educating web developers, designers, and businesses about the importance of accessibility and providing training programs are driving the widespread of the market.
Website Accessibility Software Market Dynamics
Market Trends- Enhancing User Experience Beyond Compliance reshapes Website Accessibility Software Market.
Growing emphasis on human-centered design, placing the end-user at the core of the development process by prioritizing user research and feedback are driving the market demand.
Companies are increasingly embracing inclusive design principles, aiming to create products and services that cater to the diverse needs of all users, including those with disabilities.
Further, the incorporation of multisensory experiences, improvement in navigability and usability, mobile accessibility, enhanced multimedia accessibility, and continuous user engagement through feedback loops are fueling the demand.
Market Driver- Mobile accessibility solutions are a key factor that drives the Website Accessibility Software Market.
The pervasive adoption and dependence on mobile devices for online activities is spurring the need for accessible interfaces on these platforms.
Additionally, regulatory compliance, such as adherence to ADA and WCAG standards, mandating accessibility across mobile interfaces and increased emphasis on user inclusivity and diversity are rapidly increasing market growth.
Furthermore, businesses are recognizing the correlation between improved mobile accessibility and enhanced user experience, driving the demand for market growth.
Market Opportunity- AI-Powered Solutions and Automation are driving the Website Accessibility Software Market.
The growing need for efficient and accurate identification of web accessibility barriers are major factors. Further, advancements in machine learning and AI are facilitating the development of more sophisticated tools capable of automating the detection and remediation of issues, driving the market growth. Additionally, the growing demand for quicker and more efficient accessibility solutions reducing the manual efforts are further propelling the adoption of AI-powered tools.
Market Share Analysis- Automation Check will register the fastest growth.
The Website Accessibility Software Market is analyzed through Automation Check & Manual Check. Automation Check is poised to register the fastest growth. These tools work by scanning web pages to identify potential accessibility barriers, such as missing alt text for images, improper heading structures, insufficient color contrast, or non-descriptive links. Automation check software aims to expedite the identification and resolution of these issues, offering a more efficient and systematic approach compared to manual checks. These tools often provide reports outlining the detected accessibility errors and suggest remediation strategies, helping web developers and site owners address issues promptly. The increasing complexity of websites, the need for continuous compliance with accessibility regulations like WCAG, and the desire for swift identification and resolution of accessibility barriers have fueled the demand for automation check solutions. Additionally, the advancement of AI-powered solutions in this sector aims to enhance the accuracy and coverage of automated accessibility assessments.
Market Share Analysis- Cloud Based held a significant market share in 2023.
The Website Accessibility Software Market is analyzed across various deployment modes including Cloud Based & On Premises. Of these, Cloud Based held a significant market share in 2023. These solutions offer several distinct advantages to organizations aiming to ensure their websites comply with accessibility standards. Cloud-based accessibility software facilitates convenient and flexible access from anywhere with an internet connection, eliminating the need for on-premises infrastructure and enabling users to work remotely. Moreover, these solutions often employ subscription-based models, allowing businesses to scale their usage as needed and pay based on their usage levels. Cloud-based offerings in the Website Accessibility Software Market frequently provide seamless updates and maintenance handled by the service provider, relieving businesses from the burden of managing software updates and infrastructure maintenance. Additionally, these solutions often come with robust security measures driving the market growth.
Website Accessibility Software Market News
The premier digital accessibility leader introduces FixMyCode.ai, a pioneering coding assistant tailored for ADA compliance.
TD introduces a fresh accessibility tool aimed at promoting inclusive online experiences for users.
Website Accessibility Software Market Segmentation
By Type
- Automation Check
- Manual Check
By Application
- Website Owners
- Website Builders
- Sales Teams
- Others
By Deployment Mode
By Region
- North America (United States, Canada, Mexico)
- Europe (Germany, France, United Kingdom, Spain, Italy, Others)
- Asia Pacific (China, India, Japan, South Korea, Australia, Others)
- Latin America (Brazil, Argentina, Others)
- Middle East and Africa (Saudi Arabia, UAE, Kuwait, Other Middle East, South Africa, Nigeria, Other Africa)
Website Accessibility Software Market Companies
- Siteimprove (Denmark)
- User1st (Germany)
- Monsido (Denmark)
- Silktide (United Kingdom)
- Usablenet (United Kingdom)
- Bureau Veritas (France)
- DARE-IT (Netherlands)
- BarrierBreak (India)
- BarrierBreak Solutions (India)
- Coviam Technologies (India)
*list not Exhaustive
Website Accessibility Software Market Outlook 2023
1 Market Overview
1.1 Introduction to the Website Accessibility Software Market
1.2 Scope of the Study
1.3 Research Objective
1.3.1 Key Market Scope and Segments
1.3.2 Players Covered
1.3.3 Years Considered
2 Executive Summary
2.1 2023 Website Accessibility Software Industry- Market Statistics
3 Market Dynamics
3.1 Market Drivers
3.2 Market Challenges
3.3 Market Opportunities
3.4 Market Trends
4 Market Factor Analysis
4.1 Porter’s Five Forces
4.2 Market Entropy
4.2.1 Global Website Accessibility Software Market Companies with Area Served
4.2.2 Products Offerings Global Website Accessibility Software Market
5 COVID-19 Impact Analysis and Outlook Scenarios
5.1.1 Covid-19 Impact Analysis
5.1.2 post-COVID-19 Scenario- Low Growth Case
5.1.3 post-COVID-19 Scenario- Reference Growth Case
5.1.4 post-COVID-19 Scenario- Low Growth Case
6 Global Website Accessibility Software Market Trends
6.1 Global Website Accessibility Software Revenue (USD Million) and CAGR (%) by Type (2018-2030)
6.2 Global Website Accessibility Software Revenue (USD Million) and CAGR (%) by Applications (2018-2030)
6.3 Global Website Accessibility Software Revenue (USD Million) and CAGR (%) by regions (2018-2030)
7 Global Website Accessibility Software Market Revenue (USD Million) by Type, and Applications (2018-2022)
7.1 Global Website Accessibility Software Revenue (USD Million) by Type (2018-2022)
7.1.1 Global Website Accessibility Software Revenue (USD Million), Market Share (%) by Type (2018-2022)
7.2 Global Website Accessibility Software Revenue (USD Million) by Applications (2018-2022)
7.2.1 Global Website Accessibility Software Revenue (USD Million), Market Share (%) by Applications (2018-2022)
8 Global Website Accessibility Software Development Regional Status and Outlook
8.1 Global Website Accessibility Software Revenue (USD Million) By Regions (2018-2022)
8.2 North America Website Accessibility Software Revenue (USD Million) by Type, and Application (2018-2022)
8.2.1 North America Website Accessibility Software Revenue (USD Million) by Country (2018-2022)
8.2.2 North America Website Accessibility Software Revenue (USD Million) by Type (2018-2022)
8.2.3 North America Website Accessibility Software Revenue (USD Million) by Applications (2018-2022)
8.3 Europe Website Accessibility Software Revenue (USD Million), by Type, and Applications (USD Million) (2018-2022)
8.3.1 Europe Website Accessibility Software Revenue (USD Million), by Country (2018-2022)
8.3.2 Europe Website Accessibility Software Revenue (USD Million) by Type (2018-2022)
8.3.3 Europe Website Accessibility Software Revenue (USD Million) by Applications (2018-2022)
8.4 Asia Pacific Website Accessibility Software Revenue (USD Million), and Revenue (USD Million) by Type, and Applications (2018-2022)
8.4.1 Asia Pacific Website Accessibility Software Revenue (USD Million) by Country (2018-2022)
8.4.2 Asia Pacific Website Accessibility Software Revenue (USD Million) by Type (2018-2022)
8.4.3 Asia Pacific Website Accessibility Software Revenue (USD Million) by Applications (2018-2022)
8.5 South America Website Accessibility Software Revenue (USD Million), by Type, and Applications (2018-2022)
8.5.1 South America Website Accessibility Software Revenue (USD Million), by Country (2018-2022)
8.5.2 South America Website Accessibility Software Revenue (USD Million) by Type (2018-2022)
8.5.3 South America Website Accessibility Software Revenue (USD Million) by Applications (2018-2022)
8.6 Middle East and Africa Website Accessibility Software Revenue (USD Million), by Type, Technology, Application, Thickness (2018-2022)
8.6.1 Middle East and Africa Website Accessibility Software Revenue (USD Million) by Country (2018-2022)
8.6.2 Middle East and Africa Website Accessibility Software Revenue (USD Million) by Type (2018-2022)
8.6.3 Middle East and Africa Website Accessibility Software Revenue (USD Million) by Applications (2018-2022)
9 Company Profiles
10 Global Website Accessibility Software Market Revenue (USD Million), by Type, and Applications (2023-2030)
10.1 Global Website Accessibility Software Revenue (USD Million) and Market Share (%) by Type (2023-2030)
10.1.1 Global Website Accessibility Software Revenue (USD Million), and Market Share (%) by Type (2023-2030)
10.2 Global Website Accessibility Software Revenue (USD Million) and Market Share (%) by Applications (2023-2030)
10.2.1 Global Website Accessibility Software Revenue (USD Million), and Market Share (%) by Applications (2023-2030)
11 Global Website Accessibility Software Development Regional Status and Outlook Forecast
11.1 Global Website Accessibility Software Revenue (USD Million) By Regions (2023-2030)
11.2 North America Website Accessibility Software Revenue (USD Million) by Type, and Applications (2023-2030)
11.2.1 North America Website Accessibility Software Revenue (USD) Million by Country (2023-2030)
11.2.2 North America Website Accessibility Software Revenue (USD Million), by Type (2023-2030)
11.2.3 North America Website Accessibility Software Revenue (USD Million), Market Share (%) by Applications (2023-2030)
11.3 Europe Website Accessibility Software Revenue (USD Million), by Type, and Applications (2023-2030)
11.3.1 Europe Website Accessibility Software Revenue (USD Million), by Country (2023-2030)
11.3.2 Europe Website Accessibility Software Revenue (USD Million), by Type (2023-2030)
11.3.3 Europe Website Accessibility Software Revenue (USD Million), by Applications (2023-2030)
11.4 Asia Pacific Website Accessibility Software Revenue (USD Million) by Type, and Applications (2023-2030)
11.4.1 Asia Pacific Website Accessibility Software Revenue (USD Million), by Country (2023-2030)
11.4.2 Asia Pacific Website Accessibility Software Revenue (USD Million), by Type (2023-2030)
11.4.3 Asia Pacific Website Accessibility Software Revenue (USD Million), by Applications (2023-2030)
11.5 South America Website Accessibility Software Revenue (USD Million), by Type, and Applications (2023-2030)
11.5.1 South America Website Accessibility Software Revenue (USD Million), by Country (2023-2030)
11.5.2 South America Website Accessibility Software Revenue (USD Million), by Type (2023-2030)
11.5.3 South America Website Accessibility Software Revenue (USD Million), by Applications (2023-2030)
11.6 Middle East and Africa Website Accessibility Software Revenue (USD Million), by Type, and Applications (2023-2030)
11.6.1 Middle East and Africa Website Accessibility Software Revenue (USD Million), by region (2023-2030)
11.6.2 Middle East and Africa Website Accessibility Software Revenue (USD Million), by Type (2023-2030)
11.6.3 Middle East and Africa Website Accessibility Software Revenue (USD Million), by Applications (2023-2030)
12 Methodology and Data Sources
12.1 Methodology/Research Approach
12.1.1 Research Programs/Design
12.1.2 Market Size Estimation
12.1.3 Market Breakdown and Data Triangulation
12.2 Data Sources
12.2.1 Secondary Sources
12.2.2 Primary Sources
12.3 Disclaimer
List of Tables
Table 1 Market Segmentation Analysis
Table 2 Global Website Accessibility Software Market Companies with Areas Served
Table 3 Products Offerings Global Website Accessibility Software Market
Table 4 Low Growth Scenario Forecasts
Table 5 Reference Case Growth Scenario
Table 6 High Growth Case Scenario
Table 7 Global Website Accessibility Software Revenue (USD Million) And CAGR (%) By Type (2018-2030)
Table 8 Global Website Accessibility Software Revenue (USD Million) And CAGR (%) By Applications (2018-2030)
Table 9 Global Website Accessibility Software Revenue (USD Million) And CAGR (%) By Regions (2018-2030)
Table 10 Global Website Accessibility Software Revenue (USD Million) By Type (2018-2022)
Table 11 Global Website Accessibility Software Revenue Market Share (%) By Type (2018-2022)
Table 12 Global Website Accessibility Software Revenue (USD Million) By Applications (2018-2022)
Table 13 Global Website Accessibility Software Revenue Market Share (%) By Applications (2018-2022)
Table 14 Global Website Accessibility Software Market Revenue (USD Million) By Regions (2018-2022)
Table 15 Global Website Accessibility Software Market Share (%) By Regions (2018-2022)
Table 16 North America Website Accessibility Software Revenue (USD Million) By Country (2018-2022)
Table 17 North America Website Accessibility Software Revenue (USD Million) By Type (2018-2022)
Table 18 North America Website Accessibility Software Revenue (USD Million) By Applications (2018-2022)
Table 19 Europe Website Accessibility Software Revenue (USD Million) By Country (2018-2022)
Table 20 Europe Website Accessibility Software Revenue (USD Million) By Type (2018-2022)
Table 21 Europe Website Accessibility Software Revenue (USD Million) By Applications (2018-2022)
Table 22 Asia Pacific Website Accessibility Software Revenue (USD Million) By Country (2018-2022)
Table 23 Asia Pacific Website Accessibility Software Revenue (USD Million) By Type (2018-2022)
Table 24 Asia Pacific Website Accessibility Software Revenue (USD Million) By Applications (2018-2022)
Table 25 South America Website Accessibility Software Revenue (USD Million) By Country (2018-2022)
Table 26 South America Website Accessibility Software Revenue (USD Million) By Type (2018-2022)
Table 27 South America Website Accessibility Software Revenue (USD Million) By Applications (2018-2022)
Table 28 Middle East and Africa Website Accessibility Software Revenue (USD Million) By Region (2018-2022)
Table 29 Middle East and Africa Website Accessibility Software Revenue (USD Million) By Type (2018-2022)
Table 30 Middle East and Africa Website Accessibility Software Revenue (USD Million) By Applications (2018-2022)
Table 31 Financial Analysis
Table 32 Global Website Accessibility Software Revenue (USD Million) By Type (2023-2030)
Table 33 Global Website Accessibility Software Revenue Market Share (%) By Type (2023-2030)
Table 34 Global Website Accessibility Software Revenue (USD Million) By Applications (2023-2030)
Table 35 Global Website Accessibility Software Revenue Market Share (%) By Applications (2023-2030)
Table 36 Global Website Accessibility Software Market Revenue (USD Million), And Revenue (USD Million) By Regions (2023-2030)
Table 37 North America Website Accessibility Software Revenue (USD)By Country (2023-2030)
Table 38 North America Website Accessibility Software Revenue (USD Million) By Type (2023-2030)
Table 39 North America Website Accessibility Software Revenue (USD Million) By Applications (2023-2030)
Table 40 Europe Website Accessibility Software Revenue (USD Million) By Country (2023-2030)
Table 41 Europe Website Accessibility Software Revenue (USD Million) By Type (2023-2030)
Table 42 Europe Website Accessibility Software Revenue (USD Million) By Applications (2023-2030)
Table 43 Asia Pacific Website Accessibility Software Revenue (USD Million) By Country (2023-2030)
Table 44 Asia Pacific Website Accessibility Software Revenue (USD Million) By Type (2023-2030)
Table 45 Asia Pacific Website Accessibility Software Revenue (USD Million) By Applications (2023-2030)
Table 46 South America Website Accessibility Software Revenue (USD Million) By Country (2023-2030)
Table 47 South America Website Accessibility Software Revenue (USD Million) By Type (2023-2030)
Table 48 South America Website Accessibility Software Revenue (USD Million) By Applications (2023-2030)
Table 49 Middle East and Africa Website Accessibility Software Revenue (USD Million) By Region (2023-2030)
Table 50 Middle East and Africa Website Accessibility Software Revenue (USD Million) By Region (2023-2030)
Table 51 Middle East and Africa Website Accessibility Software Revenue (USD Million) By Type (2023-2030)
Table 52 Middle East and Africa Website Accessibility Software Revenue (USD Million) By Applications (2023-2030)
Table 53 Research Programs/Design for This Report
Table 54 Key Data Information from Secondary Sources
Table 55 Key Data Information from Primary Sources
List of Figures
Figure 1 Market Scope
Figure 2 Porter’s Five Forces
Figure 3 Global Website Accessibility Software Revenue (USD Million) By Type (2018-2022)
Figure 4 Global Website Accessibility Software Revenue Market Share (%) By Type (2022)
Figure 5 Global Website Accessibility Software Revenue (USD Million) By Applications (2018-2022)
Figure 6 Global Website Accessibility Software Revenue Market Share (%) By Applications (2022)
Figure 7 Global Website Accessibility Software Market Revenue (USD Million) By Regions (2018-2022)
Figure 8 Global Website Accessibility Software Market Share (%) By Regions (2022)
Figure 9 North America Website Accessibility Software Revenue (USD Million) By Country (2018-2022)
Figure 10 North America Website Accessibility Software Revenue (USD Million) By Type (2018-2022)
Figure 11 North America Website Accessibility Software Revenue (USD Million) By Applications (2018-2022)
Figure 12 Europe Website Accessibility Software Revenue (USD Million) By Country (2018-2022)
Figure 13 Europe Website Accessibility Software Revenue (USD Million) By Type (2018-2022)
Figure 14 Europe Website Accessibility Software Revenue (USD Million) By Applications (2018-2022)
Figure 15 Asia Pacific Website Accessibility Software Revenue (USD Million) By Country (2018-2022)
Figure 16 Asia Pacific Website Accessibility Software Revenue (USD Million) By Type (2018-2022)
Figure 17 Asia Pacific Website Accessibility Software Revenue (USD Million) By Applications (2018-2022)
Figure 18 South America Website Accessibility Software Revenue (USD Million) By Country (2018-2022)
Figure 19 South America Website Accessibility Software Revenue (USD Million) By Type (2018-2022)
Figure 20 South America Website Accessibility Software Revenue (USD Million) By Applications (2018-2022)
Figure 21 Middle East and Africa Website Accessibility Software Revenue (USD Million) By Region (2018-2022)
Figure 22 Middle East and Africa Website Accessibility Software Revenue (USD Million) By Type (2018-2022)
Figure 23 Middle East and Africa Website Accessibility Software Revenue (USD Million) By Applications (2018-2022)
Figure 24 Global Website Accessibility Software Revenue (USD Million) By Type (2023-2030)
Figure 25 Global Website Accessibility Software Revenue Market Share (%) By Type (2030)
Figure 26 Global Website Accessibility Software Revenue (USD Million) By Applications (2023-2030)
Figure 27 Global Website Accessibility Software Revenue Market Share (%) By Applications (2030)
Figure 28 Global Website Accessibility Software Market Revenue (USD Million) By Regions (2023-2030)
Figure 29 North America Website Accessibility Software Revenue (USD Million) By Country (2023-2030)
Figure 30 North America Website Accessibility Software Revenue (USD Million) By Type (2023-2030)
Figure 31 North America Website Accessibility Software Revenue (USD Million) By Applications (2023-2030)
Figure 32 Europe Website Accessibility Software Revenue (USD Million) By Country (2023-2030)
Figure 33 Europe Website Accessibility Software Revenue (USD Million) By Type (2023-2030)
Figure 34 Europe Website Accessibility Software Revenue (USD Million) By Applications (2023-2030)
Figure 35 Asia Pacific Website Accessibility Software Revenue (USD Million) By Country (2023-2030)
Figure 36 Asia Pacific Website Accessibility Software Revenue (USD Million) By Type (2023-2030)
Figure 37 Asia Pacific Website Accessibility Software Revenue (USD Million) By Applications (2023-2030)
Figure 38 South America Website Accessibility Software Revenue (USD Million) By Country (2023-2030)
Figure 39 South America Website Accessibility Software Revenue (USD Million) By Type (2023-2030)
Figure 40 South America Website Accessibility Software Revenue (USD Million) By Applications (2023-2030)
Figure 41 Middle East and Africa Website Accessibility Software Revenue (USD Million) By Region (2023-2030)
Figure 42 Middle East and Africa Website Accessibility Software Revenue (USD Million) By Region (2023-2030)
Figure 43 Middle East and Africa Website Accessibility Software Revenue (USD Million) By Type (2023-2030)
Figure 44 Middle East and Africa Website Accessibility Software Revenue (USD Million) By Applications (2023-2030)
Figure 45 Bottom-Up and Top-Down Approaches for This Report
Figure 46 Data Triangulation
