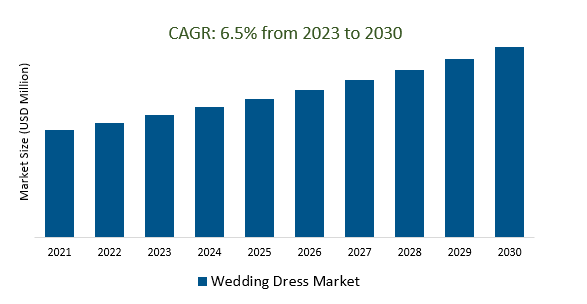
The Global Wedding Dress Market Size is estimated to register 6.5% growth over the forecast period from 2023 to 2030.
The market's growth is spurred by the persistent influence of cultural and regional factors on wedding dress designs. To illustrate, there is a continued demand for traditional and culturally significant wedding dresses, and global fashion trends also influence the choices in different regions. Leading Companies focusing on Market Growth, Sustainability Ethical Practices, Customization and Personalization, E-commerce and Online Sales, Inclusivity and Size Diversity, Economic Factors, and others to boost market shares in the industry.
Market Overview
The wedding dress market is a diverse and competitive industry driven by factors such as fashion trends, customization, sustainability, and cultural influences. It caters to a wide range of bridal attire needs, from bridal gowns to groom's attire. The market's growth is closely tied to the number of weddings taking place, and the trends within it often mirror broader fashion trends. With a growing emphasis on personalization, eco-friendly practices, inclusivity, and ethical production, the wedding dress market in 2023 offers both opportunities for growth and challenges, requiring businesses to stay attuned to evolving consumer preferences and the impact of economic conditions. Social media and influencers also play a significant role in shaping bridal fashion trends.
Market Dynamics
Market Trends- Online wedding dress shopping is rapidly gaining popularity, as brides increasingly embrace the convenience and convenience of buying their dream dress from the comfort of their own homes.
The wedding dress market is experiencing a significant surge in online shopping, driven by the convenience it offers to brides. This trend is powered by the ease of browsing, comprehensive product information, and the adoption of virtual try-on technologies, making it a fundamental shift in how brides select their dream wedding dresses, with the potential for continued transformation in the industry.
Market Driver- Influencer marketing and social media are increasingly driving demand for wedding dresses, as brides look to their favorite influencers for inspiration and guidance.
influencer marketing and social media have emerged as influential drivers within the wedding dress industry. Brides increasingly turn to their favored influencers for inspiration and guidance in the selection of their wedding attire. These influencers provide authentic and relatable insights while collaborating with designers and boutiques to showcase a diverse array of wedding dress options. Furthermore, platforms such as Instagram, Pinterest, and TikTok serve as abundant sources of wedding-related content and creative inspiration for brides. This digital transformation is reshaping brides' approaches to wedding dress shopping, necessitating bridal brands to adapt their strategies to cater to this tech-savvy audience. This trend is anticipated to persist and will continue to reshape the landscape of wedding dress shopping in the digital era.
Market Opportunity- The wedding dress market is becoming increasingly inclusive and size-diverse, as brides of all shapes and sizes demand dresses that make them feel beautiful and confident on their special day.
The wedding dress market is transforming, embracing size inclusivity and diversity, as brides of all shapes and sizes seek dresses that enhance their confidence and beauty. Bridal designers and retailers are expanding their size ranges, using diverse models, and reimagining traditional styles to provide more options to brides. This inclusive shift is empowering brides to feel special and confident on their wedding day, irrespective of their body size, reshaping the bridal industry to celebrate diversity and individuality.
Market Share Analysis- Gowns Wedding Dress Market will register the fastest growth
The Global Wedding Dress Market is analyzed across Gowns, Suits, Sherwanis, and others. Gowns is poised to register the fastest growth. The wedding dress market, particularly in the gowns segment, is a significant and evolving part of the bridal industry. Brides are seeking diverse styles and designs to suit their unique preferences, and the market continues to adapt by offering a wide range of gowns to cater to different tastes and trends, ensuring that brides have ample choices for their special day.
Market Share Analysis- Females held a significant market share in 2023
The Global Wedding Dress Market is analyzed across various Genders including Males, Females, and others. Of these, Females held a significant market share in 2023. Females are central to the wedding dress market, as brides' diverse preferences and needs drive the industry. Bridal designers and retailers adapt to cater to varying tastes and body types, offering a wide range of gown styles, sizes, and customization options to empower brides to find their ideal dress, ensuring they feel confident and beautiful on their wedding day.
Wedding Dress Market Segmentation
By Type
- Gowns
- Suits
- Sherwanis
- Others
By Gender
By Sales Channel
By Price Range
By End-User
- Individual
- Rental Service
- Consultants
- Others
By Region
- North America (United States, Canada, Mexico)
- Europe (Germany, France, United Kingdom, Spain, Italy, Others)
- Asia Pacific (China, India, Japan, South Korea, Australia, Others)
- Latin America (Brazil, Argentina, Others)
- Middle East and Africa (Saudi Arabia, UAE, Kuwait, Other Middle East, South Africa, Nigeria, Other Africa)
Wedding Dress Market Companies
- Maggie Sottero (United States)
- Markarian bridal (United States)
- Danielle Frankel (United States)
- Berta Bridal (Israeli)
- Marchesa (United States)
- Monique Lhuillier (United States)
- Jenny Packham (United Kingdom)
- David's Bridal (United States)
- Rosa Clará (Spain)
- Odylyne (United States)
*List not exhaustive
Wedding Dress Market Outlook 2023
1 Market Overview
1.1 Introduction to the Wedding Dress Market
1.2 Scope of the Study
1.3 Research Objective
1.3.1 Key Market Scope and Segments
1.3.2 Players Covered
1.3.3 Years Considered
2 Executive Summary
2.1 2023 Wedding Dress Industry- Market Statistics
3 Market Dynamics
3.1 Market Drivers
3.2 Market Challenges
3.3 Market Opportunities
3.4 Market Trends
4 Market Factor Analysis
4.1 Porter’s Five Forces
4.2 Market Entropy
4.2.1 Global Wedding Dress Market Companies with Area Served
4.2.2 Products Offerings Global Wedding Dress Market
5 COVID-19 Impact Analysis and Outlook Scenarios
5.1.1 Covid-19 Impact Analysis
5.1.2 post-COVID-19 Scenario- Low Growth Case
5.1.3 post-COVID-19 Scenario- Reference Growth Case
5.1.4 post-COVID-19 Scenario- Low Growth Case
6 Global Wedding Dress Market Trends
6.1 Global Wedding Dress Revenue (USD Million) and CAGR (%) by Type (2018-2030)
6.2 Global Wedding Dress Revenue (USD Million) and CAGR (%) by Applications (2018-2030)
6.3 Global Wedding Dress Revenue (USD Million) and CAGR (%) by regions (2018-2030)
7 Global Wedding Dress Market Revenue (USD Million) by Type, and Applications (2018-2022)
7.1 Global Wedding Dress Revenue (USD Million) by Type (2018-2022)
7.1.1 Global Wedding Dress Revenue (USD Million), Market Share (%) by Type (2018-2022)
7.2 Global Wedding Dress Revenue (USD Million) by Applications (2018-2022)
7.2.1 Global Wedding Dress Revenue (USD Million), Market Share (%) by Applications (2018-2022)
8 Global Wedding Dress Development Regional Status and Outlook
8.1 Global Wedding Dress Revenue (USD Million) By Regions (2018-2022)
8.2 North America Wedding Dress Revenue (USD Million) by Type, and Application (2018-2022)
8.2.1 North America Wedding Dress Revenue (USD Million) by Country (2018-2022)
8.2.2 North America Wedding Dress Revenue (USD Million) by Type (2018-2022)
8.2.3 North America Wedding Dress Revenue (USD Million) by Applications (2018-2022)
8.3 Europe Wedding Dress Revenue (USD Million), by Type, and Applications (USD Million) (2018-2022)
8.3.1 Europe Wedding Dress Revenue (USD Million), by Country (2018-2022)
8.3.2 Europe Wedding Dress Revenue (USD Million) by Type (2018-2022)
8.3.3 Europe Wedding Dress Revenue (USD Million) by Applications (2018-2022)
8.4 Asia Pacific Wedding Dress Revenue (USD Million), and Revenue (USD Million) by Type, and Applications (2018-2022)
8.4.1 Asia Pacific Wedding Dress Revenue (USD Million) by Country (2018-2022)
8.4.2 Asia Pacific Wedding Dress Revenue (USD Million) by Type (2018-2022)
8.4.3 Asia Pacific Wedding Dress Revenue (USD Million) by Applications (2018-2022)
8.5 South America Wedding Dress Revenue (USD Million), by Type, and Applications (2018-2022)
8.5.1 South America Wedding Dress Revenue (USD Million), by Country (2018-2022)
8.5.2 South America Wedding Dress Revenue (USD Million) by Type (2018-2022)
8.5.3 South America Wedding Dress Revenue (USD Million) by Applications (2018-2022)
8.6 Middle East and Africa Wedding Dress Revenue (USD Million), by Type, Technology, Application, Thickness (2018-2022)
8.6.1 Middle East and Africa Wedding Dress Revenue (USD Million) by Country (2018-2022)
8.6.2 Middle East and Africa Wedding Dress Revenue (USD Million) by Type (2018-2022)
8.6.3 Middle East and Africa Wedding Dress Revenue (USD Million) by Applications (2018-2022)
9 Company Profiles
10 Global Wedding Dress Market Revenue (USD Million), by Type, and Applications (2023-2030)
10.1 Global Wedding Dress Revenue (USD Million) and Market Share (%) by Type (2023-2030)
10.1.1 Global Wedding Dress Revenue (USD Million), and Market Share (%) by Type (2023-2030)
10.2 Global Wedding Dress Revenue (USD Million) and Market Share (%) by Applications (2023-2030)
10.2.1 Global Wedding Dress Revenue (USD Million), and Market Share (%) by Applications (2023-2030)
11 Global Wedding Dress Development Regional Status and Outlook Forecast
11.1 Global Wedding Dress Revenue (USD Million) By Regions (2023-2030)
11.2 North America Wedding Dress Revenue (USD Million) by Type, and Applications (2023-2030)
11.2.1 North America Wedding Dress Revenue (USD) Million by Country (2023-2030)
11.2.2 North America Wedding Dress Revenue (USD Million), by Type (2023-2030)
11.2.3 North America Wedding Dress Revenue (USD Million), Market Share (%) by Applications (2023-2030)
11.3 Europe Wedding Dress Revenue (USD Million), by Type, and Applications (2023-2030)
11.3.1 Europe Wedding Dress Revenue (USD Million), by Country (2023-2030)
11.3.2 Europe Wedding Dress Revenue (USD Million), by Type (2023-2030)
11.3.3 Europe Wedding Dress Revenue (USD Million), by Applications (2023-2030)
11.4 Asia Pacific Wedding Dress Revenue (USD Million) by Type, and Applications (2023-2030)
11.4.1 Asia Pacific Wedding Dress Revenue (USD Million), by Country (2023-2030)
11.4.2 Asia Pacific Wedding Dress Revenue (USD Million), by Type (2023-2030)
11.4.3 Asia Pacific Wedding Dress Revenue (USD Million), by Applications (2023-2030)
11.5 South America Wedding Dress Revenue (USD Million), by Type, and Applications (2023-2030)
11.5.1 South America Wedding Dress Revenue (USD Million), by Country (2023-2030)
11.5.2 South America Wedding Dress Revenue (USD Million), by Type (2023-2030)
11.5.3 South America Wedding Dress Revenue (USD Million), by Applications (2023-2030)
11.6 Middle East and Africa Wedding Dress Revenue (USD Million), by Type, and Applications (2023-2030)
11.6.1 Middle East and Africa Wedding Dress Revenue (USD Million), by region (2023-2030)
11.6.2 Middle East and Africa Wedding Dress Revenue (USD Million), by Type (2023-2030)
11.6.3 Middle East and Africa Wedding Dress Revenue (USD Million), by Applications (2023-2030)
12 Methodology and Data Sources
12.1 Methodology/Research Approach
12.1.1 Research Programs/Design
12.1.2 Market Size Estimation
12.1.3 Market Breakdown and Data Triangulation
12.2 Data Sources
12.2.1 Secondary Sources
12.2.2 Primary Sources
12.3 Disclaimer
List of Tables
Table 1 Market Segmentation Analysis
Table 2 Global Wedding Dress Market Companies with Areas Served
Table 3 Products Offerings Global Wedding Dress Market
Table 4 Low Growth Scenario Forecasts
Table 5 Reference Case Growth Scenario
Table 6 High Growth Case Scenario
Table 7 Global Wedding Dress Revenue (USD Million) And CAGR (%) By Type (2018-2030)
Table 8 Global Wedding Dress Revenue (USD Million) And CAGR (%) By Applications (2018-2030)
Table 9 Global Wedding Dress Revenue (USD Million) And CAGR (%) By Regions (2018-2030)
Table 10 Global Wedding Dress Revenue (USD Million) By Type (2018-2022)
Table 11 Global Wedding Dress Revenue Market Share (%) By Type (2018-2022)
Table 12 Global Wedding Dress Revenue (USD Million) By Applications (2018-2022)
Table 13 Global Wedding Dress Revenue Market Share (%) By Applications (2018-2022)
Table 14 Global Wedding Dress Market Revenue (USD Million) By Regions (2018-2022)
Table 15 Global Wedding Dress Market Share (%) By Regions (2018-2022)
Table 16 North America Wedding Dress Revenue (USD Million) By Country (2018-2022)
Table 17 North America Wedding Dress Revenue (USD Million) By Type (2018-2022)
Table 18 North America Wedding Dress Revenue (USD Million) By Applications (2018-2022)
Table 19 Europe Wedding Dress Revenue (USD Million) By Country (2018-2022)
Table 20 Europe Wedding Dress Revenue (USD Million) By Type (2018-2022)
Table 21 Europe Wedding Dress Revenue (USD Million) By Applications (2018-2022)
Table 22 Asia Pacific Wedding Dress Revenue (USD Million) By Country (2018-2022)
Table 23 Asia Pacific Wedding Dress Revenue (USD Million) By Type (2018-2022)
Table 24 Asia Pacific Wedding Dress Revenue (USD Million) By Applications (2018-2022)
Table 25 South America Wedding Dress Revenue (USD Million) By Country (2018-2022)
Table 26 South America Wedding Dress Revenue (USD Million) By Type (2018-2022)
Table 27 South America Wedding Dress Revenue (USD Million) By Applications (2018-2022)
Table 28 Middle East and Africa Wedding Dress Revenue (USD Million) By Region (2018-2022)
Table 29 Middle East and Africa Wedding Dress Revenue (USD Million) By Type (2018-2022)
Table 30 Middle East and Africa Wedding Dress Revenue (USD Million) By Applications (2018-2022)
Table 31 Financial Analysis
Table 32 Global Wedding Dress Revenue (USD Million) By Type (2023-2030)
Table 33 Global Wedding Dress Revenue Market Share (%) By Type (2023-2030)
Table 34 Global Wedding Dress Revenue (USD Million) By Applications (2023-2030)
Table 35 Global Wedding Dress Revenue Market Share (%) By Applications (2023-2030)
Table 36 Global Wedding Dress Market Revenue (USD Million), And Revenue (USD Million) By Regions (2023-2030)
Table 37 North America Wedding Dress Revenue (USD)By Country (2023-2030)
Table 38 North America Wedding Dress Revenue (USD Million) By Type (2023-2030)
Table 39 North America Wedding Dress Revenue (USD Million) By Applications (2023-2030)
Table 40 Europe Wedding Dress Revenue (USD Million) By Country (2023-2030)
Table 41 Europe Wedding Dress Revenue (USD Million) By Type (2023-2030)
Table 42 Europe Wedding Dress Revenue (USD Million) By Applications (2023-2030)
Table 43 Asia Pacific Wedding Dress Revenue (USD Million) By Country (2023-2030)
Table 44 Asia Pacific Wedding Dress Revenue (USD Million) By Type (2023-2030)
Table 45 Asia Pacific Wedding Dress Revenue (USD Million) By Applications (2023-2030)
Table 46 South America Wedding Dress Revenue (USD Million) By Country (2023-2030)
Table 47 South America Wedding Dress Revenue (USD Million) By Type (2023-2030)
Table 48 South America Wedding Dress Revenue (USD Million) By Applications (2023-2030)
Table 49 Middle East and Africa Wedding Dress Revenue (USD Million) By Region (2023-2030)
Table 50 Middle East and Africa Wedding Dress Revenue (USD Million) By Region (2023-2030)
Table 51 Middle East and Africa Wedding Dress Revenue (USD Million) By Type (2023-2030)
Table 52 Middle East and Africa Wedding Dress Revenue (USD Million) By Applications (2023-2030)
Table 53 Research Programs/Design for This Report
Table 54 Key Data Information from Secondary Sources
Table 55 Key Data Information from Primary Sources
List of Figures
Figure 1 Market Scope
Figure 2 Porter’s Five Forces
Figure 3 Global Wedding Dress Revenue (USD Million) By Type (2018-2022)
Figure 4 Global Wedding Dress Revenue Market Share (%) By Type (2022)
Figure 5 Global Wedding Dress Revenue (USD Million) By Applications (2018-2022)
Figure 6 Global Wedding Dress Revenue Market Share (%) By Applications (2022)
Figure 7 Global Wedding Dress Market Revenue (USD Million) By Regions (2018-2022)
Figure 8 Global Wedding Dress Market Share (%) By Regions (2022)
Figure 9 North America Wedding Dress Revenue (USD Million) By Country (2018-2022)
Figure 10 North America Wedding Dress Revenue (USD Million) By Type (2018-2022)
Figure 11 North America Wedding Dress Revenue (USD Million) By Applications (2018-2022)
Figure 12 Europe Wedding Dress Revenue (USD Million) By Country (2018-2022)
Figure 13 Europe Wedding Dress Revenue (USD Million) By Type (2018-2022)
Figure 14 Europe Wedding Dress Revenue (USD Million) By Applications (2018-2022)
Figure 15 Asia Pacific Wedding Dress Revenue (USD Million) By Country (2018-2022)
Figure 16 Asia Pacific Wedding Dress Revenue (USD Million) By Type (2018-2022)
Figure 17 Asia Pacific Wedding Dress Revenue (USD Million) By Applications (2018-2022)
Figure 18 South America Wedding Dress Revenue (USD Million) By Country (2018-2022)
Figure 19 South America Wedding Dress Revenue (USD Million) By Type (2018-2022)
Figure 20 South America Wedding Dress Revenue (USD Million) By Applications (2018-2022)
Figure 21 Middle East and Africa Wedding Dress Revenue (USD Million) By Region (2018-2022)
Figure 22 Middle East and Africa Wedding Dress Revenue (USD Million) By Type (2018-2022)
Figure 23 Middle East and Africa Wedding Dress Revenue (USD Million) By Applications (2018-2022)
Figure 24 Global Wedding Dress Revenue (USD Million) By Type (2023-2030)
Figure 25 Global Wedding Dress Revenue Market Share (%) By Type (2030)
Figure 26 Global Wedding Dress Revenue (USD Million) By Applications (2023-2030)
Figure 27 Global Wedding Dress Revenue Market Share (%) By Applications (2030)
Figure 28 Global Wedding Dress Market Revenue (USD Million) By Regions (2023-2030)
Figure 29 North America Wedding Dress Revenue (USD Million) By Country (2023-2030)
Figure 30 North America Wedding Dress Revenue (USD Million) By Type (2023-2030)
Figure 31 North America Wedding Dress Revenue (USD Million) By Applications (2023-2030)
Figure 32 Europe Wedding Dress Revenue (USD Million) By Country (2023-2030)
Figure 33 Europe Wedding Dress Revenue (USD Million) By Type (2023-2030)
Figure 34 Europe Wedding Dress Revenue (USD Million) By Applications (2023-2030)
Figure 35 Asia Pacific Wedding Dress Revenue (USD Million) By Country (2023-2030)
Figure 36 Asia Pacific Wedding Dress Revenue (USD Million) By Type (2023-2030)
Figure 37 Asia Pacific Wedding Dress Revenue (USD Million) By Applications (2023-2030)
Figure 38 South America Wedding Dress Revenue (USD Million) By Country (2023-2030)
Figure 39 South America Wedding Dress Revenue (USD Million) By Type (2023-2030)
Figure 40 South America Wedding Dress Revenue (USD Million) By Applications (2023-2030)
Figure 41 Middle East and Africa Wedding Dress Revenue (USD Million) By Region (2023-2030)
Figure 42 Middle East and Africa Wedding Dress Revenue (USD Million) By Region (2023-2030)
Figure 43 Middle East and Africa Wedding Dress Revenue (USD Million) By Type (2023-2030)
Figure 44 Middle East and Africa Wedding Dress Revenue (USD Million) By Applications (2023-2030)
Figure 45 Bottom-Up and Top-Down Approaches for This Report
Figure 46 Data Triangulation
