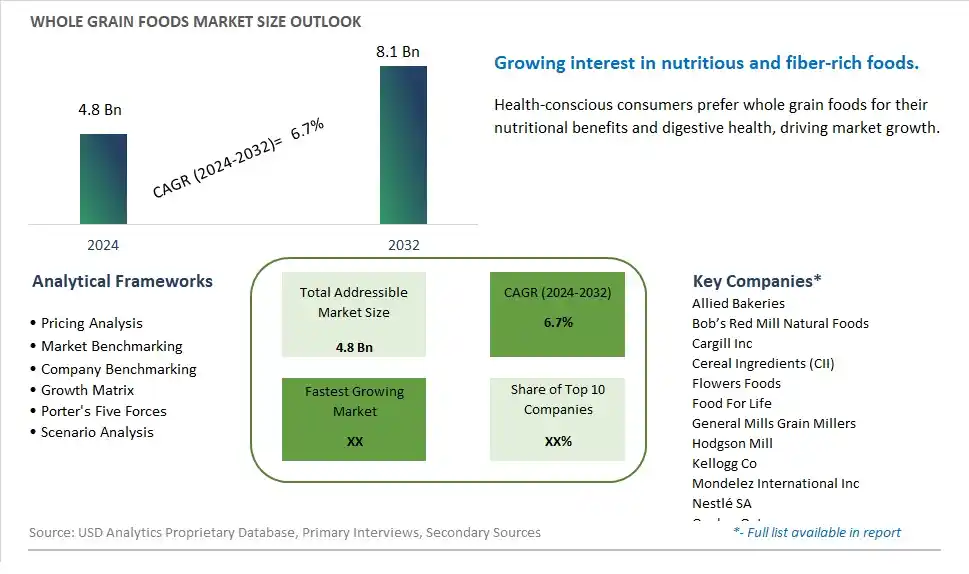
Global Whole Grain Foods Market Size is valued at $4.8 Billion in 2024 and is forecast to register a growth rate (CAGR) of 6.7% to reach $8.1 Billion by 2032.
The global Whole Grain Foods Market Comprehensive Study analyzes and forecasts the market size across 6 regions and 24 countries for diverse segments -By Application (Supermarkets/Hypermarkets, Online/E-Commerce, Independent Retail Outlets, Others), By Type (Cereals, Bakery Products, Flour, Others)
An Introduction to Whole Grain Foods Market
In 2024, the whole grain foods market is thriving, driven by a surge in health consciousness among consumers. Whole grain foods, which include products like brown rice, whole wheat bread, and oats, are celebrated for their nutritional benefits, such as high fiber content, essential vitamins, and minerals. The market is benefiting from widespread public health campaigns promoting the consumption of whole grains to combat lifestyle-related diseases. Innovations in food processing and the development of appealing whole grain-based snacks and ready-to-eat meals are attracting a broad consumer base. The increasing popularity of plant-based diets and the emphasis on clean eating are further propelling market growth. As awareness of the health benefits of whole grains continues to spread, the market is set for robust expansion, supported by ongoing product innovation and consumer education.
Whole Grain Foods Competitive Landscape
The market report analyses the leading companies in the industry including Allied Bakeries, Bob’s Red Mill Natural Foods, Cargill Inc, Cereal Ingredients (CII), Flowers Foods, Food For Life, General Mills Grain Millers, Hodgson Mill, Kellogg Co, Mondelez International Inc, Nestlé SA, Quaker Oats, and Others.
Whole Grain Foods Market Dynamics
Market Trend: Increasing Demand for Healthier Food Options
The most prominent trend in the Whole Grain Foods Market is the increasing demand for healthier food options. As consumers become more health-conscious, there is a growing preference for whole grain foods that offer higher nutritional value compared to refined grains. This trend is driven by the desire to reduce the risk of chronic diseases, improve digestion, and maintain a balanced diet
Market Driver: Rising Awareness of Nutritional Benefits
Rising awareness of the nutritional benefits of whole grains is a major driver of the Whole Grain Foods Market. Consumers are becoming more informed about the advantages of whole grains, such as higher fiber content, essential nutrients, and a lower glycemic index. This driver is encouraging the consumption of whole grain foods as part of a healthy diet, boosting the demand for products like whole grain bread, cereals, and pasta
Market Opportunity: Innovation in Whole Grain Food Products
A significant opportunity in the Whole Grain Foods Market lies in innovation in whole grain food products. Companies can develop new and appealing whole grain options, such as gluten-free whole grain products, flavored whole grain snacks, and ready-to-eat meals that cater to diverse dietary preferences. By offering a variety of innovative whole grain products, manufacturers can attract health-conscious consumers and expand their market reach
Whole Grain Foods Market Share Analysis: Supermarkets/Hypermarkets held the dominant market share in 2024
The Supermarkets/Hypermarkets segment is the largest sector within the Whole Grain Foods market, driven by several factors contributing to its widespread dominance. Supermarkets and hypermarkets offer consumers a convenient one-stop shopping experience, where they can find a wide variety of whole grain food products under a single roof. The extensive shelf space dedicated to whole grain foods in these retail outlets allows for greater visibility and accessibility, attracting a large customer base seeking healthy and nutritious options. Further, the presence of well-established brands and private-label offerings in supermarkets and hypermarkets further solidifies their position as the primary distribution channels for whole grain foods. Additionally, factors such as promotional activities, discounts, and loyalty programs implemented by supermarkets and hypermarkets enhance consumer engagement and encourage repeat purchases. As consumer awareness regarding the health benefits of whole grain foods continues to grow, coupled with the convenience and accessibility offered by supermarkets and hypermarkets, this segment is poised to maintain its leading position in the Whole Grain Foods market.
Whole Grain Foods Market Share Analysis: Bakery Products market is poised to register the fastest growth rae over the forecast period to 2032
The Bakery Products segment is the fastest-growing sector within the Whole Grain Foods market, propelled by several key factors. Firstly, the increasing consumer demand for healthier food options has led to a surge in the consumption of whole grain bakery products, driven by their perceived health benefits and nutritional value. Whole grain bakery products, such as bread, rolls, muffins, and pastries, offer consumers a convenient and palatable way to incorporate whole grains into their diets without compromising on taste or texture. Further, the growing trend of clean-label and natural ingredients in bakery products has further boosted the demand for whole grain options, as consumers seek transparency and authenticity in their food choices. Additionally, innovations in product formulations and manufacturing techniques have led to the development of a diverse range of whole grain bakery products catering to various dietary preferences and lifestyles. With the bakery industry continuously evolving to meet the changing needs and preferences of consumers, the Bakery Products segment is expected to experience sustained rapid growth in the Whole Grain Foods market.
Whole Grain Foods Market Segmentation
By Application
Supermarkets/Hypermarkets
Online/E-Commerce
Independent Retail Outlets
Others
By Type
Cereals
Bakery Products
Flour
Others
Countries Analyzed
North America (US, Canada, Mexico)
Europe (Germany, UK, France, Spain, Italy, Russia, Rest of Europe)
Asia Pacific (China, India, Japan, South Korea, Australia, South East Asia, Rest of Asia)
South America (Brazil, Argentina, Rest of South America)
Middle East and Africa (Saudi Arabia, UAE, Rest of Middle East, South Africa, Egypt, Rest of Africa)
Whole Grain Foods Companies Profiled in the Study
Allied Bakeries
Bob’s Red Mill Natural Foods
Cargill Inc
Cereal Ingredients (CII)
Flowers Foods
Food For Life
General Mills Grain Millers
Hodgson Mill
Kellogg Co
Mondelez International Inc
Nestlé SA
Quaker Oats
*- List Not Exhaustive
Chapter 1. TABLE OF CONTENTS
Chapter 2. Introduction to Whole Grain Foods Market
2.1. Market Overview
2.2. Key Statistics and Report Highlights
2.3. Scope of the Comprehensive Study
2.3.1. Market Definition
2.3.2 Countries and Regions Covered
2.3.3 Research Objective
2.3.4 Units, Currency, and Conversions
2.3.5 Industry Value Chain
2.4. Key Market Segments
2.5. Key Companies
2.6. Study Period
Chapter 3. Strategic Analysis Review
3.1. Whole Grain Foods Pricing Analysis and Forecast
3.2. Porter’s Five Forces
3.3. Market Ecosystem
3.4. SWOT Analysis
3.5. Regulatory Scenario
3.3. Effects of Inflation, Russia-Ukraine War, moderating economic growth, and other macroeconomic factors
Chapter 4. Competitive Landscape
4.1. Market Share Analysis
4.1.1. Global Whole Grain Foods Market Share by Company, 2023
4.1.2. Product Offerings of Leading Whole Grain Foods Companies
4.2. Market Entropy
4.2.1. New Product Launches in the Industry
4.2.2. Mergers, Acquisitions, Joint ventures, and Partnerships
4.3. Key Strategies and Best Practices
Chapter 5. Global Market Projections: Best, Reference, and Low Case Scenarios
5.1. Growth Analysis- Case Scenario Definitions
5.2. Low Growth Case Scenario Forecasts
5.3. Reference Growth Case Scenario Forecasts
5.4. High Growth Case Scenario Forecasts
Chapter 6. Market Dynamics
6.1. Whole Grain Foods Market Drivers
6.2. Whole Grain Foods Market Challenges
6.6. Whole Grain Foods Market Opportunities
6.4. Whole Grain Foods Market Trends
Chapter 7. Global Whole Grain Foods Market Outlook Trends
7.1. Global Whole Grain Foods Revenue (USD Million) and CAGR (%) by Type (2021-2032)
7.2. Global Whole Grain Foods Revenue (USD Million) and CAGR (%) by Application (2021-2032)
7.3. Global Whole Grain Foods Revenue (USD Million) and CAGR (%) by Product (2021-2032)
By Application
Supermarkets/Hypermarkets
Online/E-Commerce
Independent Retail Outlets
Others
By Type
Cereals
Bakery Products
Flour
Others
Chapter 8. Global Whole Grain Foods Regional Analysis and Outlook
8.1. Global Whole Grain Foods Revenue (USD Million) By Regions (2021- 2032)
8.2. North America Whole Grain Foods Revenue (USD Million) by Country (2021-2032)
8.2.1. United States Whole Grain Foods Regional Analysis and Outlook
8.2.2. Canada Whole Grain Foods Regional Analysis and Outlook
8.2.3. Mexico Whole Grain Foods Regional Analysis and Outlook
8.3. Europe Whole Grain Foods Revenue (USD Million), by Country (2021-2032)
8.3.1. Germany Whole Grain Foods Regional Analysis and Outlook
8.3.2. France Whole Grain Foods Regional Analysis and Outlook
8.3.3. United Kingdom Whole Grain Foods Regional Analysis and Outlook
8.3.4. Spain Whole Grain Foods Regional Analysis and Outlook
8.3.5. Italy Whole Grain Foods Regional Analysis and Outlook
8.3.6. Russia Whole Grain Foods Regional Analysis and Outlook
8.3.7. Rest of Europe Whole Grain Foods Regional Analysis and Outlook
8.4. Asia Pacific Whole Grain Foods Revenue (USD Million) by Country (2021-2032)
8.4.1. China Whole Grain Foods Regional Analysis and Outlook
8.4.2. Japan Whole Grain Foods Regional Analysis and Outlook
8.4.3. India Whole Grain Foods Regional Analysis and Outlook
8.4.4. South Korea Whole Grain Foods Regional Analysis and Outlook
8.4.5. Australia Whole Grain Foods Regional Analysis and Outlook
8.4.6. South East Asia Whole Grain Foods Regional Analysis and Outlook
8.4.7. Rest of Asia Pacific Whole Grain Foods Regional Analysis and Outlook
8.5. South America Whole Grain Foods Revenue (USD Million), by Country (2021-2032)
8.5.1. Brazil Whole Grain Foods Regional Analysis and Outlook
8.5.2. Argentina Whole Grain Foods Regional Analysis and Outlook
8.5.3. Rest of South America Whole Grain Foods Regional Analysis and Outlook
8.6. Middle East and Africa Whole Grain Foods Revenue (USD Million) by Country (2021-2032)
8.6.1. Middle East Whole Grain Foods Regional Analysis and Outlook
8.6.2. Africa Whole Grain Foods Regional Analysis and Outlook
Chapter 9. North America Whole Grain Foods Analysis and Outlook
9.1. North America Whole Grain Foods Revenue (USD Million) by Segments (2021-2032)
9.1.1. North America Whole Grain Foods Revenue (USD Million) by Type (2021-2032)
9.1.2. North America Whole Grain Foods Revenue (USD Million) by Application (2021-2032)
9.1.3. North America Whole Grain Foods Revenue (USD Million) by Product (2021-2032)
By Application
Supermarkets/Hypermarkets
Online/E-Commerce
Independent Retail Outlets
Others
By Type
Cereals
Bakery Products
Flour
Others
Chapter 10. Europe Whole Grain Foods Analysis and Outlook
10.1. Europe Whole Grain Foods Revenue (USD Million), by Segments (USD Million) (2021-2032)
10.1.1. Europe Whole Grain Foods Revenue (USD Million) by Type (2021-2032)
10.1.2. Europe Whole Grain Foods Revenue (USD Million) by Application (2021-2032)
10.1.3. Europe Whole Grain Foods Revenue (USD Million) by Product (2021-2032)
By Application
Supermarkets/Hypermarkets
Online/E-Commerce
Independent Retail Outlets
Others
By Type
Cereals
Bakery Products
Flour
Others
Chapter 11. Asia Pacific Whole Grain Foods Analysis and Outlook
11.1. Asia Pacific Whole Grain Foods Revenue (USD Million), and Revenue (USD Million) by Segments (2021-2032)
11.1.1. Asia Pacific Whole Grain Foods Revenue (USD Million) by Type (2021-2032)
11.1.2. Asia Pacific Whole Grain Foods Revenue (USD Million) by Application (2021-2032)
11.1.3. Asia Pacific Whole Grain Foods Revenue (USD Million) by Product (2021-2032)
By Application
Supermarkets/Hypermarkets
Online/E-Commerce
Independent Retail Outlets
Others
By Type
Cereals
Bakery Products
Flour
Others
Chapter 12. South America Whole Grain Foods Analysis and Outlook
12.1. South America Whole Grain Foods Revenue (USD Million), by Segments (2021-2032)
12.1.1. South America Whole Grain Foods Revenue (USD Million) by Type (2021-2032)
12.1.2. South America Whole Grain Foods Revenue (USD Million) by Application (2021-2032)
12.1.3. South America Whole Grain Foods Revenue (USD Million) by Product (2021-2032)
By Application
Supermarkets/Hypermarkets
Online/E-Commerce
Independent Retail Outlets
Others
By Type
Cereals
Bakery Products
Flour
Others
Chapter 13. Middle East and Africa Whole Grain Foods Analysis and Outlook
13.1. Middle East and Africa Whole Grain Foods Revenue (USD Million), by Segments (2021-2032)
13.1.1. Middle East and Africa Whole Grain Foods Revenue (USD Million) by Type (2021-2032)
13.1.2. Middle East and Africa Whole Grain Foods Revenue (USD Million) by Application (2021-2032)
13.1.3. Middle East and Africa Whole Grain Foods Revenue (USD Million) by Product (2021-2032)
By Application
Supermarkets/Hypermarkets
Online/E-Commerce
Independent Retail Outlets
Others
By Type
Cereals
Bakery Products
Flour
Others
Chapter 14. Whole Grain Foods Company Profiles
14.1 Business Overview
14.2 Product Profiles
14.3 SWOT Profiles
14.5 Recent Developments
14.6 Financial Profile
List of Companies
Allied Bakeries
Bob’s Red Mill Natural Foods
Cargill Inc
Cereal Ingredients (CII)
Flowers Foods
Food For Life
General Mills Grain Millers
Hodgson Mill
Kellogg Co
Mondelez International Inc
Nestlé SA
Quaker Oats
15. Methodology and Data Sources
15.1 Customization Offerings
15.2 Subscription Services
15.3 Related Reports
15.4 Publisher Expertise
LIST OF TABLES
Table 1 Market Segmentation Analysis
Table 2 Global Whole Grain Foods Market Share of Leading Companies, 2023
Table 3 Product Offerings of Leading Companies
Table 4 Low Growth Scenario Forecasts
Table 5 Reference Case Growth Scenario
Table 6 High Growth Case Scenario
Table 7 Global Whole Grain Foods Revenue (USD Million) And CAGR (%) By Type (2021-2032)
Table 8 Global Whole Grain Foods Revenue (USD Million) And CAGR (%) By Application (2021-2032)
Table 9 Global Whole Grain Foods Revenue (USD Million) And CAGR (%) By Product (2021-2032)
Table 10 Global Whole Grain Foods Market Revenue (USD Million) By Regions (2021-2032)
Table 11 Global Whole Grain Foods Market Share (%) By Regions (2021-2032)
Table 12 North America Whole Grain Foods Revenue (USD Million) By Country (2021-2032)
Table 13 Europe Whole Grain Foods Revenue (USD Million) By Country (2021-2032)
Table 14 Asia Pacific Whole Grain Foods Revenue (USD Million) By Country (2021-2032)
Table 15 South America Whole Grain Foods Revenue (USD Million) By Country (2021-2032)
Table 16 Middle East and Africa Whole Grain Foods Revenue (USD Million) By Region (2021-2032)
Table 17 North America Whole Grain Foods Revenue (USD Million) By Type (2021-2032)
Table 18 North America Whole Grain Foods Revenue (USD Million) By Application (2021-2032)
Table 19 North America Whole Grain Foods Revenue (USD Million) By Product (2021-2032)
Table 20 Europe Whole Grain Foods Revenue (USD Million) By Type (2021-2032)
Table 21 Europe Whole Grain Foods Revenue (USD Million) By Application (2021-2032)
Table 22 Europe Whole Grain Foods Revenue (USD Million) By Product (2021-2032)
Table 23 Asia Pacific Whole Grain Foods Revenue (USD Million) By Type (2021-2032)
Table 24 Asia Pacific Whole Grain Foods Revenue (USD Million) By Application (2021-2032)
Table 25 Asia Pacific Whole Grain Foods Revenue (USD Million) By Product (2021-2032)
Table 26 South America Whole Grain Foods Revenue (USD Million) By Type (2021-2032)
Table 27 South America Whole Grain Foods Revenue (USD Million) By Application (2021-2032)
Table 28 South America Whole Grain Foods Revenue (USD Million) By Product (2021-2032)
Table 29 Middle East and Africa Whole Grain Foods Revenue (USD Million) By Type (2021-2032)
Table 30 Middle East and Africa Whole Grain Foods Revenue (USD Million) By Application (2021-2032)
Table 31 Middle East and Africa Whole Grain Foods Revenue (USD Million) By Product (2021-2032)
LIST OF FIGURES
Figure 1. Market Scope
Figure 2. Pricing Forecasts Per Unit, 2023- 2032
Figure 3. Porter’s Five Forces
Figure 4. Global Whole Grain Foods Market Revenue (USD Million) By Regions (2021-2032)
Figure 5. Global Whole Grain Foods Market Share (%) By Regions (2023)
Figure 6. North America Whole Grain Foods Revenue (USD Million) By Country (2021-2032)
Figure 7. United States Whole Grain Foods Revenue (USD Million) By Country (2021-2032)
Figure 8. Canada Whole Grain Foods Revenue (USD Million) By Country (2021-2032)
Figure 9. Mexico Whole Grain Foods Revenue (USD Million) By Country (2021-2032)
Figure 10. Europe Whole Grain Foods Revenue (USD Million) By Country (2021-2032)
Figure 11. Germany Whole Grain Foods Revenue (USD Million) By Country (2021-2032)
Figure 12. France Whole Grain Foods Revenue (USD Million) By Country (2021-2032)
Figure 13. United Kingdom Whole Grain Foods Revenue (USD Million) By Country (2021-2032)
Figure 14. Spain Whole Grain Foods Revenue (USD Million) By Country (2021-2032)
Figure 15. Italy Whole Grain Foods Revenue (USD Million) By Country (2021-2032)
Figure 16. Russia Whole Grain Foods Revenue (USD Million) By Country (2021-2032)
Figure 17. Rest of Europe Whole Grain Foods Revenue (USD Million) By Country (2021-2032)
Figure 11. Asia Pacific Whole Grain Foods Revenue (USD Million) By Country (2021-2032)
Figure 12. China Whole Grain Foods Revenue (USD Million) By Country (2021-2032)
Figure 13. Japan Whole Grain Foods Revenue (USD Million) By Country (2021-2032)
Figure 14. India Whole Grain Foods Revenue (USD Million) By Country (2021-2032)
Figure 15. South Korea Whole Grain Foods Revenue (USD Million) By Country (2021-2032)
Figure 16. Australia Whole Grain Foods Revenue (USD Million) By Country (2021-2032)
Figure 17. South East Asia Whole Grain Foods Revenue (USD Million) By Country (2021-2032)
Figure 18. South America Whole Grain Foods Revenue (USD Million) By Country (2021-2032)
Figure 19. Brazil Whole Grain Foods Revenue (USD Million) By Country (2021-2032)
Figure 20. Argentina Whole Grain Foods Revenue (USD Million) By Country (2021-2032)
Figure 21. Rest of Asia Pacific Whole Grain Foods Revenue (USD Million) By Country (2021-2032)
Figure 22. Middle East and Africa Whole Grain Foods Revenue (USD Million) By Region (2021-2032)
Figure 23. Saudi Arabia Whole Grain Foods Revenue (USD Million) By Region (2021-2032)
Figure 24. The UAE Whole Grain Foods Revenue (USD Million) By Region (2021-2032)
Figure 25. Rest of Middle East Whole Grain Foods Revenue (USD Million) By Region (2021-2032)
Figure 26. South Africa Whole Grain Foods Revenue (USD Million) By Region (2021-2032)
Figure 27. Africa Whole Grain Foods Revenue (USD Million) By Region (2021-2032)
Figure 28. North America Whole Grain Foods Revenue (USD Million) By Type (2021-2032)
Figure 29. North America Whole Grain Foods Revenue (USD Million) By Application (2021-2032)
Figure 30. North America Whole Grain Foods Revenue (USD Million) By Product (2021-2032)
Figure 31. Europe Whole Grain Foods Revenue (USD Million) By Type (2021-2032)
Figure 32. Europe Whole Grain Foods Revenue (USD Million) By Application (2021-2032)
Figure 33. Europe Whole Grain Foods Revenue (USD Million) By Product (2021-2032)
Figure 34. Asia Pacific Whole Grain Foods Revenue (USD Million) By Type (2021-2032)
Figure 35. Asia Pacific Whole Grain Foods Revenue (USD Million) By Application (2021-2032)
Figure 36. Asia Pacific Whole Grain Foods Revenue (USD Million) By Product (2021-2032)
Figure 37. South America Whole Grain Foods Revenue (USD Million) By Type (2021-2032)
Figure 38. South America Whole Grain Foods Revenue (USD Million) By Application (2021-2032)
Figure 39. South America Whole Grain Foods Revenue (USD Million) By Product (2021-2032)
Figure 40. Middle East and Africa Whole Grain Foods Revenue (USD Million) By Type (2021-2032)
Figure 41. Middle East and Africa Whole Grain Foods Revenue (USD Million) By Application (2021-2032)
Figure 42. Middle East and Africa Whole Grain Foods Revenue (USD Million) By Product (2021-2032)
By Application
Supermarkets/Hypermarkets
Online/E-Commerce
Independent Retail Outlets
Others
By Type
Cereals
Bakery Products
Flour
Others
Countries Analyzed
North America (US, Canada, Mexico)
Europe (Germany, UK, France, Spain, Italy, Russia, Rest of Europe)
Asia Pacific (China, India, Japan, South Korea, Australia, South East Asia, Rest of Asia)
South America (Brazil, Argentina, Rest of South America)
Middle East and Africa (Saudi Arabia, UAE, Rest of Middle East, South Africa, Egypt, Rest of Africa)
