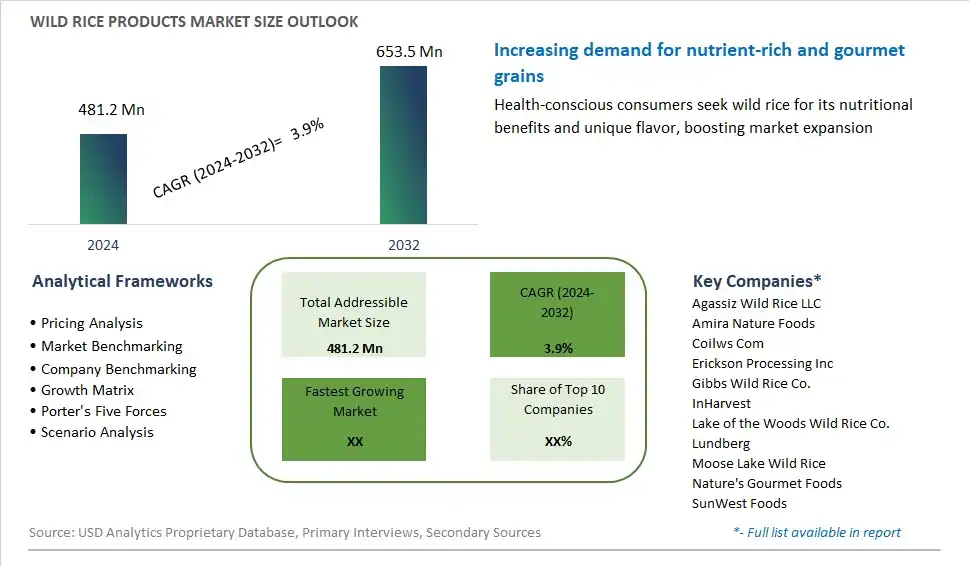
Global Wild Rice Products Market Size is valued at $481.2 Million in 2024 and is forecast to register a growth rate (CAGR) of 3.9% to reach $653.5 Million by 2032.
The global Wild Rice Products Market Comprehensive Study analyzes and forecasts the market size across 6 regions and 24 countries for diverse segments -By Product (Raw Wild Rice, Processed Wild Rice, Wild Rice Blends), By End-User (Retail/Consumer Products, Foodservice, Industrial/Ingredient Use), By Distribution Channel (Online, Supermarkets/Hypermarkets, Specialty Stores, Foodservice Distributors, Others)
An Introduction to Wild Rice Products Market
Wild rice, a nutritious whole grain harvested from aquatic grasses native to North America, is gaining popularity as a versatile and flavorful ingredient in culinary and food products. In 2024, the market for wild rice products is expanding as consumers seek out healthier and more exotic alternatives to traditional grains and starches. Rich in fiber, protein, vitamins, and minerals, wild rice offers numerous health benefits, including improved digestion, heart health, and weight management. This market segment encompasses a diverse range of wild rice products, including whole grains, flour, pasta, snacks, and ready-to-eat meals, catering to different dietary preferences and culinary applications. Manufacturers are innovating with creative formulations and flavor combinations to incorporate wild rice into a variety of food products, ranging from salads and pilafs to soups and desserts, appealing to health-conscious consumers seeking nutritious and flavorful meal solutions. Moreover, the market is witnessing growing interest in sustainable and organic wild rice products sourced from environmentally responsible cultivation practices, driving demand for premium and artisanal offerings in the wild rice market.
Wild Rice Products Competitive Landscape
The market report analyses the leading companies in the industry including Agassiz Wild Rice LLC, Amira Nature Foods, Coilws Com, Erickson Processing Inc, Gibbs Wild Rice Co., InHarvest, Lake of the Woods Wild Rice Co., Lundberg, Moose Lake Wild Rice, Nature's Gourmet Foods, SunWest Foods, and Others.
Wild Rice Products Market Dynamics
Wild Rice Products Market Trend: Growing Demand for Gluten-Free and Whole Grain Foods
A significant trend in the wild rice products market is the growing demand for gluten-free and whole grain foods. As more consumers become health-conscious and seek out nutritious dietary options, there is a shift towards gluten-free alternatives and whole grains like wild rice. This trend is driven by increased awareness of gluten intolerance, celiac disease, and the health benefits of whole grains, including their high fiber content, essential nutrients, and potential role in managing weight and preventing chronic diseases. As a result, there is a rising demand for a variety of wild rice products, including packaged wild rice blends, flour, snacks, and ready-to-eat meals, catering to diverse consumer preferences and culinary needs.
Market Driver: Expansion of Ethnic and Gourmet Food Markets
A key driver shaping the wild rice products market is the expansion of ethnic and gourmet food markets. Wild rice, a traditional staple in indigenous cuisines and gourmet culinary circles, is gaining popularity among mainstream consumers seeking unique and exotic ingredients. The increasing diversity of food choices and multicultural influences in the culinary landscape drive the demand for wild rice products, both domestically and internationally. Additionally, the growing interest in plant-based diets and vegetarian/vegan lifestyles further fuels the market for wild rice as a versatile and nutrient-rich ingredient in a wide range of cuisines, from soups and salads to pilafs and desserts.
Market Opportunity: Diversification and Innovation in Wild Rice-Based Products
An opportunity lies in the diversification and innovation of wild rice-based products to meet the evolving needs and preferences of consumers. Manufacturers can capitalize on the rising demand for healthy and flavorful foods by expanding their product lines to include a variety of innovative wild rice-based offerings. This includes ready-to-cook meal kits, snack bars, breakfast cereals, and frozen entrees featuring wild rice as a primary ingredient. Furthermore, there is potential for value-added products such as organic, heirloom, or sustainably sourced wild rice varieties, appealing to consumers seeking premium quality and ethical sourcing practices. By tapping into emerging food trends and culinary innovations, companies can differentiate their brands and capture market share in the expanding wild rice products market.
Wild Rice Products Market Share Analysis: Processed Wild Rice held the dominant market share in 2024
In the Wild Rice Products Market, the Processed Wild Rice segment stands as the largest. This dominance is primarily attributed to the convenience and versatility offered by processed wild rice products, which have undergone cleaning, parboiling, and/or milling processes to enhance their shelf-life, texture, and cooking characteristics. Processed wild rice retains the nutty flavor and distinctive texture of raw wild rice while offering shorter cooking times and easier preparation, making it more accessible to consumers seeking convenience without compromising on taste or quality. Additionally, processed wild rice is widely utilized in a variety of culinary applications, including salads, soups, side dishes, and main courses, further driving its demand among consumers and foodservice establishments. Further, the availability of processed wild rice blends, combining wild rice with other grains or ingredients, caters to diverse consumer preferences and culinary trends, contributing to the segment's market dominance. Furthermore, the growing awareness of the nutritional benefits and culinary versatility of wild rice fuels the demand for processed wild rice products, sustaining its position as the largest segment in the Wild Rice Products Market.
Wild Rice Products Market Share Analysis: Foodservice market is poised to register the fastest growth rae over the forecast period to 2032
In the Wild Rice Products Market, the Foodservice segment is the fastest-growing. This surge is propelled by several factors. Firstly, the rising demand for healthier and more diverse menu options in the foodservice industry has led to increased interest in incorporating wild rice into restaurant menus, catering services, and culinary operations. Wild rice's unique nutty flavor, chewy texture, and nutritional benefits make it an appealing ingredient for chefs and foodservice professionals looking to offer innovative and nutritious dishes to their customers. Further, the growing popularity of plant-based and gluten-free diets has elevated the demand for alternative grains like wild rice, which is naturally gluten-free and rich in fiber, protein, and essential nutrients. Additionally, the versatility of wild rice allows for its incorporation into a wide range of foodservice offerings, including salads, pilafs, bowls, soups, and entrées, catering to diverse culinary preferences and dietary requirements. Furthermore, the expansion of the foodservice sector, driven by factors such as urbanization, changing consumer lifestyles, and the growth of the hospitality industry, creates opportunities for wild rice products to gain traction in commercial kitchens and dining establishments. As a result, the Foodservice segment presents significant growth prospects in the Wild Rice Products Market, driven by the increasing demand for innovative and health-conscious menu offerings in the foodservice industry.
Wild Rice Products Market Share Analysis: Supermarkets/Hypermarkets held the dominant market share in 2024
In the Wild Rice Products Market, the Supermarkets/Hypermarkets segment is the largest. This dominance is primarily attributed to the widespread availability and accessibility of wild rice products in supermarkets and hypermarkets, which serve as key retail channels for consumers to purchase groceries and food items. Supermarkets and hypermarkets offer a diverse range of wild rice products, including raw wild rice, processed wild rice, and wild rice blends, catering to the varying preferences and dietary needs of consumers. Further, these retail outlets typically feature dedicated sections or aisles for rice and grains, providing prominent visibility and shelf space for wild rice products, which enhances consumer awareness and encourages purchase. Additionally, supermarkets and hypermarkets benefit from economies of scale, enabling them to leverage bulk purchasing and distribution networks to offer competitive pricing and promotional deals on wild rice products, further attracting consumers. Furthermore, the convenience of one-stop shopping, extended operating hours, and ample parking facilities offered by supermarkets and hypermarkets contributes to their popularity among consumers seeking convenience and variety in their shopping experience. As a result, the Supermarkets/Hypermarkets segment maintains its position as the largest distribution channel in the Wild Rice Products Market, offering a convenient and accessible avenue for consumers to purchase wild rice products for their culinary needs.
Wild Rice Products Market Segmentation
By Product
Raw Wild Rice
Processed Wild Rice
Wild Rice Blends
By End-User
Retail/Consumer Products
Foodservice
Industrial/Ingredient Use
By Distribution Channel
Online
Supermarkets/Hypermarkets
Specialty Stores
Foodservice Distributors
Others
Countries Analyzed
North America (US, Canada, Mexico)
Europe (Germany, UK, France, Spain, Italy, Russia, Rest of Europe)
Asia Pacific (China, India, Japan, South Korea, Australia, South East Asia, Rest of Asia)
South America (Brazil, Argentina, Rest of South America)
Middle East and Africa (Saudi Arabia, UAE, Rest of Middle East, South Africa, Egypt, Rest of Africa)
Wild Rice Products Companies Profiled in the Study
Agassiz Wild Rice LLC
Amira Nature Foods
Coilws Com
Erickson Processing Inc
Gibbs Wild Rice Co.
InHarvest
Lake of the Woods Wild Rice Co.
Lundberg
Moose Lake Wild Rice
Nature's Gourmet Foods
SunWest Foods
*- List Not Exhaustive
Chapter 1. TABLE OF CONTENTS
Chapter 2. Introduction to Wild Rice Products Market
2.1. Market Overview
2.2. Key Statistics and Report Highlights
2.3. Scope of the Comprehensive Study
2.3.1. Market Definition
2.3.2 Countries and Regions Covered
2.3.3 Research Objective
2.3.4 Units, Currency, and Conversions
2.3.5 Industry Value Chain
2.4. Key Market Segments
2.5. Key Companies
2.6. Study Period
Chapter 3. Strategic Analysis Review
3.1. Wild Rice Products Pricing Analysis and Forecast
3.2. Porter’s Five Forces
3.3. Market Ecosystem
3.4. SWOT Analysis
3.5. Regulatory Scenario
3.3. Effects of Inflation, Russia-Ukraine War, moderating economic growth, and other macroeconomic factors
Chapter 4. Competitive Landscape
4.1. Market Share Analysis
4.1.1. Global Wild Rice Products Market Share by Company, 2023
4.1.2. Product Offerings of Leading Wild Rice Products Companies
4.2. Market Entropy
4.2.1. New Product Launches in the Industry
4.2.2. Mergers, Acquisitions, Joint ventures, and Partnerships
4.3. Key Strategies and Best Practices
Chapter 5. Global Market Projections: Best, Reference, and Low Case Scenarios
5.1. Growth Analysis- Case Scenario Definitions
5.2. Low Growth Case Scenario Forecasts
5.3. Reference Growth Case Scenario Forecasts
5.4. High Growth Case Scenario Forecasts
Chapter 6. Market Dynamics
6.1. Wild Rice Products Market Drivers
6.2. Wild Rice Products Market Challenges
6.6. Wild Rice Products Market Opportunities
6.4. Wild Rice Products Market Trends
Chapter 7. Global Wild Rice Products Market Outlook Trends
7.1. Global Wild Rice Products Revenue (USD Million) and CAGR (%) by Type (2021-2032)
7.2. Global Wild Rice Products Revenue (USD Million) and CAGR (%) by Application (2021-2032)
7.3. Global Wild Rice Products Revenue (USD Million) and CAGR (%) by Product (2021-2032)
By Product
Raw Wild Rice
Processed Wild Rice
Wild Rice Blends
By End-User
Retail/Consumer Products
Foodservice
Industrial/Ingredient Use
By Distribution Channel
Online
Supermarkets/Hypermarkets
Specialty Stores
Foodservice Distributors
Others
Chapter 8. Global Wild Rice Products Regional Analysis and Outlook
8.1. Global Wild Rice Products Revenue (USD Million) By Regions (2021- 2032)
8.2. North America Wild Rice Products Revenue (USD Million) by Country (2021-2032)
8.2.1. United States Wild Rice Products Regional Analysis and Outlook
8.2.2. Canada Wild Rice Products Regional Analysis and Outlook
8.2.3. Mexico Wild Rice Products Regional Analysis and Outlook
8.3. Europe Wild Rice Products Revenue (USD Million), by Country (2021-2032)
8.3.1. Germany Wild Rice Products Regional Analysis and Outlook
8.3.2. France Wild Rice Products Regional Analysis and Outlook
8.3.3. United Kingdom Wild Rice Products Regional Analysis and Outlook
8.3.4. Spain Wild Rice Products Regional Analysis and Outlook
8.3.5. Italy Wild Rice Products Regional Analysis and Outlook
8.3.6. Russia Wild Rice Products Regional Analysis and Outlook
8.3.7. Rest of Europe Wild Rice Products Regional Analysis and Outlook
8.4. Asia Pacific Wild Rice Products Revenue (USD Million) by Country (2021-2032)
8.4.1. China Wild Rice Products Regional Analysis and Outlook
8.4.2. Japan Wild Rice Products Regional Analysis and Outlook
8.4.3. India Wild Rice Products Regional Analysis and Outlook
8.4.4. South Korea Wild Rice Products Regional Analysis and Outlook
8.4.5. Australia Wild Rice Products Regional Analysis and Outlook
8.4.6. South East Asia Wild Rice Products Regional Analysis and Outlook
8.4.7. Rest of Asia Pacific Wild Rice Products Regional Analysis and Outlook
8.5. South America Wild Rice Products Revenue (USD Million), by Country (2021-2032)
8.5.1. Brazil Wild Rice Products Regional Analysis and Outlook
8.5.2. Argentina Wild Rice Products Regional Analysis and Outlook
8.5.3. Rest of South America Wild Rice Products Regional Analysis and Outlook
8.6. Middle East and Africa Wild Rice Products Revenue (USD Million) by Country (2021-2032)
8.6.1. Middle East Wild Rice Products Regional Analysis and Outlook
8.6.2. Africa Wild Rice Products Regional Analysis and Outlook
Chapter 9. North America Wild Rice Products Analysis and Outlook
9.1. North America Wild Rice Products Revenue (USD Million) by Segments (2021-2032)
9.1.1. North America Wild Rice Products Revenue (USD Million) by Type (2021-2032)
9.1.2. North America Wild Rice Products Revenue (USD Million) by Application (2021-2032)
9.1.3. North America Wild Rice Products Revenue (USD Million) by Product (2021-2032)
By Product
Raw Wild Rice
Processed Wild Rice
Wild Rice Blends
By End-User
Retail/Consumer Products
Foodservice
Industrial/Ingredient Use
By Distribution Channel
Online
Supermarkets/Hypermarkets
Specialty Stores
Foodservice Distributors
Others
Chapter 10. Europe Wild Rice Products Analysis and Outlook
10.1. Europe Wild Rice Products Revenue (USD Million), by Segments (USD Million) (2021-2032)
10.1.1. Europe Wild Rice Products Revenue (USD Million) by Type (2021-2032)
10.1.2. Europe Wild Rice Products Revenue (USD Million) by Application (2021-2032)
10.1.3. Europe Wild Rice Products Revenue (USD Million) by Product (2021-2032)
By Product
Raw Wild Rice
Processed Wild Rice
Wild Rice Blends
By End-User
Retail/Consumer Products
Foodservice
Industrial/Ingredient Use
By Distribution Channel
Online
Supermarkets/Hypermarkets
Specialty Stores
Foodservice Distributors
Others
Chapter 11. Asia Pacific Wild Rice Products Analysis and Outlook
11.1. Asia Pacific Wild Rice Products Revenue (USD Million), and Revenue (USD Million) by Segments (2021-2032)
11.1.1. Asia Pacific Wild Rice Products Revenue (USD Million) by Type (2021-2032)
11.1.2. Asia Pacific Wild Rice Products Revenue (USD Million) by Application (2021-2032)
11.1.3. Asia Pacific Wild Rice Products Revenue (USD Million) by Product (2021-2032)
By Product
Raw Wild Rice
Processed Wild Rice
Wild Rice Blends
By End-User
Retail/Consumer Products
Foodservice
Industrial/Ingredient Use
By Distribution Channel
Online
Supermarkets/Hypermarkets
Specialty Stores
Foodservice Distributors
Others
Chapter 12. South America Wild Rice Products Analysis and Outlook
12.1. South America Wild Rice Products Revenue (USD Million), by Segments (2021-2032)
12.1.1. South America Wild Rice Products Revenue (USD Million) by Type (2021-2032)
12.1.2. South America Wild Rice Products Revenue (USD Million) by Application (2021-2032)
12.1.3. South America Wild Rice Products Revenue (USD Million) by Product (2021-2032)
By Product
Raw Wild Rice
Processed Wild Rice
Wild Rice Blends
By End-User
Retail/Consumer Products
Foodservice
Industrial/Ingredient Use
By Distribution Channel
Online
Supermarkets/Hypermarkets
Specialty Stores
Foodservice Distributors
Others
Chapter 13. Middle East and Africa Wild Rice Products Analysis and Outlook
13.1. Middle East and Africa Wild Rice Products Revenue (USD Million), by Segments (2021-2032)
13.1.1. Middle East and Africa Wild Rice Products Revenue (USD Million) by Type (2021-2032)
13.1.2. Middle East and Africa Wild Rice Products Revenue (USD Million) by Application (2021-2032)
13.1.3. Middle East and Africa Wild Rice Products Revenue (USD Million) by Product (2021-2032)
By Product
Raw Wild Rice
Processed Wild Rice
Wild Rice Blends
By End-User
Retail/Consumer Products
Foodservice
Industrial/Ingredient Use
By Distribution Channel
Online
Supermarkets/Hypermarkets
Specialty Stores
Foodservice Distributors
Others
Chapter 14. Wild Rice Products Company Profiles
14.1 Business Overview
14.2 Product Profiles
14.3 SWOT Profiles
14.5 Recent Developments
14.6 Financial Profile
List of Companies
Agassiz Wild Rice LLC
Amira Nature Foods
Coilws Com
Erickson Processing Inc
Gibbs Wild Rice Co.
InHarvest
Lake of the Woods Wild Rice Co.
Lundberg
Moose Lake Wild Rice
Nature's Gourmet Foods
SunWest Foods
15. Methodology and Data Sources
15.1 Customization Offerings
15.2 Subscription Services
15.3 Related Reports
15.4 Publisher Expertise
LIST OF TABLES
Table 1 Market Segmentation Analysis
Table 2 Global Wild Rice Products Market Share of Leading Companies, 2023
Table 3 Product Offerings of Leading Companies
Table 4 Low Growth Scenario Forecasts
Table 5 Reference Case Growth Scenario
Table 6 High Growth Case Scenario
Table 7 Global Wild Rice Products Revenue (USD Million) And CAGR (%) By Type (2021-2032)
Table 8 Global Wild Rice Products Revenue (USD Million) And CAGR (%) By Application (2021-2032)
Table 9 Global Wild Rice Products Revenue (USD Million) And CAGR (%) By Product (2021-2032)
Table 10 Global Wild Rice Products Market Revenue (USD Million) By Regions (2021-2032)
Table 11 Global Wild Rice Products Market Share (%) By Regions (2021-2032)
Table 12 North America Wild Rice Products Revenue (USD Million) By Country (2021-2032)
Table 13 Europe Wild Rice Products Revenue (USD Million) By Country (2021-2032)
Table 14 Asia Pacific Wild Rice Products Revenue (USD Million) By Country (2021-2032)
Table 15 South America Wild Rice Products Revenue (USD Million) By Country (2021-2032)
Table 16 Middle East and Africa Wild Rice Products Revenue (USD Million) By Region (2021-2032)
Table 17 North America Wild Rice Products Revenue (USD Million) By Type (2021-2032)
Table 18 North America Wild Rice Products Revenue (USD Million) By Application (2021-2032)
Table 19 North America Wild Rice Products Revenue (USD Million) By Product (2021-2032)
Table 20 Europe Wild Rice Products Revenue (USD Million) By Type (2021-2032)
Table 21 Europe Wild Rice Products Revenue (USD Million) By Application (2021-2032)
Table 22 Europe Wild Rice Products Revenue (USD Million) By Product (2021-2032)
Table 23 Asia Pacific Wild Rice Products Revenue (USD Million) By Type (2021-2032)
Table 24 Asia Pacific Wild Rice Products Revenue (USD Million) By Application (2021-2032)
Table 25 Asia Pacific Wild Rice Products Revenue (USD Million) By Product (2021-2032)
Table 26 South America Wild Rice Products Revenue (USD Million) By Type (2021-2032)
Table 27 South America Wild Rice Products Revenue (USD Million) By Application (2021-2032)
Table 28 South America Wild Rice Products Revenue (USD Million) By Product (2021-2032)
Table 29 Middle East and Africa Wild Rice Products Revenue (USD Million) By Type (2021-2032)
Table 30 Middle East and Africa Wild Rice Products Revenue (USD Million) By Application (2021-2032)
Table 31 Middle East and Africa Wild Rice Products Revenue (USD Million) By Product (2021-2032)
LIST OF FIGURES
Figure 1. Market Scope
Figure 2. Pricing Forecasts Per Unit, 2023- 2032
Figure 3. Porter’s Five Forces
Figure 4. Global Wild Rice Products Market Revenue (USD Million) By Regions (2021-2032)
Figure 5. Global Wild Rice Products Market Share (%) By Regions (2023)
Figure 6. North America Wild Rice Products Revenue (USD Million) By Country (2021-2032)
Figure 7. United States Wild Rice Products Revenue (USD Million) By Country (2021-2032)
Figure 8. Canada Wild Rice Products Revenue (USD Million) By Country (2021-2032)
Figure 9. Mexico Wild Rice Products Revenue (USD Million) By Country (2021-2032)
Figure 10. Europe Wild Rice Products Revenue (USD Million) By Country (2021-2032)
Figure 11. Germany Wild Rice Products Revenue (USD Million) By Country (2021-2032)
Figure 12. France Wild Rice Products Revenue (USD Million) By Country (2021-2032)
Figure 13. United Kingdom Wild Rice Products Revenue (USD Million) By Country (2021-2032)
Figure 14. Spain Wild Rice Products Revenue (USD Million) By Country (2021-2032)
Figure 15. Italy Wild Rice Products Revenue (USD Million) By Country (2021-2032)
Figure 16. Russia Wild Rice Products Revenue (USD Million) By Country (2021-2032)
Figure 17. Rest of Europe Wild Rice Products Revenue (USD Million) By Country (2021-2032)
Figure 11. Asia Pacific Wild Rice Products Revenue (USD Million) By Country (2021-2032)
Figure 12. China Wild Rice Products Revenue (USD Million) By Country (2021-2032)
Figure 13. Japan Wild Rice Products Revenue (USD Million) By Country (2021-2032)
Figure 14. India Wild Rice Products Revenue (USD Million) By Country (2021-2032)
Figure 15. South Korea Wild Rice Products Revenue (USD Million) By Country (2021-2032)
Figure 16. Australia Wild Rice Products Revenue (USD Million) By Country (2021-2032)
Figure 17. South East Asia Wild Rice Products Revenue (USD Million) By Country (2021-2032)
Figure 18. South America Wild Rice Products Revenue (USD Million) By Country (2021-2032)
Figure 19. Brazil Wild Rice Products Revenue (USD Million) By Country (2021-2032)
Figure 20. Argentina Wild Rice Products Revenue (USD Million) By Country (2021-2032)
Figure 21. Rest of Asia Pacific Wild Rice Products Revenue (USD Million) By Country (2021-2032)
Figure 22. Middle East and Africa Wild Rice Products Revenue (USD Million) By Region (2021-2032)
Figure 23. Saudi Arabia Wild Rice Products Revenue (USD Million) By Region (2021-2032)
Figure 24. The UAE Wild Rice Products Revenue (USD Million) By Region (2021-2032)
Figure 25. Rest of Middle East Wild Rice Products Revenue (USD Million) By Region (2021-2032)
Figure 26. South Africa Wild Rice Products Revenue (USD Million) By Region (2021-2032)
Figure 27. Africa Wild Rice Products Revenue (USD Million) By Region (2021-2032)
Figure 28. North America Wild Rice Products Revenue (USD Million) By Type (2021-2032)
Figure 29. North America Wild Rice Products Revenue (USD Million) By Application (2021-2032)
Figure 30. North America Wild Rice Products Revenue (USD Million) By Product (2021-2032)
Figure 31. Europe Wild Rice Products Revenue (USD Million) By Type (2021-2032)
Figure 32. Europe Wild Rice Products Revenue (USD Million) By Application (2021-2032)
Figure 33. Europe Wild Rice Products Revenue (USD Million) By Product (2021-2032)
Figure 34. Asia Pacific Wild Rice Products Revenue (USD Million) By Type (2021-2032)
Figure 35. Asia Pacific Wild Rice Products Revenue (USD Million) By Application (2021-2032)
Figure 36. Asia Pacific Wild Rice Products Revenue (USD Million) By Product (2021-2032)
Figure 37. South America Wild Rice Products Revenue (USD Million) By Type (2021-2032)
Figure 38. South America Wild Rice Products Revenue (USD Million) By Application (2021-2032)
Figure 39. South America Wild Rice Products Revenue (USD Million) By Product (2021-2032)
Figure 40. Middle East and Africa Wild Rice Products Revenue (USD Million) By Type (2021-2032)
Figure 41. Middle East and Africa Wild Rice Products Revenue (USD Million) By Application (2021-2032)
Figure 42. Middle East and Africa Wild Rice Products Revenue (USD Million) By Product (2021-2032)
By Product
Raw Wild Rice
Processed Wild Rice
Wild Rice Blends
By End-User
Retail/Consumer Products
Foodservice
Industrial/Ingredient Use
By Distribution Channel
Online
Supermarkets/Hypermarkets
Specialty Stores
Foodservice Distributors
Others
Countries Analyzed
North America (US, Canada, Mexico)
Europe (Germany, UK, France, Spain, Italy, Russia, Rest of Europe)
Asia Pacific (China, India, Japan, South Korea, Australia, South East Asia, Rest of Asia)
South America (Brazil, Argentina, Rest of South America)
Middle East and Africa (Saudi Arabia, UAE, Rest of Middle East, South Africa, Egypt, Rest of Africa)
