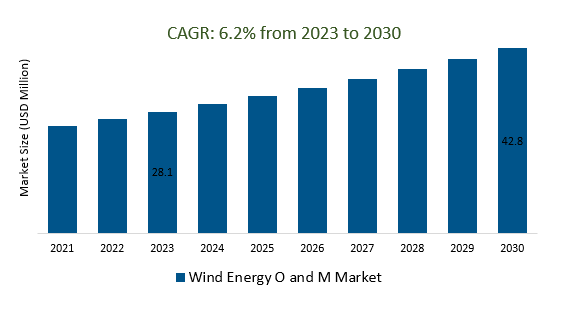
The global Wind Energy O&M Market Size is estimated to be US$ 28.1 Billion in 2023 and is poised to register 6.2% growth over the forecast period from 2023 to 2030 to reach US $ 42.8 billion in 2030.
The market growth is driven predominantly by the increasing global push towards renewable energy sources, including wind energy, has led to a significant increase in the installation of wind turbines, resulting in a larger O&M market. Leading companies are focusing on Rising Wind Capacity, Advanced Technologies, Digitalization and Remote Monitoring, Condition-Based Maintenance, Offshore Wind Expansion, Skills and Workforce Development, and others to boost market shares in the industry.
The Wind Energy Operations and Maintenance (O&M) market is crucial for maintaining the efficient and reliable operation of wind farms, encompassing routine, preventive, and predictive maintenance, as well as remote monitoring and specialized services like blade inspection. This market's growth aligns with the expansion of global wind energy capacity, driven by increasing demand for clean energy. Participants include O&M service providers, wind farm owners/operators, and technology companies. Challenges encompass cost efficiency, remote location maintenance, data utilization, workforce skills, and sustainability, while opportunities arise from technological advancements and a growing renewable energy focus.
Market Dynamics
Market Trends- Companies are launching Data-Driven Decision Making to attract a consumer base
Data-driven decision-making is a pivotal aspect of the Wind Energy Operations and Maintenance (O&M) market. It involves leveraging data collected from sensors, monitoring systems, and advanced analytics to make informed choices regarding maintenance strategies and operational efficiency. By analyzing real-time turbine performance, component health, and environmental conditions, operators can anticipate issues, optimize maintenance schedules, and reduce downtime. This approach not only enhances the reliability and longevity of wind turbines but also contributes to cost savings and improved energy output. In the ever-evolving landscape of renewable energy, data-driven decision-making is a key driver that empowers the Wind Energy O&M market to efficiently navigate challenges and capitalize on opportunities for sustainable growth.
The emphasis on cost reduction is a significant driver within the Wind Energy Operations and Maintenance (O&M) market. As the wind energy sector expands, optimizing O&M practices becomes essential to minimize expenses while maintaining operational efficiency. This approach involves adopting advanced technologies like predictive maintenance, remote monitoring, and data analytics to identify potential issues proactively, reducing unplanned downtime and associated costs. Additionally, streamlining maintenance processes, utilizing efficient resource allocation, and embracing innovative solutions contribute to overall cost savings. In a competitive energy landscape, the focus on cost reduction within the Wind Energy O&M market ensures sustainable profitability and a more economically viable renewable energy future.
Market Opportunity-Introduction of Energy Security
Energy security is a critical aspect that intersects with the Wind Energy Operations and Maintenance (O&M) market. Wind energy plays a pivotal role in diversifying the energy mix, reducing reliance on fossil fuels, and enhancing overall energy security. Effective O&M practices ensure consistent and reliable operation of wind turbines, contributing to a stable energy supply. By maintaining optimal turbine performance, preventing failures, and responding promptly to issues, the O&M market safeguards against energy disruptions. This resilience is crucial for meeting energy demands while reducing vulnerability to supply fluctuations or geopolitical factors.
Market Share Analysis- Original Equipment Manufacturers in the Wind Energy O&M Market will register the significant growth
The global Wind Energy O&M Market is analyzed across Original Equipment Manufacturers, Independent Service Providers, and In-House. Of these, Original Equipment Manufacturers is poised to register the fastest growth. Original Equipment Manufacturers (OEMs) are companies responsible for designing, manufacturing, and supplying wind turbines and components. In the Wind Energy O&M market, OEMs offer maintenance services, spare parts, expertise, and software solutions to ensure optimal turbine performance and support wind farm operations. They contribute to remote monitoring, warranty services, upgrades, and training, enhancing the efficiency and longevity of wind assets.
Market Share Analysis- Onshore held a significant market share in 2023
The global Wind Energy O&M Market is analyzed across a wide range of applications including Offshore, and Onshore. Of these, individuals held a significant market share in 2023. The Wind Energy O&M market involves services and technologies for maintaining wind turbine performance and infrastructure. It includes routine and predictive maintenance, aiming to optimize energy output and extend turbine lifespan. OEMs, service providers, and operators play pivotal roles.
Wind Energy O&M Market Segmentation
By Type
- Original Equipment Manufacturers
- Independent Service Providers
- In-House
By Application
By Component
- Turbines
- Blades
- Gearbox
- Generator
- Towers
By Service
- Inspection
- Maintenance
- Repair
- Upgrade
By Region
- North America (United States, Canada, Mexico)
- Europe (Germany, France, United Kingdom, Spain, Italy, Others)
- Asia Pacific (China, India, Japan, South Korea, Australia, Others)
- Latin America (Brazil, Argentina, Others)
- Middle East and Africa (Saudi Arabia, UAE, Kuwait, Other Middle East, South Africa, Nigeria, Other Africa)
Wind Energy O&M Market companies
- Siemens Wind Power
- Suzlon
- GE Wind Turbine
- Enercon
- Gamesa
- Nordex SE
- Deutsche Windtechnik
- Enercon GmbH
* List not exhaustive
Wind Energy O and M Market Outlook 2023
1 Market Overview
1.1 Introduction to the Wind Energy O and M Market
1.2 Scope of the Study
1.3 Research Objective
1.3.1 Key Market Scope and Segments
1.3.2 Players Covered
1.3.3 Years Considered
2 Executive Summary
2.1 2023 Wind Energy O and M Industry- Market Statistics
3 Market Dynamics
3.1 Market Drivers
3.2 Market Challenges
3.3 Market Opportunities
3.4 Market Trends
4 Market Factor Analysis
4.1 Porter’s Five Forces
4.2 Market Entropy
4.2.1 Global Wind Energy O and M Market Companies with Area Served
4.2.2 Products Offerings Global Wind Energy O and M Market
5 COVID-19 Impact Analysis and Outlook Scenarios
5.1.1 Covid-19 Impact Analysis
5.1.2 Post-COVID-19 Scenario- Low Growth Case
5.1.3 Post-COVID-19 Scenario- Reference Growth Case
5.1.4 Post-COVID-19 Scenario- Low Growth Case
6 Global Wind Energy O and M Market Trends
6.1 Global Wind Energy O and M Revenue (USD Million) and CAGR (%) by Type (2018-2030)
6.2 Global Wind Energy O and M Revenue (USD Million) and CAGR (%) by Applications (2018-2030)
6.3 Global Wind Energy O and M Revenue (USD Million) and CAGR (%) by Regions (2018-2030)
7 Global Wind Energy O and M Market Revenue (USD Million) by Type, and Applications (2018-2022)
7.1 Global Wind Energy O and M Revenue (USD Million) by Type (2018-2022)
7.1.1 Global Wind Energy O and M Revenue (USD Million), Market Share (%) by Type (2018-2022)
7.2 Global Wind Energy O and M Revenue (USD Million) by Applications (2018-2022)
7.2.1 Global Wind Energy O and M Revenue (USD Million), Market Share (%) by Applications (2018-2022)
8 Global Wind Energy O and M Development Regional Status and Outlook
8.1 Global Wind Energy O and M Revenue (USD Million) By Regions (2018-2022)
8.2 North America Wind Energy O and M Revenue (USD Million) by Type, and Application (2018-2022)
8.2.1 North America Wind Energy O and M Revenue (USD Million) by Country (2018-2022)
8.2.2 North America Wind Energy O and M Revenue (USD Million) by Type (2018-2022)
8.2.3 North America Wind Energy O and M Revenue (USD Million) by Applications (2018-2022)
8.3 Europe Wind Energy O and M Revenue (USD Million), by Type, and Applications (USD Million) (2018-2022)
8.3.1 Europe Wind Energy O and M Revenue (USD Million), by Country (2018-2022)
8.3.2 Europe Wind Energy O and M Revenue (USD Million) by Type (2018-2022)
8.3.3 Europe Wind Energy O and M Revenue (USD Million) by Applications (2018-2022)
8.4 Asia Pacific Wind Energy O and M Revenue (USD Million), and Revenue (USD Million) by Type, and Applications (2018-2022)
8.4.1 Asia Pacific Wind Energy O and M Revenue (USD Million) by Country (2018-2022)
8.4.2 Asia Pacific Wind Energy O and M Revenue (USD Million) by Type (2018-2022)
8.4.3 Asia Pacific Wind Energy O and M Revenue (USD Million) by Applications (2018-2022)
8.5 South America Wind Energy O and M Revenue (USD Million), by Type, and Applications (2018-2022)
8.5.1 South America Wind Energy O and M Revenue (USD Million), by Country (2018-2022)
8.5.2 South America Wind Energy O and M Revenue (USD Million) by Type (2018-2022)
8.5.3 South America Wind Energy O and M Revenue (USD Million) by Applications (2018-2022)
8.6 Middle East and Africa Wind Energy O and M Revenue (USD Million), by Type, Technology, Application, Thickness (2018-2022)
8.6.1 Middle East and Africa Wind Energy O and M Revenue (USD Million) by Country (2018-2022)
8.6.2 Middle East and Africa Wind Energy O and M Revenue (USD Million) by Type (2018-2022)
8.6.3 Middle East and Africa Wind Energy O and M Revenue (USD Million) by Applications (2018-2022)
9 Company Profiles
10 Global Wind Energy O and M Market Revenue (USD Million), by Type, and Applications (2023-2030)
10.1 Global Wind Energy O and M Revenue (USD Million) and Market Share (%) by Type (2023-2030)
10.1.1 Global Wind Energy O and M Revenue (USD Million), and Market Share (%) by Type (2023-2030)
10.2 Global Wind Energy O and M Revenue (USD Million) and Market Share (%) by Applications (2023-2030)
10.2.1 Global Wind Energy O and M Revenue (USD Million), and Market Share (%) by Applications (2023-2030)
11 Global Wind Energy O and M Development Regional Status and Outlook Forecast
11.1 Global Wind Energy O and M Revenue (USD Million) By Regions (2023-2030)
11.2 North America Wind Energy O and M Revenue (USD Million) by Type, and Applications (2023-2030)
11.2.1 North America Wind Energy O and M Revenue (USD) Million by Country (2023-2030)
11.2.2 North America Wind Energy O and M Revenue (USD Million), by Type (2023-2030)
11.2.3 North America Wind Energy O and M Revenue (USD Million), Market Share (%) by Applications (2023-2030)
11.3 Europe Wind Energy O and M Revenue (USD Million), by Type, and Applications (2023-2030)
11.3.1 Europe Wind Energy O and M Revenue (USD Million), by Country (2023-2030)
11.3.2 Europe Wind Energy O and M Revenue (USD Million), by Type (2023-2030)
11.3.3 Europe Wind Energy O and M Revenue (USD Million), by Applications (2023-2030)
11.4 Asia Pacific Wind Energy O and M Revenue (USD Million) by Type, and Applications (2023-2030)
11.4.1 Asia Pacific Wind Energy O and M Revenue (USD Million), by Country (2023-2030)
11.4.2 Asia Pacific Wind Energy O and M Revenue (USD Million), by Type (2023-2030)
11.4.3 Asia Pacific Wind Energy O and M Revenue (USD Million), by Applications (2023-2030)
11.5 South America Wind Energy O and M Revenue (USD Million), by Type, and Applications (2023-2030)
11.5.1 South America Wind Energy O and M Revenue (USD Million), by Country (2023-2030)
11.5.2 South America Wind Energy O and M Revenue (USD Million), by Type (2023-2030)
11.5.3 South America Wind Energy O and M Revenue (USD Million), by Applications (2023-2030)
11.6 Middle East and Africa Wind Energy O and M Revenue (USD Million), by Type, and Applications (2023-2030)
11.6.1 Middle East and Africa Wind Energy O and M Revenue (USD Million), by Region (2023-2030)
11.6.2 Middle East and Africa Wind Energy O and M Revenue (USD Million), by Type (2023-2030)
11.6.3 Middle East and Africa Wind Energy O and M Revenue (USD Million), by Applications (2023-2030)
12 Methodology and Data Sources
12.1 Methodology/Research Approach
12.1.1 Research Programs/Design
12.1.2 Market Size Estimation
12.1.3 Market Breakdown and Data Triangulation
12.2 Data Sources
12.2.1 Secondary Sources
12.2.2 Primary Sources
12.3 Disclaimer
List of Tables
Table 1 Market Segmentation Analysis
Table 2 Global Wind Energy O and M Market Companies with Areas Served
Table 3 Products Offerings Global Wind Energy O and M Market
Table 4 Low Growth Scenario Forecasts
Table 5 Reference Case Growth Scenario
Table 6 High Growth Case Scenario
Table 7 Global Wind Energy O and M Revenue (USD Million) And CAGR (%) By Type (2018-2030)
Table 8 Global Wind Energy O and M Revenue (USD Million) And CAGR (%) By Applications (2018-2030)
Table 9 Global Wind Energy O and M Revenue (USD Million) And CAGR (%) By Regions (2018-2030)
Table 10 Global Wind Energy O and M Revenue (USD Million) By Type (2018-2022)
Table 11 Global Wind Energy O and M Revenue Market Share (%) By Type (2018-2022)
Table 12 Global Wind Energy O and M Revenue (USD Million) By Applications (2018-2022)
Table 13 Global Wind Energy O and M Revenue Market Share (%) By Applications (2018-2022)
Table 14 Global Wind Energy O and M Market Revenue (USD Million) By Regions (2018-2022)
Table 15 Global Wind Energy O and M Market Share (%) By Regions (2018-2022)
Table 16 North America Wind Energy O and M Revenue (USD Million) By Country (2018-2022)
Table 17 North America Wind Energy O and M Revenue (USD Million) By Type (2018-2022)
Table 18 North America Wind Energy O and M Revenue (USD Million) By Applications (2018-2022)
Table 19 Europe Wind Energy O and M Revenue (USD Million) By Country (2018-2022)
Table 20 Europe Wind Energy O and M Revenue (USD Million) By Type (2018-2022)
Table 21 Europe Wind Energy O and M Revenue (USD Million) By Applications (2018-2022)
Table 22 Asia Pacific Wind Energy O and M Revenue (USD Million) By Country (2018-2022)
Table 23 Asia Pacific Wind Energy O and M Revenue (USD Million) By Type (2018-2022)
Table 24 Asia Pacific Wind Energy O and M Revenue (USD Million) By Applications (2018-2022)
Table 25 South America Wind Energy O and M Revenue (USD Million) By Country (2018-2022)
Table 26 South America Wind Energy O and M Revenue (USD Million) By Type (2018-2022)
Table 27 South America Wind Energy O and M Revenue (USD Million) By Applications (2018-2022)
Table 28 Middle East and Africa Wind Energy O and M Revenue (USD Million) By Region (2018-2022)
Table 29 Middle East and Africa Wind Energy O and M Revenue (USD Million) By Type (2018-2022)
Table 30 Middle East and Africa Wind Energy O and M Revenue (USD Million) By Applications (2018-2022)
Table 31 Financial Analysis
Table 32 Global Wind Energy O and M Revenue (USD Million) By Type (2023-2030)
Table 33 Global Wind Energy O and M Revenue Market Share (%) By Type (2023-2030)
Table 34 Global Wind Energy O and M Revenue (USD Million) By Applications (2023-2030)
Table 35 Global Wind Energy O and M Revenue Market Share (%) By Applications (2023-2030)
Table 36 Global Wind Energy O and M Market Revenue (USD Million), And Revenue (USD Million) By Regions (2023-2030)
Table 37 North America Wind Energy O and M Revenue (USD)By Country (2023-2030)
Table 38 North America Wind Energy O and M Revenue (USD Million) By Type (2023-2030)
Table 39 North America Wind Energy O and M Revenue (USD Million) By Applications (2023-2030)
Table 40 Europe Wind Energy O and M Revenue (USD Million) By Country (2023-2030)
Table 41 Europe Wind Energy O and M Revenue (USD Million) By Type (2023-2030)
Table 42 Europe Wind Energy O and M Revenue (USD Million) By Applications (2023-2030)
Table 43 Asia Pacific Wind Energy O and M Revenue (USD Million) By Country (2023-2030)
Table 44 Asia Pacific Wind Energy O and M Revenue (USD Million) By Type (2023-2030)
Table 45 Asia Pacific Wind Energy O and M Revenue (USD Million) By Applications (2023-2030)
Table 46 South America Wind Energy O and M Revenue (USD Million) By Country (2023-2030)
Table 47 South America Wind Energy O and M Revenue (USD Million) By Type (2023-2030)
Table 48 South America Wind Energy O and M Revenue (USD Million) By Applications (2023-2030)
Table 49 Middle East and Africa Wind Energy O and M Revenue (USD Million) By Region (2023-2030)
Table 50 Middle East and Africa Wind Energy O and M Revenue (USD Million) By Region (2023-2030)
Table 51 Middle East and Africa Wind Energy O and M Revenue (USD Million) By Type (2023-2030)
Table 52 Middle East and Africa Wind Energy O and M Revenue (USD Million) By Applications (2023-2030)
Table 53 Research Programs/Design for This Report
Table 54 Key Data Information from Secondary Sources
Table 55 Key Data Information from Primary Sources
List of Figures
Figure 1 Market Scope
Figure 2 Porter’s Five Forces
Figure 3 Global Wind Energy O and M Revenue (USD Million) By Type (2018-2022)
Figure 4 Global Wind Energy O and M Revenue Market Share (%) By Type (2022)
Figure 5 Global Wind Energy O and M Revenue (USD Million) By Applications (2018-2022)
Figure 6 Global Wind Energy O and M Revenue Market Share (%) By Applications (2022)
Figure 7 Global Wind Energy O and M Market Revenue (USD Million) By Regions (2018-2022)
Figure 8 Global Wind Energy O and M Market Share (%) By Regions (2022)
Figure 9 North America Wind Energy O and M Revenue (USD Million) By Country (2018-2022)
Figure 10 North America Wind Energy O and M Revenue (USD Million) By Type (2018-2022)
Figure 11 North America Wind Energy O and M Revenue (USD Million) By Applications (2018-2022)
Figure 12 Europe Wind Energy O and M Revenue (USD Million) By Country (2018-2022)
Figure 13 Europe Wind Energy O and M Revenue (USD Million) By Type (2018-2022)
Figure 14 Europe Wind Energy O and M Revenue (USD Million) By Applications (2018-2022)
Figure 15 Asia Pacific Wind Energy O and M Revenue (USD Million) By Country (2018-2022)
Figure 16 Asia Pacific Wind Energy O and M Revenue (USD Million) By Type (2018-2022)
Figure 17 Asia Pacific Wind Energy O and M Revenue (USD Million) By Applications (2018-2022)
Figure 18 South America Wind Energy O and M Revenue (USD Million) By Country (2018-2022)
Figure 19 South America Wind Energy O and M Revenue (USD Million) By Type (2018-2022)
Figure 20 South America Wind Energy O and M Revenue (USD Million) By Applications (2018-2022)
Figure 21 Middle East and Africa Wind Energy O and M Revenue (USD Million) By Region (2018-2022)
Figure 22 Middle East and Africa Wind Energy O and M Revenue (USD Million) By Type (2018-2022)
Figure 23 Middle East and Africa Wind Energy O and M Revenue (USD Million) By Applications (2018-2022)
Figure 24 Global Wind Energy O and M Revenue (USD Million) By Type (2023-2030)
Figure 25 Global Wind Energy O and M Revenue Market Share (%) By Type (2030)
Figure 26 Global Wind Energy O and M Revenue (USD Million) By Applications (2023-2030)
Figure 27 Global Wind Energy O and M Revenue Market Share (%) By Applications (2030)
Figure 28 Global Wind Energy O and M Market Revenue (USD Million) By Regions (2023-2030)
Figure 29 North America Wind Energy O and M Revenue (USD Million) By Country (2023-2030)
Figure 30 North America Wind Energy O and M Revenue (USD Million) By Type (2023-2030)
Figure 31 North America Wind Energy O and M Revenue (USD Million) By Applications (2023-2030)
Figure 32 Europe Wind Energy O and M Revenue (USD Million) By Country (2023-2030)
Figure 33 Europe Wind Energy O and M Revenue (USD Million) By Type (2023-2030)
Figure 34 Europe Wind Energy O and M Revenue (USD Million) By Applications (2023-2030)
Figure 35 Asia Pacific Wind Energy O and M Revenue (USD Million) By Country (2023-2030)
Figure 36 Asia Pacific Wind Energy O and M Revenue (USD Million) By Type (2023-2030)
Figure 37 Asia Pacific Wind Energy O and M Revenue (USD Million) By Applications (2023-2030)
Figure 38 South America Wind Energy O and M Revenue (USD Million) By Country (2023-2030)
Figure 39 South America Wind Energy O and M Revenue (USD Million) By Type (2023-2030)
Figure 40 South America Wind Energy O and M Revenue (USD Million) By Applications (2023-2030)
Figure 41 Middle East and Africa Wind Energy O and M Revenue (USD Million) By Region (2023-2030)
Figure 42 Middle East and Africa Wind Energy O and M Revenue (USD Million) By Region (2023-2030)
Figure 43 Middle East and Africa Wind Energy O and M Revenue (USD Million) By Type (2023-2030)
Figure 44 Middle East and Africa Wind Energy O and M Revenue (USD Million) By Applications (2023-2030)
Figure 45 Bottom-Up and Top-Down Approaches For This Report
Figure 46 Data Triangulation
