
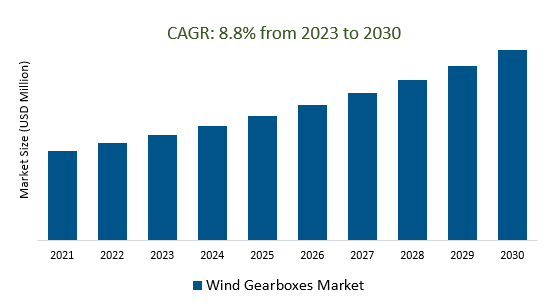
The Global Wind Gearboxes Market Size is estimated to register 8.8% growth over the forecast period from 2023 to 2030.
The global push for renewable energy, particularly wind power, has led to increased demand for wind gearboxes. The decreasing costs of wind energy make it more competitive with traditional sources, driving investment in wind projects. Technological advancements in wind turbines also drive the need for advanced gearboxes. Energy transition policies, increasing wind farm installations, and environmental concerns are driving the demand for gearboxes. Trends include enhancing gearbox efficiency, adopting direct drive systems, digitalization, offshore wind expansion, market consolidation, and sustainability considerations. Offshore wind power is gaining traction due to higher wind speeds, and the industry is seeing consolidation to achieve economies of scale.
The global demand for wind gearboxes is experiencing a remarkable surge, driven by the ongoing renewable energy revolution. As the world shifts towards cleaner and more sustainable energy sources, wind power has emerged as a pivotal player in this transformation. Wind gearboxes, essential components in wind turbines, have seen a significant upswing in demand to support the expansion of wind energy projects worldwide. This growth trend is attributed to the increasing adoption of wind power generation, aiming to reduce carbon emissions and combat climate change. Both onshore and offshore wind farms have contributed to the heightened need for advanced and efficient gearboxes, with their reliability being paramount for the consistent production of clean energy. The IN-Wind Gearboxes Market is witnessing remarkable momentum as it capitalizes on the global enthusiasm for renewable energy, positioning itself as a vital sector in the sustainable energy landscape.
The increasing affordability of wind energy is driving a surging demand for wind gearboxes in the thriving wind gearboxes market. As renewable energy sources gain prominence, wind power has emerged as a frontrunner, thanks to its cost-effective and eco-friendly attributes. This shift towards wind energy has led to a substantial rise in the need for reliable and efficient wind gearboxes, which are integral components in wind turbines. Manufacturers are responding to this escalating demand by innovating and producing more advanced and affordable wind gearboxes, effectively catering to the growing energy sector's requirements. This trend not only reduces the cost of wind power generation but also bolsters the sustainability agenda, aligning with global efforts to combat climate change. In this dynamic and evolving market, the development of cutting-edge wind gearboxes is set to play a pivotal role in shaping the future of renewable energy.
Advancements in wind turbine technology have catalyzed a wave of innovation in the wind gearboxes market. With increasing focus on renewable energy sources, the demand for more efficient and durable wind turbines has surged. These advancements encompass cutting-edge designs and materials that enhance energy conversion and reliability. The development of direct-drive systems, improved gear designs, and smart monitoring technologies has led to substantial improvements in gearbox efficiency and maintenance. This progress not only boosts the performance of wind turbines but also contributes to cost reductions, making wind energy more competitive. As the wind industry continues to evolve, these innovations in wind gearboxes play a pivotal role in shaping the future of sustainable energy generation.
As the beating heart of a wind turbine, it plays a pivotal role in the conversion of wind energy into electricity. Its dominance is attributed to its exceptional efficiency and reliability, ensuring optimal power generation. This vital component efficiently manages the variable input from the wind, allowing turbines to operate seamlessly across various wind speeds. With constant advancements in engineering, main gearboxes continue to evolve, becoming increasingly compact and durable. Their widespread adoption is a testament to their importance in the sustainable energy landscape, solidifying their position as a cornerstone of modern wind energy technology. In an ever-expanding renewable energy sector, the main gearbox's reign as the primary player shows no signs of wavering.
In the realm of wind energy, wind turbines are essential components, and their efficiency heavily depends on the gearbox's performance. Gearboxes above 3 MW are at the forefront of this industry, playing a pivotal role in harnessing the power of strong winds for electricity generation. These high-capacity gearboxes are renowned for their ability to handle the immense mechanical stresses associated with larger wind turbines, ensuring optimal energy conversion. As renewable energy continues to gain momentum, the demand for wind gearboxes in this power segment is poised for substantial growth, further solidifying its dominant position in the market. The relentless pursuit of cleaner, sustainable energy sources underscores the importance of these high-capacity wind gearboxes in our energy transition journey.
The enduring presence can be attributed to their robust and time-tested design, which ensures reliable power transmission within wind turbines. These gearboxes employ traditional mechanical components, such as gears and shafts, to effectively convert the variable rotational speed of wind turbine blades into a consistent speed for electricity generation. Their widespread use can be attributed to their efficiency, durability, and cost-effectiveness. Despite advancements in alternative technologies, conventional gearboxes continue to serve as a cornerstone of wind turbine systems, providing the necessary mechanical advantage to harness wind energy and generate sustainable electricity. Their reliability and proven performance make them a preferred choice for many wind energy projects, contributing significantly to the continued growth of the wind power industry.
The dominant position is a testament to their pivotal role in harnessing the power of the wind to generate clean and sustainable electricity. These turbines are designed to withstand the formidable forces of nature, efficiently converting wind energy into electrical power. Medium-sized turbines, typically with capacities ranging from 100 to 1,500 kilowatts, and large turbines exceeding 1.5 megawatts, offer superior performance and reliability. Their prevalence reflects the industry's focus on enhancing energy production and reducing environmental impact. The continued advancement and adoption of these turbines underscore their significance in the ongoing global shift towards renewable energy sources.
Onshore wind power energy source harnesses the power of the wind by placing turbines on land, making it a highly accessible and cost-effective option for generating electricity. Onshore wind farms have proliferated across various regions, taking advantage of favourable wind conditions, infrastructure, and reduced installation costs. The efficiency and reliability of wind gearboxes play a pivotal role in ensuring the seamless operation of these wind turbines, making them an indispensable component of the onshore wind power industry. As concerns over sustainability and climate change continue to grow, onshore wind power is expected to maintain its leading position, further driving innovation and advancements in wind gearbox technology to maximize its potential as a clean and renewable energy source.
This geographical expanse encompasses a vast and diverse array of nations, each playing a pivotal role in the development and proliferation of wind energy technology. The region's ascendancy is attributed to its robust commitment to renewable energy sources, particularly wind power, as it strives to address energy security and environmental concerns. Booming economies such as China and India have spearheaded large-scale wind energy projects, contributing significantly to the wind gearboxes market's growth. Furthermore, government policies and incentives aimed at promoting clean energy have further propelled the region's dominance in this sector. The Asia Pacific region's unwavering dedication to sustainable energy solutions solidifies its position as the primary hub for wind gearboxes and wind energy infrastructure.
By Type
By Power
By Technology
By Wind Turbine Size
By Application
By Region
*List not exhaustive
Wind Gearboxes Market Outlook 2023
1 Market Overview
1.1 Introduction to the Wind Gearboxes Market
1.2 Scope of the Study
1.3 Research Objective
1.3.1 Key Market Scope and Segments
1.3.2 Players Covered
1.3.3 Years Considered
2 Executive Summary
2.1 2023 Wind Gearboxes Industry- Market Statistics
3 Market Dynamics
3.1 Market Drivers
3.2 Market Challenges
3.3 Market Opportunities
3.4 Market Trends
4 Market Factor Analysis
4.1 Porter’s Five Forces
4.2 Market Entropy
4.2.1 Global Wind Gearboxes Market Companies with Area Served
4.2.2 Products Offerings Global Wind Gearboxes Market
5 COVID-19 Impact Analysis and Outlook Scenarios
5.1.1 Covid-19 Impact Analysis
5.1.2 post-COVID-19 Scenario- Low Growth Case
5.1.3 post-COVID-19 Scenario- Reference Growth Case
5.1.4 post-COVID-19 Scenario- Low Growth Case
6 Global Wind Gearboxes Market Trends
6.1 Global Wind Gearboxes Revenue (USD Million) and CAGR (%) by Type (2018-2030)
6.2 Global Wind Gearboxes Revenue (USD Million) and CAGR (%) by Applications (2018-2030)
6.3 Global Wind Gearboxes Revenue (USD Million) and CAGR (%) by regions (2018-2030)
7 Global Wind Gearboxes Market Revenue (USD Million) by Type, and Applications (2018-2022)
7.1 Global Wind Gearboxes Revenue (USD Million) by Type (2018-2022)
7.1.1 Global Wind Gearboxes Revenue (USD Million), Market Share (%) by Type (2018-2022)
7.2 Global Wind Gearboxes Revenue (USD Million) by Applications (2018-2022)
7.2.1 Global Wind Gearboxes Revenue (USD Million), Market Share (%) by Applications (2018-2022)
8 Global Wind Gearboxes Development Regional Status and Outlook
8.1 Global Wind Gearboxes Revenue (USD Million) By Regions (2018-2022)
8.2 North America Wind Gearboxes Revenue (USD Million) by Type, and Application (2018-2022)
8.2.1 North America Wind Gearboxes Revenue (USD Million) by Country (2018-2022)
8.2.2 North America Wind Gearboxes Revenue (USD Million) by Type (2018-2022)
8.2.3 North America Wind Gearboxes Revenue (USD Million) by Applications (2018-2022)
8.3 Europe Wind Gearboxes Revenue (USD Million), by Type, and Applications (USD Million) (2018-2022)
8.3.1 Europe Wind Gearboxes Revenue (USD Million), by Country (2018-2022)
8.3.2 Europe Wind Gearboxes Revenue (USD Million) by Type (2018-2022)
8.3.3 Europe Wind Gearboxes Revenue (USD Million) by Applications (2018-2022)
8.4 Asia Pacific Wind Gearboxes Revenue (USD Million), and Revenue (USD Million) by Type, and Applications (2018-2022)
8.4.1 Asia Pacific Wind Gearboxes Revenue (USD Million) by Country (2018-2022)
8.4.2 Asia Pacific Wind Gearboxes Revenue (USD Million) by Type (2018-2022)
8.4.3 Asia Pacific Wind Gearboxes Revenue (USD Million) by Applications (2018-2022)
8.5 South America Wind Gearboxes Revenue (USD Million), by Type, and Applications (2018-2022)
8.5.1 South America Wind Gearboxes Revenue (USD Million), by Country (2018-2022)
8.5.2 South America Wind Gearboxes Revenue (USD Million) by Type (2018-2022)
8.5.3 South America Wind Gearboxes Revenue (USD Million) by Applications (2018-2022)
8.6 Middle East and Africa Wind Gearboxes Revenue (USD Million), by Type, Technology, Application, Thickness (2018-2022)
8.6.1 Middle East and Africa Wind Gearboxes Revenue (USD Million) by Country (2018-2022)
8.6.2 Middle East and Africa Wind Gearboxes Revenue (USD Million) by Type (2018-2022)
8.6.3 Middle East and Africa Wind Gearboxes Revenue (USD Million) by Applications (2018-2022)
9 Company Profiles
10 Global Wind Gearboxes Market Revenue (USD Million), by Type, and Applications (2023-2030)
10.1 Global Wind Gearboxes Revenue (USD Million) and Market Share (%) by Type (2023-2030)
10.1.1 Global Wind Gearboxes Revenue (USD Million), and Market Share (%) by Type (2023-2030)
10.2 Global Wind Gearboxes Revenue (USD Million) and Market Share (%) by Applications (2023-2030)
10.2.1 Global Wind Gearboxes Revenue (USD Million), and Market Share (%) by Applications (2023-2030)
11 Global Wind Gearboxes Development Regional Status and Outlook Forecast
11.1 Global Wind Gearboxes Revenue (USD Million) By Regions (2023-2030)
11.2 North America Wind Gearboxes Revenue (USD Million) by Type, and Applications (2023-2030)
11.2.1 North America Wind Gearboxes Revenue (USD) Million by Country (2023-2030)
11.2.2 North America Wind Gearboxes Revenue (USD Million), by Type (2023-2030)
11.2.3 North America Wind Gearboxes Revenue (USD Million), Market Share (%) by Applications (2023-2030)
11.3 Europe Wind Gearboxes Revenue (USD Million), by Type, and Applications (2023-2030)
11.3.1 Europe Wind Gearboxes Revenue (USD Million), by Country (2023-2030)
11.3.2 Europe Wind Gearboxes Revenue (USD Million), by Type (2023-2030)
11.3.3 Europe Wind Gearboxes Revenue (USD Million), by Applications (2023-2030)
11.4 Asia Pacific Wind Gearboxes Revenue (USD Million) by Type, and Applications (2023-2030)
11.4.1 Asia Pacific Wind Gearboxes Revenue (USD Million), by Country (2023-2030)
11.4.2 Asia Pacific Wind Gearboxes Revenue (USD Million), by Type (2023-2030)
11.4.3 Asia Pacific Wind Gearboxes Revenue (USD Million), by Applications (2023-2030)
11.5 South America Wind Gearboxes Revenue (USD Million), by Type, and Applications (2023-2030)
11.5.1 South America Wind Gearboxes Revenue (USD Million), by Country (2023-2030)
11.5.2 South America Wind Gearboxes Revenue (USD Million), by Type (2023-2030)
11.5.3 South America Wind Gearboxes Revenue (USD Million), by Applications (2023-2030)
11.6 Middle East and Africa Wind Gearboxes Revenue (USD Million), by Type, and Applications (2023-2030)
11.6.1 Middle East and Africa Wind Gearboxes Revenue (USD Million), by region (2023-2030)
11.6.2 Middle East and Africa Wind Gearboxes Revenue (USD Million), by Type (2023-2030)
11.6.3 Middle East and Africa Wind Gearboxes Revenue (USD Million), by Applications (2023-2030)
12 Methodology and Data Sources
12.1 Methodology/Research Approach
12.1.1 Research Programs/Design
12.1.2 Market Size Estimation
12.1.3 Market Breakdown and Data Triangulation
12.2 Data Sources
12.2.1 Secondary Sources
12.2.2 Primary Sources
12.3 Disclaimer
List of Tables
Table 1 Market Segmentation Analysis
Table 2 Global Wind Gearboxes Market Companies with Areas Served
Table 3 Products Offerings Global Wind Gearboxes Market
Table 4 Low Growth Scenario Forecasts
Table 5 Reference Case Growth Scenario
Table 6 High Growth Case Scenario
Table 7 Global Wind Gearboxes Revenue (USD Million) And CAGR (%) By Type (2018-2030)
Table 8 Global Wind Gearboxes Revenue (USD Million) And CAGR (%) By Applications (2018-2030)
Table 9 Global Wind Gearboxes Revenue (USD Million) And CAGR (%) By Regions (2018-2030)
Table 10 Global Wind Gearboxes Revenue (USD Million) By Type (2018-2022)
Table 11 Global Wind Gearboxes Revenue Market Share (%) By Type (2018-2022)
Table 12 Global Wind Gearboxes Revenue (USD Million) By Applications (2018-2022)
Table 13 Global Wind Gearboxes Revenue Market Share (%) By Applications (2018-2022)
Table 14 Global Wind Gearboxes Market Revenue (USD Million) By Regions (2018-2022)
Table 15 Global Wind Gearboxes Market Share (%) By Regions (2018-2022)
Table 16 North America Wind Gearboxes Revenue (USD Million) By Country (2018-2022)
Table 17 North America Wind Gearboxes Revenue (USD Million) By Type (2018-2022)
Table 18 North America Wind Gearboxes Revenue (USD Million) By Applications (2018-2022)
Table 19 Europe Wind Gearboxes Revenue (USD Million) By Country (2018-2022)
Table 20 Europe Wind Gearboxes Revenue (USD Million) By Type (2018-2022)
Table 21 Europe Wind Gearboxes Revenue (USD Million) By Applications (2018-2022)
Table 22 Asia Pacific Wind Gearboxes Revenue (USD Million) By Country (2018-2022)
Table 23 Asia Pacific Wind Gearboxes Revenue (USD Million) By Type (2018-2022)
Table 24 Asia Pacific Wind Gearboxes Revenue (USD Million) By Applications (2018-2022)
Table 25 South America Wind Gearboxes Revenue (USD Million) By Country (2018-2022)
Table 26 South America Wind Gearboxes Revenue (USD Million) By Type (2018-2022)
Table 27 South America Wind Gearboxes Revenue (USD Million) By Applications (2018-2022)
Table 28 Middle East and Africa Wind Gearboxes Revenue (USD Million) By Region (2018-2022)
Table 29 Middle East and Africa Wind Gearboxes Revenue (USD Million) By Type (2018-2022)
Table 30 Middle East and Africa Wind Gearboxes Revenue (USD Million) By Applications (2018-2022)
Table 31 Financial Analysis
Table 32 Global Wind Gearboxes Revenue (USD Million) By Type (2023-2030)
Table 33 Global Wind Gearboxes Revenue Market Share (%) By Type (2023-2030)
Table 34 Global Wind Gearboxes Revenue (USD Million) By Applications (2023-2030)
Table 35 Global Wind Gearboxes Revenue Market Share (%) By Applications (2023-2030)
Table 36 Global Wind Gearboxes Market Revenue (USD Million), And Revenue (USD Million) By Regions (2023-2030)
Table 37 North America Wind Gearboxes Revenue (USD)By Country (2023-2030)
Table 38 North America Wind Gearboxes Revenue (USD Million) By Type (2023-2030)
Table 39 North America Wind Gearboxes Revenue (USD Million) By Applications (2023-2030)
Table 40 Europe Wind Gearboxes Revenue (USD Million) By Country (2023-2030)
Table 41 Europe Wind Gearboxes Revenue (USD Million) By Type (2023-2030)
Table 42 Europe Wind Gearboxes Revenue (USD Million) By Applications (2023-2030)
Table 43 Asia Pacific Wind Gearboxes Revenue (USD Million) By Country (2023-2030)
Table 44 Asia Pacific Wind Gearboxes Revenue (USD Million) By Type (2023-2030)
Table 45 Asia Pacific Wind Gearboxes Revenue (USD Million) By Applications (2023-2030)
Table 46 South America Wind Gearboxes Revenue (USD Million) By Country (2023-2030)
Table 47 South America Wind Gearboxes Revenue (USD Million) By Type (2023-2030)
Table 48 South America Wind Gearboxes Revenue (USD Million) By Applications (2023-2030)
Table 49 Middle East and Africa Wind Gearboxes Revenue (USD Million) By Region (2023-2030)
Table 50 Middle East and Africa Wind Gearboxes Revenue (USD Million) By Region (2023-2030)
Table 51 Middle East and Africa Wind Gearboxes Revenue (USD Million) By Type (2023-2030)
Table 52 Middle East and Africa Wind Gearboxes Revenue (USD Million) By Applications (2023-2030)
Table 53 Research Programs/Design for This Report
Table 54 Key Data Information from Secondary Sources
Table 55 Key Data Information from Primary Sources
List of Figures
Figure 1 Market Scope
Figure 2 Porter’s Five Forces
Figure 3 Global Wind Gearboxes Revenue (USD Million) By Type (2018-2022)
Figure 4 Global Wind Gearboxes Revenue Market Share (%) By Type (2022)
Figure 5 Global Wind Gearboxes Revenue (USD Million) By Applications (2018-2022)
Figure 6 Global Wind Gearboxes Revenue Market Share (%) By Applications (2022)
Figure 7 Global Wind Gearboxes Market Revenue (USD Million) By Regions (2018-2022)
Figure 8 Global Wind Gearboxes Market Share (%) By Regions (2022)
Figure 9 North America Wind Gearboxes Revenue (USD Million) By Country (2018-2022)
Figure 10 North America Wind Gearboxes Revenue (USD Million) By Type (2018-2022)
Figure 11 North America Wind Gearboxes Revenue (USD Million) By Applications (2018-2022)
Figure 12 Europe Wind Gearboxes Revenue (USD Million) By Country (2018-2022)
Figure 13 Europe Wind Gearboxes Revenue (USD Million) By Type (2018-2022)
Figure 14 Europe Wind Gearboxes Revenue (USD Million) By Applications (2018-2022)
Figure 15 Asia Pacific Wind Gearboxes Revenue (USD Million) By Country (2018-2022)
Figure 16 Asia Pacific Wind Gearboxes Revenue (USD Million) By Type (2018-2022)
Figure 17 Asia Pacific Wind Gearboxes Revenue (USD Million) By Applications (2018-2022)
Figure 18 South America Wind Gearboxes Revenue (USD Million) By Country (2018-2022)
Figure 19 South America Wind Gearboxes Revenue (USD Million) By Type (2018-2022)
Figure 20 South America Wind Gearboxes Revenue (USD Million) By Applications (2018-2022)
Figure 21 Middle East and Africa Wind Gearboxes Revenue (USD Million) By Region (2018-2022)
Figure 22 Middle East and Africa Wind Gearboxes Revenue (USD Million) By Type (2018-2022)
Figure 23 Middle East and Africa Wind Gearboxes Revenue (USD Million) By Applications (2018-2022)
Figure 24 Global Wind Gearboxes Revenue (USD Million) By Type (2023-2030)
Figure 25 Global Wind Gearboxes Revenue Market Share (%) By Type (2030)
Figure 26 Global Wind Gearboxes Revenue (USD Million) By Applications (2023-2030)
Figure 27 Global Wind Gearboxes Revenue Market Share (%) By Applications (2030)
Figure 28 Global Wind Gearboxes Market Revenue (USD Million) By Regions (2023-2030)
Figure 29 North America Wind Gearboxes Revenue (USD Million) By Country (2023-2030)
Figure 30 North America Wind Gearboxes Revenue (USD Million) By Type (2023-2030)
Figure 31 North America Wind Gearboxes Revenue (USD Million) By Applications (2023-2030)
Figure 32 Europe Wind Gearboxes Revenue (USD Million) By Country (2023-2030)
Figure 33 Europe Wind Gearboxes Revenue (USD Million) By Type (2023-2030)
Figure 34 Europe Wind Gearboxes Revenue (USD Million) By Applications (2023-2030)
Figure 35 Asia Pacific Wind Gearboxes Revenue (USD Million) By Country (2023-2030)
Figure 36 Asia Pacific Wind Gearboxes Revenue (USD Million) By Type (2023-2030)
Figure 37 Asia Pacific Wind Gearboxes Revenue (USD Million) By Applications (2023-2030)
Figure 38 South America Wind Gearboxes Revenue (USD Million) By Country (2023-2030)
Figure 39 South America Wind Gearboxes Revenue (USD Million) By Type (2023-2030)
Figure 40 South America Wind Gearboxes Revenue (USD Million) By Applications (2023-2030)
Figure 41 Middle East and Africa Wind Gearboxes Revenue (USD Million) By Region (2023-2030)
Figure 42 Middle East and Africa Wind Gearboxes Revenue (USD Million) By Region (2023-2030)
Figure 43 Middle East and Africa Wind Gearboxes Revenue (USD Million) By Type (2023-2030)
Figure 44 Middle East and Africa Wind Gearboxes Revenue (USD Million) By Applications (2023-2030)
Figure 45 Bottom-Up and Top-Down Approaches for This Report
Figure 46 Data Triangulation
By Type
By Power
By Technology
By Wind Turbine Size
By Application
By Region