
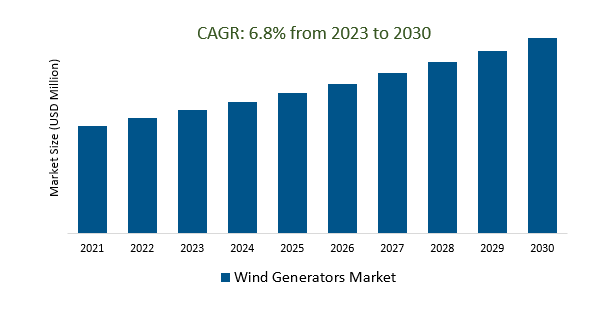
The Global Wind Generators Market Size is estimated to register 6.8% growth over the forecast period from 2023 to 2030.
The market growth is driven by increasing Wind energy helps enhance energy security by diversifying the energy mix and reducing dependence on fossil fuels. Leading Companies focusing on Continued Growth in Installed Capacity, Advancements in Turbine Technology, Offshore Wind Energy Expansion, Hybrid Energy Systems, Digitalization and Predictive Maintenance, and others to boost market shares in the industry.
The Wind Generators Market involves the manufacturing and installation of wind turbines for electricity generation from wind power. It had been growing globally, with onshore and offshore wind segments, driven by a transition to renewable energy, government incentives, technological improvements, economic viability, and energy security. Challenges include intermittency and grid integration. The market's future outlook is positive, with ongoing technological advancements and offshore wind development expected to enhance the industry's growth.
The wind generators market is poised for substantial growth, driven by the steady increase in global wind capacity. This trend underscores the world's ongoing commitment to harnessing renewable energy sources to meet sustainability and climate goals. With wind energy becoming one of the fastest-growing sectors in the power generation industry, both onshore and offshore wind projects are on the rise, offering a potent means of reducing carbon emissions. As governments and private enterprises invest heavily in wind power, the market is set to see further technological advancements and economies of scale, making wind generators increasingly competitive with traditional energy sources.
The demand for wind generators is on the rise, primarily due to the imperative need to integrate wind energy seamlessly into the power grid. Wind energy's intermittent nature requires advanced grid infrastructure and storage solutions to ensure a reliable and stable electricity supply. Governments, utilities, and renewable energy developers are investing in wind generators to enhance grid resilience and harness the benefits of clean and sustainable wind power.
The Wind Generators Market is set for rapid growth within the global renewable energy sector, driven by the increasing demand for clean energy sources, technological advancements, and government incentives. Wind generators, both onshore and offshore, are becoming more cost-effective and efficient, making them integral to meeting renewable energy goals and reducing carbon emissions, aligning with global sustainability efforts.
The Global Wind Generators Market is analyzed across, Doubly-Fed Induction Generator, Permanent-Magnet Generators, Switched Reluctance Generators, High Temperature Superconducting Generators, Synchronous Generators, Squirrel-Cage Induction Machines, DC Machines, and others. Permanent-Magnet Generators is poised to register the fastest growth. Permanent-magnet generators (PMGs) are pivotal in the Wind Generators Market, known for their high efficiency and reliability in wind turbine electricity generation. They enhance wind turbine performance, particularly in offshore and low-wind-speed applications, contributing to the sector's overall growth and competitiveness within the global renewable energy landscape.
The Global Wind Generators Market is analyzed across various applications including Onshore Wind Energy, Offshore Wind Energy, and others. Of these, Offshore Wind Energy held a significant market share in 2023. Offshore Wind Energy is a pivotal segment of the Wind generator market, involving the installation of wind turbines in bodies of water, primarily in the ocean, to capitalize on higher and more consistent offshore wind speeds. This sector is experiencing significant growth due to its potential for larger and more efficient turbines, making it essential for meeting renewable energy goals and reducing carbon emissions, particularly in areas with limited onshore space for wind farms. As governments worldwide invest in offshore wind energy projects, it continues to be a major driver of expansion within the wind generators market and the broader transition to sustainable energy sources.
By Type
By Application
By Turbine Type
By End-user
By Region
*List not exhaustive
Wind Generators Market Outlook 2023
1 Market Overview
1.1 Introduction to the Wind Generators Market
1.2 Scope of the Study
1.3 Research Objective
1.3.1 Key Market Scope and Segments
1.3.2 Players Covered
1.3.3 Years Considered
2 Executive Summary
2.1 2023 Wind Generators Industry- Market Statistics
3 Market Dynamics
3.1 Market Drivers
3.2 Market Challenges
3.3 Market Opportunities
3.4 Market Trends
4 Market Factor Analysis
4.1 Porter’s Five Forces
4.2 Market Entropy
4.2.1 Global Wind Generators Market Companies with Area Served
4.2.2 Products Offerings Global Wind Generators Market
5 COVID-19 Impact Analysis and Outlook Scenarios
5.1.1 Covid-19 Impact Analysis
5.1.2 Post-COVID-19 Scenario- Low Growth Case
5.1.3 Post-COVID-19 Scenario- Reference Growth Case
5.1.4 Post-COVID-19 Scenario- Low Growth Case
6 Global Wind Generators Market Trends
6.1 Global Wind Generators Revenue (USD Million) and CAGR (%) by Type (2018-2030)
6.2 Global Wind Generators Revenue (USD Million) and CAGR (%) by Applications (2018-2030)
6.3 Global Wind Generators Revenue (USD Million) and CAGR (%) by Regions (2018-2030)
7 Global Wind Generators Market Revenue (USD Million) by Type, and Applications (2018-2022)
7.1 Global Wind Generators Revenue (USD Million) by Type (2018-2022)
7.1.1 Global Wind Generators Revenue (USD Million), Market Share (%) by Type (2018-2022)
7.2 Global Wind Generators Revenue (USD Million) by Applications (2018-2022)
7.2.1 Global Wind Generators Revenue (USD Million), Market Share (%) by Applications (2018-2022)
8 Global Wind Generators Development Regional Status and Outlook
8.1 Global Wind Generators Revenue (USD Million) By Regions (2018-2022)
8.2 North America Wind Generators Revenue (USD Million) by Type, and Application (2018-2022)
8.2.1 North America Wind Generators Revenue (USD Million) by Country (2018-2022)
8.2.2 North America Wind Generators Revenue (USD Million) by Type (2018-2022)
8.2.3 North America Wind Generators Revenue (USD Million) by Applications (2018-2022)
8.3 Europe Wind Generators Revenue (USD Million), by Type, and Applications (USD Million) (2018-2022)
8.3.1 Europe Wind Generators Revenue (USD Million), by Country (2018-2022)
8.3.2 Europe Wind Generators Revenue (USD Million) by Type (2018-2022)
8.3.3 Europe Wind Generators Revenue (USD Million) by Applications (2018-2022)
8.4 Asia Pacific Wind Generators Revenue (USD Million), and Revenue (USD Million) by Type, and Applications (2018-2022)
8.4.1 Asia Pacific Wind Generators Revenue (USD Million) by Country (2018-2022)
8.4.2 Asia Pacific Wind Generators Revenue (USD Million) by Type (2018-2022)
8.4.3 Asia Pacific Wind Generators Revenue (USD Million) by Applications (2018-2022)
8.5 South America Wind Generators Revenue (USD Million), by Type, and Applications (2018-2022)
8.5.1 South America Wind Generators Revenue (USD Million), by Country (2018-2022)
8.5.2 South America Wind Generators Revenue (USD Million) by Type (2018-2022)
8.5.3 South America Wind Generators Revenue (USD Million) by Applications (2018-2022)
8.6 Middle East and Africa Wind Generators Revenue (USD Million), by Type, Technology, Application, Thickness (2018-2022)
8.6.1 Middle East and Africa Wind Generators Revenue (USD Million) by Country (2018-2022)
8.6.2 Middle East and Africa Wind Generators Revenue (USD Million) by Type (2018-2022)
8.6.3 Middle East and Africa Wind Generators Revenue (USD Million) by Applications (2018-2022)
9 Company Profiles
10 Global Wind Generators Market Revenue (USD Million), by Type, and Applications (2023-2030)
10.1 Global Wind Generators Revenue (USD Million) and Market Share (%) by Type (2023-2030)
10.1.1 Global Wind Generators Revenue (USD Million), and Market Share (%) by Type (2023-2030)
10.2 Global Wind Generators Revenue (USD Million) and Market Share (%) by Applications (2023-2030)
10.2.1 Global Wind Generators Revenue (USD Million), and Market Share (%) by Applications (2023-2030)
11 Global Wind Generators Development Regional Status and Outlook Forecast
11.1 Global Wind Generators Revenue (USD Million) By Regions (2023-2030)
11.2 North America Wind Generators Revenue (USD Million) by Type, and Applications (2023-2030)
11.2.1 North America Wind Generators Revenue (USD) Million by Country (2023-2030)
11.2.2 North America Wind Generators Revenue (USD Million), by Type (2023-2030)
11.2.3 North America Wind Generators Revenue (USD Million), Market Share (%) by Applications (2023-2030)
11.3 Europe Wind Generators Revenue (USD Million), by Type, and Applications (2023-2030)
11.3.1 Europe Wind Generators Revenue (USD Million), by Country (2023-2030)
11.3.2 Europe Wind Generators Revenue (USD Million), by Type (2023-2030)
11.3.3 Europe Wind Generators Revenue (USD Million), by Applications (2023-2030)
11.4 Asia Pacific Wind Generators Revenue (USD Million) by Type, and Applications (2023-2030)
11.4.1 Asia Pacific Wind Generators Revenue (USD Million), by Country (2023-2030)
11.4.2 Asia Pacific Wind Generators Revenue (USD Million), by Type (2023-2030)
11.4.3 Asia Pacific Wind Generators Revenue (USD Million), by Applications (2023-2030)
11.5 South America Wind Generators Revenue (USD Million), by Type, and Applications (2023-2030)
11.5.1 South America Wind Generators Revenue (USD Million), by Country (2023-2030)
11.5.2 South America Wind Generators Revenue (USD Million), by Type (2023-2030)
11.5.3 South America Wind Generators Revenue (USD Million), by Applications (2023-2030)
11.6 Middle East and Africa Wind Generators Revenue (USD Million), by Type, and Applications (2023-2030)
11.6.1 Middle East and Africa Wind Generators Revenue (USD Million), by Region (2023-2030)
11.6.2 Middle East and Africa Wind Generators Revenue (USD Million), by Type (2023-2030)
11.6.3 Middle East and Africa Wind Generators Revenue (USD Million), by Applications (2023-2030)
12 Methodology and Data Sources
12.1 Methodology/Research Approach
12.1.1 Research Programs/Design
12.1.2 Market Size Estimation
12.1.3 Market Breakdown and Data Triangulation
12.2 Data Sources
12.2.1 Secondary Sources
12.2.2 Primary Sources
12.3 Disclaimer
List of Tables
Table 1 Market Segmentation Analysis
Table 2 Global Wind Generators Market Companies with Areas Served
Table 3 Products Offerings Global Wind Generators Market
Table 4 Low Growth Scenario Forecasts
Table 5 Reference Case Growth Scenario
Table 6 High Growth Case Scenario
Table 7 Global Wind Generators Revenue (USD Million) And CAGR (%) By Type (2018-2030)
Table 8 Global Wind Generators Revenue (USD Million) And CAGR (%) By Applications (2018-2030)
Table 9 Global Wind Generators Revenue (USD Million) And CAGR (%) By Regions (2018-2030)
Table 10 Global Wind Generators Revenue (USD Million) By Type (2018-2022)
Table 11 Global Wind Generators Revenue Market Share (%) By Type (2018-2022)
Table 12 Global Wind Generators Revenue (USD Million) By Applications (2018-2022)
Table 13 Global Wind Generators Revenue Market Share (%) By Applications (2018-2022)
Table 14 Global Wind Generators Market Revenue (USD Million) By Regions (2018-2022)
Table 15 Global Wind Generators Market Share (%) By Regions (2018-2022)
Table 16 North America Wind Generators Revenue (USD Million) By Country (2018-2022)
Table 17 North America Wind Generators Revenue (USD Million) By Type (2018-2022)
Table 18 North America Wind Generators Revenue (USD Million) By Applications (2018-2022)
Table 19 Europe Wind Generators Revenue (USD Million) By Country (2018-2022)
Table 20 Europe Wind Generators Revenue (USD Million) By Type (2018-2022)
Table 21 Europe Wind Generators Revenue (USD Million) By Applications (2018-2022)
Table 22 Asia Pacific Wind Generators Revenue (USD Million) By Country (2018-2022)
Table 23 Asia Pacific Wind Generators Revenue (USD Million) By Type (2018-2022)
Table 24 Asia Pacific Wind Generators Revenue (USD Million) By Applications (2018-2022)
Table 25 South America Wind Generators Revenue (USD Million) By Country (2018-2022)
Table 26 South America Wind Generators Revenue (USD Million) By Type (2018-2022)
Table 27 South America Wind Generators Revenue (USD Million) By Applications (2018-2022)
Table 28 Middle East and Africa Wind Generators Revenue (USD Million) By Region (2018-2022)
Table 29 Middle East and Africa Wind Generators Revenue (USD Million) By Type (2018-2022)
Table 30 Middle East and Africa Wind Generators Revenue (USD Million) By Applications (2018-2022)
Table 31 Financial Analysis
Table 32 Global Wind Generators Revenue (USD Million) By Type (2023-2030)
Table 33 Global Wind Generators Revenue Market Share (%) By Type (2023-2030)
Table 34 Global Wind Generators Revenue (USD Million) By Applications (2023-2030)
Table 35 Global Wind Generators Revenue Market Share (%) By Applications (2023-2030)
Table 36 Global Wind Generators Market Revenue (USD Million), And Revenue (USD Million) By Regions (2023-2030)
Table 37 North America Wind Generators Revenue (USD)By Country (2023-2030)
Table 38 North America Wind Generators Revenue (USD Million) By Type (2023-2030)
Table 39 North America Wind Generators Revenue (USD Million) By Applications (2023-2030)
Table 40 Europe Wind Generators Revenue (USD Million) By Country (2023-2030)
Table 41 Europe Wind Generators Revenue (USD Million) By Type (2023-2030)
Table 42 Europe Wind Generators Revenue (USD Million) By Applications (2023-2030)
Table 43 Asia Pacific Wind Generators Revenue (USD Million) By Country (2023-2030)
Table 44 Asia Pacific Wind Generators Revenue (USD Million) By Type (2023-2030)
Table 45 Asia Pacific Wind Generators Revenue (USD Million) By Applications (2023-2030)
Table 46 South America Wind Generators Revenue (USD Million) By Country (2023-2030)
Table 47 South America Wind Generators Revenue (USD Million) By Type (2023-2030)
Table 48 South America Wind Generators Revenue (USD Million) By Applications (2023-2030)
Table 49 Middle East and Africa Wind Generators Revenue (USD Million) By Region (2023-2030)
Table 50 Middle East and Africa Wind Generators Revenue (USD Million) By Region (2023-2030)
Table 51 Middle East and Africa Wind Generators Revenue (USD Million) By Type (2023-2030)
Table 52 Middle East and Africa Wind Generators Revenue (USD Million) By Applications (2023-2030)
Table 53 Research Programs/Design for This Report
Table 54 Key Data Information from Secondary Sources
Table 55 Key Data Information from Primary Sources
List of Figures
Figure 1 Market Scope
Figure 2 Porter’s Five Forces
Figure 3 Global Wind Generators Revenue (USD Million) By Type (2018-2022)
Figure 4 Global Wind Generators Revenue Market Share (%) By Type (2022)
Figure 5 Global Wind Generators Revenue (USD Million) By Applications (2018-2022)
Figure 6 Global Wind Generators Revenue Market Share (%) By Applications (2022)
Figure 7 Global Wind Generators Market Revenue (USD Million) By Regions (2018-2022)
Figure 8 Global Wind Generators Market Share (%) By Regions (2022)
Figure 9 North America Wind Generators Revenue (USD Million) By Country (2018-2022)
Figure 10 North America Wind Generators Revenue (USD Million) By Type (2018-2022)
Figure 11 North America Wind Generators Revenue (USD Million) By Applications (2018-2022)
Figure 12 Europe Wind Generators Revenue (USD Million) By Country (2018-2022)
Figure 13 Europe Wind Generators Revenue (USD Million) By Type (2018-2022)
Figure 14 Europe Wind Generators Revenue (USD Million) By Applications (2018-2022)
Figure 15 Asia Pacific Wind Generators Revenue (USD Million) By Country (2018-2022)
Figure 16 Asia Pacific Wind Generators Revenue (USD Million) By Type (2018-2022)
Figure 17 Asia Pacific Wind Generators Revenue (USD Million) By Applications (2018-2022)
Figure 18 South America Wind Generators Revenue (USD Million) By Country (2018-2022)
Figure 19 South America Wind Generators Revenue (USD Million) By Type (2018-2022)
Figure 20 South America Wind Generators Revenue (USD Million) By Applications (2018-2022)
Figure 21 Middle East and Africa Wind Generators Revenue (USD Million) By Region (2018-2022)
Figure 22 Middle East and Africa Wind Generators Revenue (USD Million) By Type (2018-2022)
Figure 23 Middle East and Africa Wind Generators Revenue (USD Million) By Applications (2018-2022)
Figure 24 Global Wind Generators Revenue (USD Million) By Type (2023-2030)
Figure 25 Global Wind Generators Revenue Market Share (%) By Type (2030)
Figure 26 Global Wind Generators Revenue (USD Million) By Applications (2023-2030)
Figure 27 Global Wind Generators Revenue Market Share (%) By Applications (2030)
Figure 28 Global Wind Generators Market Revenue (USD Million) By Regions (2023-2030)
Figure 29 North America Wind Generators Revenue (USD Million) By Country (2023-2030)
Figure 30 North America Wind Generators Revenue (USD Million) By Type (2023-2030)
Figure 31 North America Wind Generators Revenue (USD Million) By Applications (2023-2030)
Figure 32 Europe Wind Generators Revenue (USD Million) By Country (2023-2030)
Figure 33 Europe Wind Generators Revenue (USD Million) By Type (2023-2030)
Figure 34 Europe Wind Generators Revenue (USD Million) By Applications (2023-2030)
Figure 35 Asia Pacific Wind Generators Revenue (USD Million) By Country (2023-2030)
Figure 36 Asia Pacific Wind Generators Revenue (USD Million) By Type (2023-2030)
Figure 37 Asia Pacific Wind Generators Revenue (USD Million) By Applications (2023-2030)
Figure 38 South America Wind Generators Revenue (USD Million) By Country (2023-2030)
Figure 39 South America Wind Generators Revenue (USD Million) By Type (2023-2030)
Figure 40 South America Wind Generators Revenue (USD Million) By Applications (2023-2030)
Figure 41 Middle East and Africa Wind Generators Revenue (USD Million) By Region (2023-2030)
Figure 42 Middle East and Africa Wind Generators Revenue (USD Million) By Region (2023-2030)
Figure 43 Middle East and Africa Wind Generators Revenue (USD Million) By Type (2023-2030)
Figure 44 Middle East and Africa Wind Generators Revenue (USD Million) By Applications (2023-2030)
Figure 45 Bottom-Up and Top-Down Approaches For This Report
Figure 46 Data Triangulation
By Type
By Application
By Turbine Type
By End-user
By Region