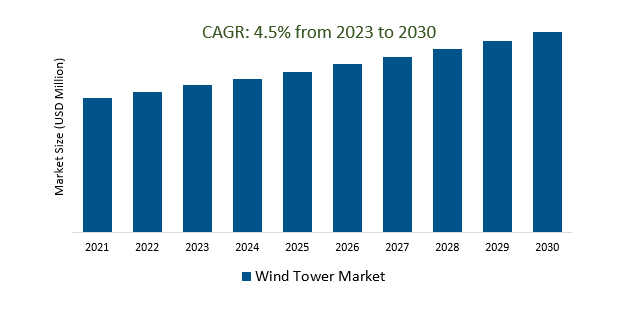
The Global Wind Tower Market Size is estimated to register 4.5% growth over the forecast period from 2023 to 2030.
The market growth is driven by the increasing focus on sustainability in wind tower manufacturing and installation, including the use of eco-friendly materials and recycling processes. Leading companies that are focused on Increasing Global Energy Demand, Renewable Energy Transition, Advancements in Wind Turbine Technology, Grid Integration, Technological Innovations, and others to boost market shares in the industry.
Market Overview
The Wind Tower Market, a vital component of the wind energy industry, has experienced substantial growth driven by global energy demand, renewable energy focus, and climate change mitigation efforts. Key players in the market include CS Wind Corporation, Trinity Structural Towers, Enercon GmbH, Siemens Gamesa Renewable Energy, and others. Market segments include tower types (tubular steel, lattice, concrete, hybrid), installation locations (onshore, offshore), and various geographic regions. Trends include taller towers, offshore wind development, technological advancements, digitalization, and environmental sustainability. Challenges encompass intermittency, regulatory hurdles, supply chain disruptions, competition, and high initial investments. The market's dynamism requires regular monitoring for up-to-date insights.
Market Dynamics
Market Trends - Hybrid wind towers are a new and innovative technology that is revolutionizing the wind energy industry
Hybrid wind towers represent a cutting-edge innovation in the wind energy sector, promising to revolutionize the industry. These towers integrate renewable energy technologies, such as solar panels or energy storage systems, alongside traditional wind turbines. By harnessing multiple energy sources, hybrid wind towers can enhance energy generation efficiency, reliability, and grid integration. This innovation aligns with the industry's goal of maximizing renewable energy output while reducing reliance on fossil fuels, making it a significant development in the ongoing transition to sustainable energy solutions.
Market Driver- The growing demand for taller wind towers is driving growth in the wind tower market.
Taller wind towers are in high demand due to their ability to capture stronger and more consistent winds, leading to increased energy production and better access to wind resources. While they may entail higher initial costs, they ultimately reduce energy production expenses, making wind power more competitive and environmentally friendly. Technological advancements in wind turbine design have facilitated the construction of taller and more efficient towers, driving growth in the wind tower market to meet the rising demand for cleaner energy sources.
Market Opportunity-Introduction of Grid Integration
Grid integration for the wind tower market is the process of efficiently connecting wind turbines to the electrical grid. It involves ensuring power quality, stability, and adherence to grid codes and standards, employing smart grid technologies, incorporating energy storage, and planning for grid expansion. Grid-interactive inverters, grid management, and a supportive policy framework are key components, all aimed at optimizing the reliable integration of wind-generated electricity into the grid, thereby harnessing wind energy's sustainable potential.
Market Share Analysis- Tubular Steel Wind Tower Market will register the Significant growth
The Global Wind Tower Market is analyzed across Concrete, Lattice, Tubular Steel, Hybrid Towers, and others. Tubular Steel is poised to register significant growth. Tubular steel is a critical material in the steel wind tower market, serving as the primary structural component for wind tower construction. Its strength, durability, and cost-efficiency make it essential for creating stable and resilient wind tower structures that support wind turbine generators, enabling the harnessing of wind energy for electricity generation.
Market Share Analysis- Onshore held a significant market share in 2023
The Global Wind Tower Market is analyzed across various applications including Onshore, Offshore, and others. Of these, onshore held a significant market share in 2023. In the wind tower market, 'onshore' denotes wind farms or turbines located on land rather than offshore in bodies of water. Onshore wind farms are common and cost-effective installations that generate renewable electricity by utilizing wind turbines on land-based sites, contributing to global renewable energy efforts.
Wind Tower Market Segmentation
By Product Type
- Concrete
- Lattice
- Tubular Steel
- Hybrid Towers
By Application
By Region
- North America (United States, Canada, Mexico)
- Europe (Germany, France, United Kingdom, Spain, Italy, Others)
- Asia Pacific (China, India, Japan, South Korea, Australia, Others)
- Latin America (Brazil, Argentina, Others)
- Middle East and Africa (Saudi Arabia, UAE, Kuwait, Other Middle East, South Africa, Nigeria, Other Africa)
Wind Tower Market Companies
- Broadwind Energy Inc
- Valmont Industries Inc
- CS WIND Corp.
- Windar Renovables
- ENERCON GmbH
- Nordex SE
- Arcosa Inc
- Vestas Wind System AS
- Xinjiang Goldwind Science & Technology Co. Ltd.
- Acciona SA
*List not exhaustive
Wind Tower Market Outlook 2023
1 Market Overview
1.1 Introduction to the Wind Tower Market
1.2 Scope of the Study
1.3 Research Objective
1.3.1 Key Market Scope and Segments
1.3.2 Players Covered
1.3.3 Years Considered
2 Executive Summary
2.1 2023 Wind Tower Industry- Market Statistics
3 Market Dynamics
3.1 Market Drivers
3.2 Market Challenges
3.3 Market Opportunities
3.4 Market Trends
4 Market Factor Analysis
4.1 Porter’s Five Forces
4.2 Market Entropy
4.2.1 Global Wind Tower Market Companies with Area Served
4.2.2 Products Offerings Global Wind Tower Market
5 COVID-19 Impact Analysis and Outlook Scenarios
5.1.1 Covid-19 Impact Analysis
5.1.2 Post-COVID-19 Scenario- Low Growth Case
5.1.3 Post-COVID-19 Scenario- Reference Growth Case
5.1.4 Post-COVID-19 Scenario- Low Growth Case
6 Global Wind Tower Market Trends
6.1 Global Wind Tower Revenue (USD Million) and CAGR (%) by Type (2018-2030)
6.2 Global Wind Tower Revenue (USD Million) and CAGR (%) by Applications (2018-2030)
6.3 Global Wind Tower Revenue (USD Million) and CAGR (%) by Regions (2018-2030)
7 Global Wind Tower Market Revenue (USD Million) by Type, and Applications (2018-2022)
7.1 Global Wind Tower Revenue (USD Million) by Type (2018-2022)
7.1.1 Global Wind Tower Revenue (USD Million), Market Share (%) by Type (2018-2022)
7.2 Global Wind Tower Revenue (USD Million) by Applications (2018-2022)
7.2.1 Global Wind Tower Revenue (USD Million), Market Share (%) by Applications (2018-2022)
8 Global Wind Tower Development Regional Status and Outlook
8.1 Global Wind Tower Revenue (USD Million) By Regions (2018-2022)
8.2 North America Wind Tower Revenue (USD Million) by Type, and Application (2018-2022)
8.2.1 North America Wind Tower Revenue (USD Million) by Country (2018-2022)
8.2.2 North America Wind Tower Revenue (USD Million) by Type (2018-2022)
8.2.3 North America Wind Tower Revenue (USD Million) by Applications (2018-2022)
8.3 Europe Wind Tower Revenue (USD Million), by Type, and Applications (USD Million) (2018-2022)
8.3.1 Europe Wind Tower Revenue (USD Million), by Country (2018-2022)
8.3.2 Europe Wind Tower Revenue (USD Million) by Type (2018-2022)
8.3.3 Europe Wind Tower Revenue (USD Million) by Applications (2018-2022)
8.4 Asia Pacific Wind Tower Revenue (USD Million), and Revenue (USD Million) by Type, and Applications (2018-2022)
8.4.1 Asia Pacific Wind Tower Revenue (USD Million) by Country (2018-2022)
8.4.2 Asia Pacific Wind Tower Revenue (USD Million) by Type (2018-2022)
8.4.3 Asia Pacific Wind Tower Revenue (USD Million) by Applications (2018-2022)
8.5 South America Wind Tower Revenue (USD Million), by Type, and Applications (2018-2022)
8.5.1 South America Wind Tower Revenue (USD Million), by Country (2018-2022)
8.5.2 South America Wind Tower Revenue (USD Million) by Type (2018-2022)
8.5.3 South America Wind Tower Revenue (USD Million) by Applications (2018-2022)
8.6 Middle East and Africa Wind Tower Revenue (USD Million), by Type, Technology, Application, Thickness (2018-2022)
8.6.1 Middle East and Africa Wind Tower Revenue (USD Million) by Country (2018-2022)
8.6.2 Middle East and Africa Wind Tower Revenue (USD Million) by Type (2018-2022)
8.6.3 Middle East and Africa Wind Tower Revenue (USD Million) by Applications (2018-2022)
9 Company Profiles
10 Global Wind Tower Market Revenue (USD Million), by Type, and Applications (2023-2030)
10.1 Global Wind Tower Revenue (USD Million) and Market Share (%) by Type (2023-2030)
10.1.1 Global Wind Tower Revenue (USD Million), and Market Share (%) by Type (2023-2030)
10.2 Global Wind Tower Revenue (USD Million) and Market Share (%) by Applications (2023-2030)
10.2.1 Global Wind Tower Revenue (USD Million), and Market Share (%) by Applications (2023-2030)
11 Global Wind Tower Development Regional Status and Outlook Forecast
11.1 Global Wind Tower Revenue (USD Million) By Regions (2023-2030)
11.2 North America Wind Tower Revenue (USD Million) by Type, and Applications (2023-2030)
11.2.1 North America Wind Tower Revenue (USD) Million by Country (2023-2030)
11.2.2 North America Wind Tower Revenue (USD Million), by Type (2023-2030)
11.2.3 North America Wind Tower Revenue (USD Million), Market Share (%) by Applications (2023-2030)
11.3 Europe Wind Tower Revenue (USD Million), by Type, and Applications (2023-2030)
11.3.1 Europe Wind Tower Revenue (USD Million), by Country (2023-2030)
11.3.2 Europe Wind Tower Revenue (USD Million), by Type (2023-2030)
11.3.3 Europe Wind Tower Revenue (USD Million), by Applications (2023-2030)
11.4 Asia Pacific Wind Tower Revenue (USD Million) by Type, and Applications (2023-2030)
11.4.1 Asia Pacific Wind Tower Revenue (USD Million), by Country (2023-2030)
11.4.2 Asia Pacific Wind Tower Revenue (USD Million), by Type (2023-2030)
11.4.3 Asia Pacific Wind Tower Revenue (USD Million), by Applications (2023-2030)
11.5 South America Wind Tower Revenue (USD Million), by Type, and Applications (2023-2030)
11.5.1 South America Wind Tower Revenue (USD Million), by Country (2023-2030)
11.5.2 South America Wind Tower Revenue (USD Million), by Type (2023-2030)
11.5.3 South America Wind Tower Revenue (USD Million), by Applications (2023-2030)
11.6 Middle East and Africa Wind Tower Revenue (USD Million), by Type, and Applications (2023-2030)
11.6.1 Middle East and Africa Wind Tower Revenue (USD Million), by Region (2023-2030)
11.6.2 Middle East and Africa Wind Tower Revenue (USD Million), by Type (2023-2030)
11.6.3 Middle East and Africa Wind Tower Revenue (USD Million), by Applications (2023-2030)
12 Methodology and Data Sources
12.1 Methodology/Research Approach
12.1.1 Research Programs/Design
12.1.2 Market Size Estimation
12.1.3 Market Breakdown and Data Triangulation
12.2 Data Sources
12.2.1 Secondary Sources
12.2.2 Primary Sources
12.3 Disclaimer
List of Tables
Table 1 Market Segmentation Analysis
Table 2 Global Wind Tower Market Companies with Areas Served
Table 3 Products Offerings Global Wind Tower Market
Table 4 Low Growth Scenario Forecasts
Table 5 Reference Case Growth Scenario
Table 6 High Growth Case Scenario
Table 7 Global Wind Tower Revenue (USD Million) And CAGR (%) By Type (2018-2030)
Table 8 Global Wind Tower Revenue (USD Million) And CAGR (%) By Applications (2018-2030)
Table 9 Global Wind Tower Revenue (USD Million) And CAGR (%) By Regions (2018-2030)
Table 10 Global Wind Tower Revenue (USD Million) By Type (2018-2022)
Table 11 Global Wind Tower Revenue Market Share (%) By Type (2018-2022)
Table 12 Global Wind Tower Revenue (USD Million) By Applications (2018-2022)
Table 13 Global Wind Tower Revenue Market Share (%) By Applications (2018-2022)
Table 14 Global Wind Tower Market Revenue (USD Million) By Regions (2018-2022)
Table 15 Global Wind Tower Market Share (%) By Regions (2018-2022)
Table 16 North America Wind Tower Revenue (USD Million) By Country (2018-2022)
Table 17 North America Wind Tower Revenue (USD Million) By Type (2018-2022)
Table 18 North America Wind Tower Revenue (USD Million) By Applications (2018-2022)
Table 19 Europe Wind Tower Revenue (USD Million) By Country (2018-2022)
Table 20 Europe Wind Tower Revenue (USD Million) By Type (2018-2022)
Table 21 Europe Wind Tower Revenue (USD Million) By Applications (2018-2022)
Table 22 Asia Pacific Wind Tower Revenue (USD Million) By Country (2018-2022)
Table 23 Asia Pacific Wind Tower Revenue (USD Million) By Type (2018-2022)
Table 24 Asia Pacific Wind Tower Revenue (USD Million) By Applications (2018-2022)
Table 25 South America Wind Tower Revenue (USD Million) By Country (2018-2022)
Table 26 South America Wind Tower Revenue (USD Million) By Type (2018-2022)
Table 27 South America Wind Tower Revenue (USD Million) By Applications (2018-2022)
Table 28 Middle East and Africa Wind Tower Revenue (USD Million) By Region (2018-2022)
Table 29 Middle East and Africa Wind Tower Revenue (USD Million) By Type (2018-2022)
Table 30 Middle East and Africa Wind Tower Revenue (USD Million) By Applications (2018-2022)
Table 31 Financial Analysis
Table 32 Global Wind Tower Revenue (USD Million) By Type (2023-2030)
Table 33 Global Wind Tower Revenue Market Share (%) By Type (2023-2030)
Table 34 Global Wind Tower Revenue (USD Million) By Applications (2023-2030)
Table 35 Global Wind Tower Revenue Market Share (%) By Applications (2023-2030)
Table 36 Global Wind Tower Market Revenue (USD Million), And Revenue (USD Million) By Regions (2023-2030)
Table 37 North America Wind Tower Revenue (USD)By Country (2023-2030)
Table 38 North America Wind Tower Revenue (USD Million) By Type (2023-2030)
Table 39 North America Wind Tower Revenue (USD Million) By Applications (2023-2030)
Table 40 Europe Wind Tower Revenue (USD Million) By Country (2023-2030)
Table 41 Europe Wind Tower Revenue (USD Million) By Type (2023-2030)
Table 42 Europe Wind Tower Revenue (USD Million) By Applications (2023-2030)
Table 43 Asia Pacific Wind Tower Revenue (USD Million) By Country (2023-2030)
Table 44 Asia Pacific Wind Tower Revenue (USD Million) By Type (2023-2030)
Table 45 Asia Pacific Wind Tower Revenue (USD Million) By Applications (2023-2030)
Table 46 South America Wind Tower Revenue (USD Million) By Country (2023-2030)
Table 47 South America Wind Tower Revenue (USD Million) By Type (2023-2030)
Table 48 South America Wind Tower Revenue (USD Million) By Applications (2023-2030)
Table 49 Middle East and Africa Wind Tower Revenue (USD Million) By Region (2023-2030)
Table 50 Middle East and Africa Wind Tower Revenue (USD Million) By Region (2023-2030)
Table 51 Middle East and Africa Wind Tower Revenue (USD Million) By Type (2023-2030)
Table 52 Middle East and Africa Wind Tower Revenue (USD Million) By Applications (2023-2030)
Table 53 Research Programs/Design for This Report
Table 54 Key Data Information from Secondary Sources
Table 55 Key Data Information from Primary Sources
List of Figures
Figure 1 Market Scope
Figure 2 Porter’s Five Forces
Figure 3 Global Wind Tower Revenue (USD Million) By Type (2018-2022)
Figure 4 Global Wind Tower Revenue Market Share (%) By Type (2022)
Figure 5 Global Wind Tower Revenue (USD Million) By Applications (2018-2022)
Figure 6 Global Wind Tower Revenue Market Share (%) By Applications (2022)
Figure 7 Global Wind Tower Market Revenue (USD Million) By Regions (2018-2022)
Figure 8 Global Wind Tower Market Share (%) By Regions (2022)
Figure 9 North America Wind Tower Revenue (USD Million) By Country (2018-2022)
Figure 10 North America Wind Tower Revenue (USD Million) By Type (2018-2022)
Figure 11 North America Wind Tower Revenue (USD Million) By Applications (2018-2022)
Figure 12 Europe Wind Tower Revenue (USD Million) By Country (2018-2022)
Figure 13 Europe Wind Tower Revenue (USD Million) By Type (2018-2022)
Figure 14 Europe Wind Tower Revenue (USD Million) By Applications (2018-2022)
Figure 15 Asia Pacific Wind Tower Revenue (USD Million) By Country (2018-2022)
Figure 16 Asia Pacific Wind Tower Revenue (USD Million) By Type (2018-2022)
Figure 17 Asia Pacific Wind Tower Revenue (USD Million) By Applications (2018-2022)
Figure 18 South America Wind Tower Revenue (USD Million) By Country (2018-2022)
Figure 19 South America Wind Tower Revenue (USD Million) By Type (2018-2022)
Figure 20 South America Wind Tower Revenue (USD Million) By Applications (2018-2022)
Figure 21 Middle East and Africa Wind Tower Revenue (USD Million) By Region (2018-2022)
Figure 22 Middle East and Africa Wind Tower Revenue (USD Million) By Type (2018-2022)
Figure 23 Middle East and Africa Wind Tower Revenue (USD Million) By Applications (2018-2022)
Figure 24 Global Wind Tower Revenue (USD Million) By Type (2023-2030)
Figure 25 Global Wind Tower Revenue Market Share (%) By Type (2030)
Figure 26 Global Wind Tower Revenue (USD Million) By Applications (2023-2030)
Figure 27 Global Wind Tower Revenue Market Share (%) By Applications (2030)
Figure 28 Global Wind Tower Market Revenue (USD Million) By Regions (2023-2030)
Figure 29 North America Wind Tower Revenue (USD Million) By Country (2023-2030)
Figure 30 North America Wind Tower Revenue (USD Million) By Type (2023-2030)
Figure 31 North America Wind Tower Revenue (USD Million) By Applications (2023-2030)
Figure 32 Europe Wind Tower Revenue (USD Million) By Country (2023-2030)
Figure 33 Europe Wind Tower Revenue (USD Million) By Type (2023-2030)
Figure 34 Europe Wind Tower Revenue (USD Million) By Applications (2023-2030)
Figure 35 Asia Pacific Wind Tower Revenue (USD Million) By Country (2023-2030)
Figure 36 Asia Pacific Wind Tower Revenue (USD Million) By Type (2023-2030)
Figure 37 Asia Pacific Wind Tower Revenue (USD Million) By Applications (2023-2030)
Figure 38 South America Wind Tower Revenue (USD Million) By Country (2023-2030)
Figure 39 South America Wind Tower Revenue (USD Million) By Type (2023-2030)
Figure 40 South America Wind Tower Revenue (USD Million) By Applications (2023-2030)
Figure 41 Middle East and Africa Wind Tower Revenue (USD Million) By Region (2023-2030)
Figure 42 Middle East and Africa Wind Tower Revenue (USD Million) By Region (2023-2030)
Figure 43 Middle East and Africa Wind Tower Revenue (USD Million) By Type (2023-2030)
Figure 44 Middle East and Africa Wind Tower Revenue (USD Million) By Applications (2023-2030)
Figure 45 Bottom-Up and Top-Down Approaches For This Report
Figure 46 Data Triangulation
