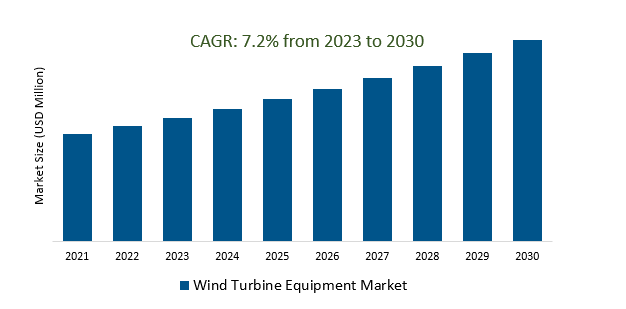
The Global Wind Turbine Equipment Market Size is estimated to register 7.2% growth over the forecast period from 2023 to 2030.
The market growth is driven by an increasing awareness of climate change and the need for sustainable energy sources is driving a global shift towards clean energy. Governments and organizations worldwide are adopting policies and initiatives to reduce carbon emissions, creating a favorable environment for the wind turbine equipment market. Leading Companies focusing on Hybrid Renewable Energy Systems, Floating Offshore Wind Farms, Digital Twin Technology, Artificial Intelligence (AI), and others to boost market shares in the industry.
Market Overview
The wind turbine equipment market is a crucial component of the growing wind energy industry. Key components include turbines, nacelles, rotor blades, and towers, driven by global initiatives promoting renewable energy. Technological advancements contribute to increased efficiency and reduced costs. The market faces challenges related to intermittency, grid integration, and environmental concerns. Future trends include the integration of wind power into hybrid energy systems, the development of floating offshore wind farms, and the increased use of digitalization and AI for monitoring and optimization.
Market Dynamics
Market Trends- Pioneering technological advancements are fundamentally altering the design and fabrication processes of wind turbines, paving the way for more efficient, reliable, and cost-effective renewable energy solutions.
Pioneering technological advancements are revolutionizing wind turbine design and fabrication processes, introducing innovations like advanced composite materials for lighter and more durable rotor blades, improved aerodynamics for increased energy capture, and digital technologies, including sensors and artificial intelligence, for real-time monitoring and predictive maintenance. These advancements aim to enhance the efficiency, reliability, and cost-effectiveness of wind turbines, thereby reducing the levelized cost of electricity (LCOE) and bolstering the competitiveness of renewable energy solutions.
Market Driver- Favorable government policies and ambitious renewable energy targets are fueling a surge in demand for wind turbine equipment, propelling the growth of the wind turbine industry.
Favorable government policies and ambitious renewable energy targets are spurring a surge in wind turbine equipment demand, driving substantial growth in the industry. Supportive regulatory frameworks, such as feed-in tariffs and tax incentives, encourage investments in wind energy projects, aligning with global goals to reduce carbon emissions and transition to cleaner energy sources. This trend, particularly strong in regions committed to sustainability, positions the wind turbine sector as a key driver in achieving environmental objectives.
Market Opportunity- As wind energy expands globally, the market for wind turbine equipment is poised for significant growth.
The global expansion of wind energy is driving substantial growth in the wind turbine equipment market. With the increasing adoption of wind power projects worldwide to meet sustainability goals, the demand for wind turbine equipment is on the rise. Particularly notable in emerging markets and regions with untapped wind resources, the development of wind farms contributes to the overall expansion of the market. The scalability and environmental benefits of wind energy position the industry for continued growth, playing a crucial role in the global shift toward cleaner and more sustainable energy solutions.
Market Share Analysis- Self-Supporting (Free-Standing) Tower Wind Turbine Equipment Market will register the fastest growth
The Global Wind Turbine Equipment Market is analyzed across Self-Supporting (Free-Standing) Tower, Guyed Tower, and others. Self-Supporting (Free-Standing) Tower is poised to register the fastest growth. The Self-Supporting (Free-Standing) Tower Wind Turbine Equipment Market focuses on wind turbines with standalone towers, distinct from lattice towers, and is crucial for the efficiency and stability of wind energy systems. This market segment encompasses the design, manufacturing, and deployment of self-supporting tower wind turbine equipment, with a particular emphasis on advancements in tower design, materials, and construction methods. It caters to the demand for innovative and robust tower solutions, contributing to the overall growth and sustainability of the wind energy sector.
Market Share Analysis- Guyed Tower held a significant market share in 2023
The Global Wind Turbine Equipment Market is analyzed across various applications including Industrial Use, Residential Use, and others. Of these, Guyed Tower held a significant market share in 2023. The Guyed Tower Wind Turbine Equipment Market is dedicated to the design, manufacturing, and deployment of wind turbines employing guyed towers. These towers rely on guy wires for stability, and the market focuses on advancements in design, materials, and construction techniques specific to this tower configuration. Key factors influencing the demand for guyed tower wind turbine equipment include innovations in structural engineering and materials technology. This market segment plays a critical role in providing solutions to enhance the performance, reliability, and efficiency of wind turbines utilizing guyed towers within the broader wind energy sector.
Wind Turbine Equipment Market Segmentation
By Type
- Self-Supporting (Free-Standing) Tower
- Guyed Tower
By Application
- Industrial Use
- Residential Use
- Others
By Region
- North America (United States, Canada, Mexico)
- Europe (Germany, France, United Kingdom, Spain, Italy, Others)
- Asia Pacific (China, India, Japan, South Korea, Australia, Others)
- Latin America (Brazil, Argentina, Others)
- Middle East and Africa (Saudi Arabia, UAE, Kuwait, Other Middle East, South Africa, Nigeria, Other Africa)
Wind Turbine Equipment Market Companies
- Vestas
- Siemens
- Suzlon
- GE Energy
- Siemens
- Mitsubishi
- Goldwind
- Senvion
- Nordex
- Valmont Industries
- Enercon
- China Ming Yang
*List not exhaustive
Wind Turbine Equipment Market Outlook 2023
1 Market Overview
1.1 Introduction to the Wind Turbine Equipment Market
1.2 Scope of the Study
1.3 Research Objective
1.3.1 Key Market Scope and Segments
1.3.2 Players Covered
1.3.3 Years Considered
2 Executive Summary
2.1 2023 Wind Turbine Equipment Industry- Market Statistics
3 Market Dynamics
3.1 Market Drivers
3.2 Market Challenges
3.3 Market Opportunities
3.4 Market Trends
4 Market Factor Analysis
4.1 Porter’s Five Forces
4.2 Market Entropy
4.2.1 Global Wind Turbine Equipment Market Companies with Area Served
4.2.2 Products Offerings Global Wind Turbine Equipment Market
5 COVID-19 Impact Analysis and Outlook Scenarios
5.1.1 Covid-19 Impact Analysis
5.1.2 post-COVID-19 Scenario- Low Growth Case
5.1.3 post-COVID-19 Scenario- Reference Growth Case
5.1.4 post-COVID-19 Scenario- Low Growth Case
6 Global Wind Turbine Equipment Market Trends
6.1 Global Wind Turbine Equipment Revenue (USD Million) and CAGR (%) by Type (2018-2030)
6.2 Global Wind Turbine Equipment Revenue (USD Million) and CAGR (%) by Applications (2018-2030)
6.3 Global Wind Turbine Equipment Revenue (USD Million) and CAGR (%) by regions (2018-2030)
7 Global Wind Turbine Equipment Market Revenue (USD Million) by Type, and Applications (2018-2022)
7.1 Global Wind Turbine Equipment Revenue (USD Million) by Type (2018-2022)
7.1.1 Global Wind Turbine Equipment Revenue (USD Million), Market Share (%) by Type (2018-2022)
7.2 Global Wind Turbine Equipment Revenue (USD Million) by Applications (2018-2022)
7.2.1 Global Wind Turbine Equipment Revenue (USD Million), Market Share (%) by Applications (2018-2022)
8 Global Wind Turbine Equipment Development Regional Status and Outlook
8.1 Global Wind Turbine Equipment Revenue (USD Million) By Regions (2018-2022)
8.2 North America Wind Turbine Equipment Revenue (USD Million) by Type, and Application (2018-2022)
8.2.1 North America Wind Turbine Equipment Revenue (USD Million) by Country (2018-2022)
8.2.2 North America Wind Turbine Equipment Revenue (USD Million) by Type (2018-2022)
8.2.3 North America Wind Turbine Equipment Revenue (USD Million) by Applications (2018-2022)
8.3 Europe Wind Turbine Equipment Revenue (USD Million), by Type, and Applications (USD Million) (2018-2022)
8.3.1 Europe Wind Turbine Equipment Revenue (USD Million), by Country (2018-2022)
8.3.2 Europe Wind Turbine Equipment Revenue (USD Million) by Type (2018-2022)
8.3.3 Europe Wind Turbine Equipment Revenue (USD Million) by Applications (2018-2022)
8.4 Asia Pacific Wind Turbine Equipment Revenue (USD Million), and Revenue (USD Million) by Type, and Applications (2018-2022)
8.4.1 Asia Pacific Wind Turbine Equipment Revenue (USD Million) by Country (2018-2022)
8.4.2 Asia Pacific Wind Turbine Equipment Revenue (USD Million) by Type (2018-2022)
8.4.3 Asia Pacific Wind Turbine Equipment Revenue (USD Million) by Applications (2018-2022)
8.5 South America Wind Turbine Equipment Revenue (USD Million), by Type, and Applications (2018-2022)
8.5.1 South America Wind Turbine Equipment Revenue (USD Million), by Country (2018-2022)
8.5.2 South America Wind Turbine Equipment Revenue (USD Million) by Type (2018-2022)
8.5.3 South America Wind Turbine Equipment Revenue (USD Million) by Applications (2018-2022)
8.6 Middle East and Africa Wind Turbine Equipment Revenue (USD Million), by Type, Technology, Application, Thickness (2018-2022)
8.6.1 Middle East and Africa Wind Turbine Equipment Revenue (USD Million) by Country (2018-2022)
8.6.2 Middle East and Africa Wind Turbine Equipment Revenue (USD Million) by Type (2018-2022)
8.6.3 Middle East and Africa Wind Turbine Equipment Revenue (USD Million) by Applications (2018-2022)
9 Company Profiles
10 Global Wind Turbine Equipment Market Revenue (USD Million), by Type, and Applications (2023-2030)
10.1 Global Wind Turbine Equipment Revenue (USD Million) and Market Share (%) by Type (2023-2030)
10.1.1 Global Wind Turbine Equipment Revenue (USD Million), and Market Share (%) by Type (2023-2030)
10.2 Global Wind Turbine Equipment Revenue (USD Million) and Market Share (%) by Applications (2023-2030)
10.2.1 Global Wind Turbine Equipment Revenue (USD Million), and Market Share (%) by Applications (2023-2030)
11 Global Wind Turbine Equipment Development Regional Status and Outlook Forecast
11.1 Global Wind Turbine Equipment Revenue (USD Million) By Regions (2023-2030)
11.2 North America Wind Turbine Equipment Revenue (USD Million) by Type, and Applications (2023-2030)
11.2.1 North America Wind Turbine Equipment Revenue (USD) Million by Country (2023-2030)
11.2.2 North America Wind Turbine Equipment Revenue (USD Million), by Type (2023-2030)
11.2.3 North America Wind Turbine Equipment Revenue (USD Million), Market Share (%) by Applications (2023-2030)
11.3 Europe Wind Turbine Equipment Revenue (USD Million), by Type, and Applications (2023-2030)
11.3.1 Europe Wind Turbine Equipment Revenue (USD Million), by Country (2023-2030)
11.3.2 Europe Wind Turbine Equipment Revenue (USD Million), by Type (2023-2030)
11.3.3 Europe Wind Turbine Equipment Revenue (USD Million), by Applications (2023-2030)
11.4 Asia Pacific Wind Turbine Equipment Revenue (USD Million) by Type, and Applications (2023-2030)
11.4.1 Asia Pacific Wind Turbine Equipment Revenue (USD Million), by Country (2023-2030)
11.4.2 Asia Pacific Wind Turbine Equipment Revenue (USD Million), by Type (2023-2030)
11.4.3 Asia Pacific Wind Turbine Equipment Revenue (USD Million), by Applications (2023-2030)
11.5 South America Wind Turbine Equipment Revenue (USD Million), by Type, and Applications (2023-2030)
11.5.1 South America Wind Turbine Equipment Revenue (USD Million), by Country (2023-2030)
11.5.2 South America Wind Turbine Equipment Revenue (USD Million), by Type (2023-2030)
11.5.3 South America Wind Turbine Equipment Revenue (USD Million), by Applications (2023-2030)
11.6 Middle East and Africa Wind Turbine Equipment Revenue (USD Million), by Type, and Applications (2023-2030)
11.6.1 Middle East and Africa Wind Turbine Equipment Revenue (USD Million), by region (2023-2030)
11.6.2 Middle East and Africa Wind Turbine Equipment Revenue (USD Million), by Type (2023-2030)
11.6.3 Middle East and Africa Wind Turbine Equipment Revenue (USD Million), by Applications (2023-2030)
12 Methodology and Data Sources
12.1 Methodology/Research Approach
12.1.1 Research Programs/Design
12.1.2 Market Size Estimation
12.1.3 Market Breakdown and Data Triangulation
12.2 Data Sources
12.2.1 Secondary Sources
12.2.2 Primary Sources
12.3 Disclaimer
List of Tables
Table 1 Market Segmentation Analysis
Table 2 Global Wind Turbine Equipment Market Companies with Areas Served
Table 3 Products Offerings Global Wind Turbine Equipment Market
Table 4 Low Growth Scenario Forecasts
Table 5 Reference Case Growth Scenario
Table 6 High Growth Case Scenario
Table 7 Global Wind Turbine Equipment Revenue (USD Million) And CAGR (%) By Type (2018-2030)
Table 8 Global Wind Turbine Equipment Revenue (USD Million) And CAGR (%) By Applications (2018-2030)
Table 9 Global Wind Turbine Equipment Revenue (USD Million) And CAGR (%) By Regions (2018-2030)
Table 10 Global Wind Turbine Equipment Revenue (USD Million) By Type (2018-2022)
Table 11 Global Wind Turbine Equipment Revenue Market Share (%) By Type (2018-2022)
Table 12 Global Wind Turbine Equipment Revenue (USD Million) By Applications (2018-2022)
Table 13 Global Wind Turbine Equipment Revenue Market Share (%) By Applications (2018-2022)
Table 14 Global Wind Turbine Equipment Market Revenue (USD Million) By Regions (2018-2022)
Table 15 Global Wind Turbine Equipment Market Share (%) By Regions (2018-2022)
Table 16 North America Wind Turbine Equipment Revenue (USD Million) By Country (2018-2022)
Table 17 North America Wind Turbine Equipment Revenue (USD Million) By Type (2018-2022)
Table 18 North America Wind Turbine Equipment Revenue (USD Million) By Applications (2018-2022)
Table 19 Europe Wind Turbine Equipment Revenue (USD Million) By Country (2018-2022)
Table 20 Europe Wind Turbine Equipment Revenue (USD Million) By Type (2018-2022)
Table 21 Europe Wind Turbine Equipment Revenue (USD Million) By Applications (2018-2022)
Table 22 Asia Pacific Wind Turbine Equipment Revenue (USD Million) By Country (2018-2022)
Table 23 Asia Pacific Wind Turbine Equipment Revenue (USD Million) By Type (2018-2022)
Table 24 Asia Pacific Wind Turbine Equipment Revenue (USD Million) By Applications (2018-2022)
Table 25 South America Wind Turbine Equipment Revenue (USD Million) By Country (2018-2022)
Table 26 South America Wind Turbine Equipment Revenue (USD Million) By Type (2018-2022)
Table 27 South America Wind Turbine Equipment Revenue (USD Million) By Applications (2018-2022)
Table 28 Middle East and Africa Wind Turbine Equipment Revenue (USD Million) By Region (2018-2022)
Table 29 Middle East and Africa Wind Turbine Equipment Revenue (USD Million) By Type (2018-2022)
Table 30 Middle East and Africa Wind Turbine Equipment Revenue (USD Million) By Applications (2018-2022)
Table 31 Financial Analysis
Table 32 Global Wind Turbine Equipment Revenue (USD Million) By Type (2023-2030)
Table 33 Global Wind Turbine Equipment Revenue Market Share (%) By Type (2023-2030)
Table 34 Global Wind Turbine Equipment Revenue (USD Million) By Applications (2023-2030)
Table 35 Global Wind Turbine Equipment Revenue Market Share (%) By Applications (2023-2030)
Table 36 Global Wind Turbine Equipment Market Revenue (USD Million), And Revenue (USD Million) By Regions (2023-2030)
Table 37 North America Wind Turbine Equipment Revenue (USD)By Country (2023-2030)
Table 38 North America Wind Turbine Equipment Revenue (USD Million) By Type (2023-2030)
Table 39 North America Wind Turbine Equipment Revenue (USD Million) By Applications (2023-2030)
Table 40 Europe Wind Turbine Equipment Revenue (USD Million) By Country (2023-2030)
Table 41 Europe Wind Turbine Equipment Revenue (USD Million) By Type (2023-2030)
Table 42 Europe Wind Turbine Equipment Revenue (USD Million) By Applications (2023-2030)
Table 43 Asia Pacific Wind Turbine Equipment Revenue (USD Million) By Country (2023-2030)
Table 44 Asia Pacific Wind Turbine Equipment Revenue (USD Million) By Type (2023-2030)
Table 45 Asia Pacific Wind Turbine Equipment Revenue (USD Million) By Applications (2023-2030)
Table 46 South America Wind Turbine Equipment Revenue (USD Million) By Country (2023-2030)
Table 47 South America Wind Turbine Equipment Revenue (USD Million) By Type (2023-2030)
Table 48 South America Wind Turbine Equipment Revenue (USD Million) By Applications (2023-2030)
Table 49 Middle East and Africa Wind Turbine Equipment Revenue (USD Million) By Region (2023-2030)
Table 50 Middle East and Africa Wind Turbine Equipment Revenue (USD Million) By Region (2023-2030)
Table 51 Middle East and Africa Wind Turbine Equipment Revenue (USD Million) By Type (2023-2030)
Table 52 Middle East and Africa Wind Turbine Equipment Revenue (USD Million) By Applications (2023-2030)
Table 53 Research Programs/Design for This Report
Table 54 Key Data Information from Secondary Sources
Table 55 Key Data Information from Primary Sources
List of Figures
Figure 1 Market Scope
Figure 2 Porter’s Five Forces
Figure 3 Global Wind Turbine Equipment Revenue (USD Million) By Type (2018-2022)
Figure 4 Global Wind Turbine Equipment Revenue Market Share (%) By Type (2022)
Figure 5 Global Wind Turbine Equipment Revenue (USD Million) By Applications (2018-2022)
Figure 6 Global Wind Turbine Equipment Revenue Market Share (%) By Applications (2022)
Figure 7 Global Wind Turbine Equipment Market Revenue (USD Million) By Regions (2018-2022)
Figure 8 Global Wind Turbine Equipment Market Share (%) By Regions (2022)
Figure 9 North America Wind Turbine Equipment Revenue (USD Million) By Country (2018-2022)
Figure 10 North America Wind Turbine Equipment Revenue (USD Million) By Type (2018-2022)
Figure 11 North America Wind Turbine Equipment Revenue (USD Million) By Applications (2018-2022)
Figure 12 Europe Wind Turbine Equipment Revenue (USD Million) By Country (2018-2022)
Figure 13 Europe Wind Turbine Equipment Revenue (USD Million) By Type (2018-2022)
Figure 14 Europe Wind Turbine Equipment Revenue (USD Million) By Applications (2018-2022)
Figure 15 Asia Pacific Wind Turbine Equipment Revenue (USD Million) By Country (2018-2022)
Figure 16 Asia Pacific Wind Turbine Equipment Revenue (USD Million) By Type (2018-2022)
Figure 17 Asia Pacific Wind Turbine Equipment Revenue (USD Million) By Applications (2018-2022)
Figure 18 South America Wind Turbine Equipment Revenue (USD Million) By Country (2018-2022)
Figure 19 South America Wind Turbine Equipment Revenue (USD Million) By Type (2018-2022)
Figure 20 South America Wind Turbine Equipment Revenue (USD Million) By Applications (2018-2022)
Figure 21 Middle East and Africa Wind Turbine Equipment Revenue (USD Million) By Region (2018-2022)
Figure 22 Middle East and Africa Wind Turbine Equipment Revenue (USD Million) By Type (2018-2022)
Figure 23 Middle East and Africa Wind Turbine Equipment Revenue (USD Million) By Applications (2018-2022)
Figure 24 Global Wind Turbine Equipment Revenue (USD Million) By Type (2023-2030)
Figure 25 Global Wind Turbine Equipment Revenue Market Share (%) By Type (2030)
Figure 26 Global Wind Turbine Equipment Revenue (USD Million) By Applications (2023-2030)
Figure 27 Global Wind Turbine Equipment Revenue Market Share (%) By Applications (2030)
Figure 28 Global Wind Turbine Equipment Market Revenue (USD Million) By Regions (2023-2030)
Figure 29 North America Wind Turbine Equipment Revenue (USD Million) By Country (2023-2030)
Figure 30 North America Wind Turbine Equipment Revenue (USD Million) By Type (2023-2030)
Figure 31 North America Wind Turbine Equipment Revenue (USD Million) By Applications (2023-2030)
Figure 32 Europe Wind Turbine Equipment Revenue (USD Million) By Country (2023-2030)
Figure 33 Europe Wind Turbine Equipment Revenue (USD Million) By Type (2023-2030)
Figure 34 Europe Wind Turbine Equipment Revenue (USD Million) By Applications (2023-2030)
Figure 35 Asia Pacific Wind Turbine Equipment Revenue (USD Million) By Country (2023-2030)
Figure 36 Asia Pacific Wind Turbine Equipment Revenue (USD Million) By Type (2023-2030)
Figure 37 Asia Pacific Wind Turbine Equipment Revenue (USD Million) By Applications (2023-2030)
Figure 38 South America Wind Turbine Equipment Revenue (USD Million) By Country (2023-2030)
Figure 39 South America Wind Turbine Equipment Revenue (USD Million) By Type (2023-2030)
Figure 40 South America Wind Turbine Equipment Revenue (USD Million) By Applications (2023-2030)
Figure 41 Middle East and Africa Wind Turbine Equipment Revenue (USD Million) By Region (2023-2030)
Figure 42 Middle East and Africa Wind Turbine Equipment Revenue (USD Million) By Region (2023-2030)
Figure 43 Middle East and Africa Wind Turbine Equipment Revenue (USD Million) By Type (2023-2030)
Figure 44 Middle East and Africa Wind Turbine Equipment Revenue (USD Million) By Applications (2023-2030)
Figure 45 Bottom-Up and Top-Down Approaches for This Report
Figure 46 Data Triangulation
