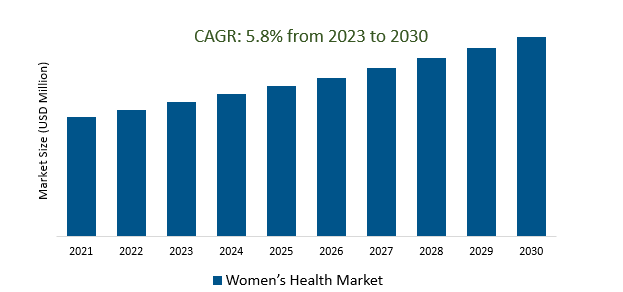
Women’s Health Market Size is estimated to register 5.8% growth over the forecast period from 2023 to 2030.
Women’s Health Market Overview
The market is driven by the increasing utilization of telehealth and digital health platforms for women's health services. The emergence of Femtech - technology specifically designed for women’s health - continues to grow the demand. Ongoing advancements in reproductive health technologies, including innovative contraceptives, fertility treatments, and menstrual health products, are revolutionizing women's reproductive choices, offering more options, efficacy, and convenience. Growing awareness among women regarding various health concerns, preventive care, and the importance of regular screenings is a significant driver. The aging population, particularly in developed countries, contributes to increased demand for women's health services. Shifts in lifestyle, including sedentary habits, stress, dietary changes, and environmental factors, contribute to health issues impacting women.
Women’s Health Market Dynamics
Market Trends- The Surge of Femtech in the Women’s Health Market
The growing emphasis on fertility tracking apps, wearable devices, and telemedicine platforms that aid in monitoring menstrual cycles, ovulation, and fertility windows are fueling the demand. From pregnancy tracking apps to wearable devices that monitor fetal health, Femtech innovations are offering comprehensive tools for expectant mothers to monitor their health and the health of their unborn child. Further, Femtech solutions addressing menopause symptoms, hormone therapies, and overall well-being during menopause are gaining traction. Additionally, rise in Femtech reflects a growing demand for women-centered healthcare solutions and a shift towards empowering women to take control of their health.
Market Driver- The Escalating Occurrence of Women-Specific Health Conditions drives the demand.
The increasing prevalence of women-specific health conditions stands as a significant driver in propelling advancements and demand within the Women’s Health Market. The greater understanding and recognition of conditions like breast cancer, cervical cancer, endometriosis, polycystic ovary syndrome (PCOS), and osteoporosis, leading to increased screening, early detection, and diagnosis are fueling the demand. Factors like hormonal imbalances, delayed pregnancies, and shifts in reproductive behaviors contribute to the prevalence of certain women-specific health conditions. Furthermore, the aging population contributes significantly to the rise in demand.
Market Opportunity- Integration of Telehealth and Digital Solutions in Women’s Health Market.
Telehealth and Digital solutions in women's healthcare is driven by increased access to healthcare professionals, remote consultations, and digital platforms offering services like menstrual tracking, fertility monitoring, and menopause management. Wearable devices designed for women's health, such as smartwatches, fitness trackers, and specialized sensors to track menstrual cycles, fertility, pregnancy progress, and monitoring vital health metrics are fueling the demand. The convenience of remote consultations, immediate access to health information, and healthcare services available at their fingertips are contributing to the market growth.
Market Share Analysis- Drugs Market the fastest-growing segment.
The Global Women’s Health Market is analyzed across Drugs, Devices & Others. Drugs Market is poised to register the fastest growth. The growth of the Drugs segment is being driven by the increasing prevalence of chronic diseases such as heart disease, cancer, and diabetes in women as they require long-term treatment with medications, which is fueling the demand for prescription drugs. Pharmaceutical companies are increasingly focusing on developing drugs that cater to the specific genetic, hormonal, and biological differences among women. Cutting-edge research on molecular biology and pharmacology enables the discovery of novel drug targets and formulations, leading to the development of more effective and safer medications. The growing societal focus on women’s well-being and healthcare equality, encouraging pharmaceutical companies to invest in developing drugs that address not only physical health conditions but also mental health concerns, reproductive wellness, and overall quality of life for women.
Market Share Analysis- Postmenopausal Osteoporosis held a significant market share in 2023.
The Global Women’s Health Market is analyzed across various applications Postmenopausal Osteoporosis, Hormonal Infertility, Endometriosis & Uterine Fibroids, Contraceptives, Menopause & Polycystic Ovary Syndrome (PCOS). Of these, Postmenopausal Osteoporosis held a significant market share in 2023. Osteoporosis is a condition characterized by a decrease in bone density, which makes bones more susceptible to fracture. This condition is primarily attributed to hormonal changes, specifically a decline in estrogen levels following menopause. Postmenopausal women are particularly at risk for osteoporosis due to the decline in estrogen levels after menopause. Common treatments include bisphosphonates, hormone therapy, selective estrogen receptor modulators (SERMs), and monoclonal antibodies designed to enhance bone density and reduce fracture risks.
Womens Health Market Segmentation
By Type
By Application
- Postmenopausal Osteoporosis
- Hormonal Infertility
- Endometriosis & Uterine Fibroids
- Contraceptives
- Menopause
- Polycystic Ovary Syndrome (PCOS)
By Age Group
By Region
- North America (United States, Canada, Mexico)
- Europe (Germany, France, United Kingdom, Spain, Italy, Others)
- Asia Pacific (China, India, Japan, South Korea, Australia, Others)
- Latin America (Brazil, Argentina, Others)
- Middle East and Africa (Saudi Arabia, UAE, Kuwait, Other Middle East, South Africa, Nigeria, Other Africa)
Womens Health Market Companies
- Bayer AG (Germany)
- Allergan (Dublin)
- Merck & Co (United States)
- Pfizer Inc (United States)
- Amgen (United States)
- Agile Therapeutics Inc (United States)
- Ferring Pharmaceuticals (United States)
- Mylan N.V. (United States)
- Lupin (India)
- Blairex Laboratories (United States)
- Apothecus Pharmaceutical (United States)
*List not exhaustive
Women’s Health Market Outlook 2023
1 Market Overview
1.1 Introduction to the Women’s Health Market
1.2 Scope of the Study
1.3 Research Objective
1.3.1 Key Market Scope and Segments
1.3.2 Players Covered
1.3.3 Years Considered
2 Executive Summary
2.1 2023 Women’s Health Industry- Market Statistics
3 Market Dynamics
3.1 Market Drivers
3.2 Market Challenges
3.3 Market Opportunities
3.4 Market Trends
4 Market Factor Analysis
4.1 Porter’s Five Forces
4.2 Market Entropy
4.2.1 Global Women’s Health Market Companies with Area Served
4.2.2 Products Offerings Global Women’s Health Market
5 COVID-19 Impact Analysis and Outlook Scenarios
5.1.1 Covid-19 Impact Analysis
5.1.2 post-COVID-19 Scenario- Low Growth Case
5.1.3 post-COVID-19 Scenario- Reference Growth Case
5.1.4 post-COVID-19 Scenario- Low Growth Case
6 Global Women’s Health Market Trends
6.1 Global Women’s Health Revenue (USD Million) and CAGR (%) by Type (2018-2030)
6.2 Global Women’s Health Revenue (USD Million) and CAGR (%) by Applications (2018-2030)
6.3 Global Women’s Health Revenue (USD Million) and CAGR (%) by regions (2018-2030)
7 Global Women’s Health Market Revenue (USD Million) by Type, and Applications (2018-2022)
7.1 Global Women’s Health Revenue (USD Million) by Type (2018-2022)
7.1.1 Global Women’s Health Revenue (USD Million), Market Share (%) by Type (2018-2022)
7.2 Global Women’s Health Revenue (USD Million) by Applications (2018-2022)
7.2.1 Global Women’s Health Revenue (USD Million), Market Share (%) by Applications (2018-2022)
8 Global Women’s Health Development Regional Status and Outlook
8.1 Global Women’s Health Revenue (USD Million) By Regions (2018-2022)
8.2 North America Women’s Health Revenue (USD Million) by Type, and Application (2018-2022)
8.2.1 North America Women’s Health Revenue (USD Million) by Country (2018-2022)
8.2.2 North America Women’s Health Revenue (USD Million) by Type (2018-2022)
8.2.3 North America Women’s Health Revenue (USD Million) by Applications (2018-2022)
8.3 Europe Women’s Health Revenue (USD Million), by Type, and Applications (USD Million) (2018-2022)
8.3.1 Europe Women’s Health Revenue (USD Million), by Country (2018-2022)
8.3.2 Europe Women’s Health Revenue (USD Million) by Type (2018-2022)
8.3.3 Europe Women’s Health Revenue (USD Million) by Applications (2018-2022)
8.4 Asia Pacific Women’s Health Revenue (USD Million), and Revenue (USD Million) by Type, and Applications (2018-2022)
8.4.1 Asia Pacific Women’s Health Revenue (USD Million) by Country (2018-2022)
8.4.2 Asia Pacific Women’s Health Revenue (USD Million) by Type (2018-2022)
8.4.3 Asia Pacific Women’s Health Revenue (USD Million) by Applications (2018-2022)
8.5 South America Women’s Health Revenue (USD Million), by Type, and Applications (2018-2022)
8.5.1 South America Women’s Health Revenue (USD Million), by Country (2018-2022)
8.5.2 South America Women’s Health Revenue (USD Million) by Type (2018-2022)
8.5.3 South America Women’s Health Revenue (USD Million) by Applications (2018-2022)
8.6 Middle East and Africa Women’s Health Revenue (USD Million), by Type, Technology, Application, Thickness (2018-2022)
8.6.1 Middle East and Africa Women’s Health Revenue (USD Million) by Country (2018-2022)
8.6.2 Middle East and Africa Women’s Health Revenue (USD Million) by Type (2018-2022)
8.6.3 Middle East and Africa Women’s Health Revenue (USD Million) by Applications (2018-2022)
9 Company Profiles
10 Global Women’s Health Market Revenue (USD Million), by Type, and Applications (2023-2030)
10.1 Global Women’s Health Revenue (USD Million) and Market Share (%) by Type (2023-2030)
10.1.1 Global Women’s Health Revenue (USD Million), and Market Share (%) by Type (2023-2030)
10.2 Global Women’s Health Revenue (USD Million) and Market Share (%) by Applications (2023-2030)
10.2.1 Global Women’s Health Revenue (USD Million), and Market Share (%) by Applications (2023-2030)
11 Global Women’s Health Development Regional Status and Outlook Forecast
11.1 Global Women’s Health Revenue (USD Million) By Regions (2023-2030)
11.2 North America Women’s Health Revenue (USD Million) by Type, and Applications (2023-2030)
11.2.1 North America Women’s Health Revenue (USD) Million by Country (2023-2030)
11.2.2 North America Women’s Health Revenue (USD Million), by Type (2023-2030)
11.2.3 North America Women’s Health Revenue (USD Million), Market Share (%) by Applications (2023-2030)
11.3 Europe Women’s Health Revenue (USD Million), by Type, and Applications (2023-2030)
11.3.1 Europe Women’s Health Revenue (USD Million), by Country (2023-2030)
11.3.2 Europe Women’s Health Revenue (USD Million), by Type (2023-2030)
11.3.3 Europe Women’s Health Revenue (USD Million), by Applications (2023-2030)
11.4 Asia Pacific Women’s Health Revenue (USD Million) by Type, and Applications (2023-2030)
11.4.1 Asia Pacific Women’s Health Revenue (USD Million), by Country (2023-2030)
11.4.2 Asia Pacific Women’s Health Revenue (USD Million), by Type (2023-2030)
11.4.3 Asia Pacific Women’s Health Revenue (USD Million), by Applications (2023-2030)
11.5 South America Women’s Health Revenue (USD Million), by Type, and Applications (2023-2030)
11.5.1 South America Women’s Health Revenue (USD Million), by Country (2023-2030)
11.5.2 South America Women’s Health Revenue (USD Million), by Type (2023-2030)
11.5.3 South America Women’s Health Revenue (USD Million), by Applications (2023-2030)
11.6 Middle East and Africa Women’s Health Revenue (USD Million), by Type, and Applications (2023-2030)
11.6.1 Middle East and Africa Women’s Health Revenue (USD Million), by region (2023-2030)
11.6.2 Middle East and Africa Women’s Health Revenue (USD Million), by Type (2023-2030)
11.6.3 Middle East and Africa Women’s Health Revenue (USD Million), by Applications (2023-2030)
12 Methodology and Data Sources
12.1 Methodology/Research Approach
12.1.1 Research Programs/Design
12.1.2 Market Size Estimation
12.1.3 Market Breakdown and Data Triangulation
12.2 Data Sources
12.2.1 Secondary Sources
12.2.2 Primary Sources
12.3 Disclaimer
List of Tables
Table 1 Market Segmentation Analysis
Table 2 Global Women’s Health Market Companies with Areas Served
Table 3 Products Offerings Global Women’s Health Market
Table 4 Low Growth Scenario Forecasts
Table 5 Reference Case Growth Scenario
Table 6 High Growth Case Scenario
Table 7 Global Women’s Health Revenue (USD Million) And CAGR (%) By Type (2018-2030)
Table 8 Global Women’s Health Revenue (USD Million) And CAGR (%) By Applications (2018-2030)
Table 9 Global Women’s Health Revenue (USD Million) And CAGR (%) By Regions (2018-2030)
Table 10 Global Women’s Health Revenue (USD Million) By Type (2018-2022)
Table 11 Global Women’s Health Revenue Market Share (%) By Type (2018-2022)
Table 12 Global Women’s Health Revenue (USD Million) By Applications (2018-2022)
Table 13 Global Women’s Health Revenue Market Share (%) By Applications (2018-2022)
Table 14 Global Women’s Health Market Revenue (USD Million) By Regions (2018-2022)
Table 15 Global Women’s Health Market Share (%) By Regions (2018-2022)
Table 16 North America Women’s Health Revenue (USD Million) By Country (2018-2022)
Table 17 North America Women’s Health Revenue (USD Million) By Type (2018-2022)
Table 18 North America Women’s Health Revenue (USD Million) By Applications (2018-2022)
Table 19 Europe Women’s Health Revenue (USD Million) By Country (2018-2022)
Table 20 Europe Women’s Health Revenue (USD Million) By Type (2018-2022)
Table 21 Europe Women’s Health Revenue (USD Million) By Applications (2018-2022)
Table 22 Asia Pacific Women’s Health Revenue (USD Million) By Country (2018-2022)
Table 23 Asia Pacific Women’s Health Revenue (USD Million) By Type (2018-2022)
Table 24 Asia Pacific Women’s Health Revenue (USD Million) By Applications (2018-2022)
Table 25 South America Women’s Health Revenue (USD Million) By Country (2018-2022)
Table 26 South America Women’s Health Revenue (USD Million) By Type (2018-2022)
Table 27 South America Women’s Health Revenue (USD Million) By Applications (2018-2022)
Table 28 Middle East and Africa Women’s Health Revenue (USD Million) By Region (2018-2022)
Table 29 Middle East and Africa Women’s Health Revenue (USD Million) By Type (2018-2022)
Table 30 Middle East and Africa Women’s Health Revenue (USD Million) By Applications (2018-2022)
Table 31 Financial Analysis
Table 32 Global Women’s Health Revenue (USD Million) By Type (2023-2030)
Table 33 Global Women’s Health Revenue Market Share (%) By Type (2023-2030)
Table 34 Global Women’s Health Revenue (USD Million) By Applications (2023-2030)
Table 35 Global Women’s Health Revenue Market Share (%) By Applications (2023-2030)
Table 36 Global Women’s Health Market Revenue (USD Million), And Revenue (USD Million) By Regions (2023-2030)
Table 37 North America Women’s Health Revenue (USD)By Country (2023-2030)
Table 38 North America Women’s Health Revenue (USD Million) By Type (2023-2030)
Table 39 North America Women’s Health Revenue (USD Million) By Applications (2023-2030)
Table 40 Europe Women’s Health Revenue (USD Million) By Country (2023-2030)
Table 41 Europe Women’s Health Revenue (USD Million) By Type (2023-2030)
Table 42 Europe Women’s Health Revenue (USD Million) By Applications (2023-2030)
Table 43 Asia Pacific Women’s Health Revenue (USD Million) By Country (2023-2030)
Table 44 Asia Pacific Women’s Health Revenue (USD Million) By Type (2023-2030)
Table 45 Asia Pacific Women’s Health Revenue (USD Million) By Applications (2023-2030)
Table 46 South America Women’s Health Revenue (USD Million) By Country (2023-2030)
Table 47 South America Women’s Health Revenue (USD Million) By Type (2023-2030)
Table 48 South America Women’s Health Revenue (USD Million) By Applications (2023-2030)
Table 49 Middle East and Africa Women’s Health Revenue (USD Million) By Region (2023-2030)
Table 50 Middle East and Africa Women’s Health Revenue (USD Million) By Region (2023-2030)
Table 51 Middle East and Africa Women’s Health Revenue (USD Million) By Type (2023-2030)
Table 52 Middle East and Africa Women’s Health Revenue (USD Million) By Applications (2023-2030)
Table 53 Research Programs/Design for This Report
Table 54 Key Data Information from Secondary Sources
Table 55 Key Data Information from Primary Sources
List of Figures
Figure 1 Market Scope
Figure 2 Porter’s Five Forces
Figure 3 Global Women’s Health Revenue (USD Million) By Type (2018-2022)
Figure 4 Global Women’s Health Revenue Market Share (%) By Type (2022)
Figure 5 Global Women’s Health Revenue (USD Million) By Applications (2018-2022)
Figure 6 Global Women’s Health Revenue Market Share (%) By Applications (2022)
Figure 7 Global Women’s Health Market Revenue (USD Million) By Regions (2018-2022)
Figure 8 Global Women’s Health Market Share (%) By Regions (2022)
Figure 9 North America Women’s Health Revenue (USD Million) By Country (2018-2022)
Figure 10 North America Women’s Health Revenue (USD Million) By Type (2018-2022)
Figure 11 North America Women’s Health Revenue (USD Million) By Applications (2018-2022)
Figure 12 Europe Women’s Health Revenue (USD Million) By Country (2018-2022)
Figure 13 Europe Women’s Health Revenue (USD Million) By Type (2018-2022)
Figure 14 Europe Women’s Health Revenue (USD Million) By Applications (2018-2022)
Figure 15 Asia Pacific Women’s Health Revenue (USD Million) By Country (2018-2022)
Figure 16 Asia Pacific Women’s Health Revenue (USD Million) By Type (2018-2022)
Figure 17 Asia Pacific Women’s Health Revenue (USD Million) By Applications (2018-2022)
Figure 18 South America Women’s Health Revenue (USD Million) By Country (2018-2022)
Figure 19 South America Women’s Health Revenue (USD Million) By Type (2018-2022)
Figure 20 South America Women’s Health Revenue (USD Million) By Applications (2018-2022)
Figure 21 Middle East and Africa Women’s Health Revenue (USD Million) By Region (2018-2022)
Figure 22 Middle East and Africa Women’s Health Revenue (USD Million) By Type (2018-2022)
Figure 23 Middle East and Africa Women’s Health Revenue (USD Million) By Applications (2018-2022)
Figure 24 Global Women’s Health Revenue (USD Million) By Type (2023-2030)
Figure 25 Global Women’s Health Revenue Market Share (%) By Type (2030)
Figure 26 Global Women’s Health Revenue (USD Million) By Applications (2023-2030)
Figure 27 Global Women’s Health Revenue Market Share (%) By Applications (2030)
Figure 28 Global Women’s Health Market Revenue (USD Million) By Regions (2023-2030)
Figure 29 North America Women’s Health Revenue (USD Million) By Country (2023-2030)
Figure 30 North America Women’s Health Revenue (USD Million) By Type (2023-2030)
Figure 31 North America Women’s Health Revenue (USD Million) By Applications (2023-2030)
Figure 32 Europe Women’s Health Revenue (USD Million) By Country (2023-2030)
Figure 33 Europe Women’s Health Revenue (USD Million) By Type (2023-2030)
Figure 34 Europe Women’s Health Revenue (USD Million) By Applications (2023-2030)
Figure 35 Asia Pacific Women’s Health Revenue (USD Million) By Country (2023-2030)
Figure 36 Asia Pacific Women’s Health Revenue (USD Million) By Type (2023-2030)
Figure 37 Asia Pacific Women’s Health Revenue (USD Million) By Applications (2023-2030)
Figure 38 South America Women’s Health Revenue (USD Million) By Country (2023-2030)
Figure 39 South America Women’s Health Revenue (USD Million) By Type (2023-2030)
Figure 40 South America Women’s Health Revenue (USD Million) By Applications (2023-2030)
Figure 41 Middle East and Africa Women’s Health Revenue (USD Million) By Region (2023-2030)
Figure 42 Middle East and Africa Women’s Health Revenue (USD Million) By Region (2023-2030)
Figure 43 Middle East and Africa Women’s Health Revenue (USD Million) By Type (2023-2030)
Figure 44 Middle East and Africa Women’s Health Revenue (USD Million) By Applications (2023-2030)
Figure 45 Bottom-Up and Top-Down Approaches for This Report
Figure 46 Data Triangulation
