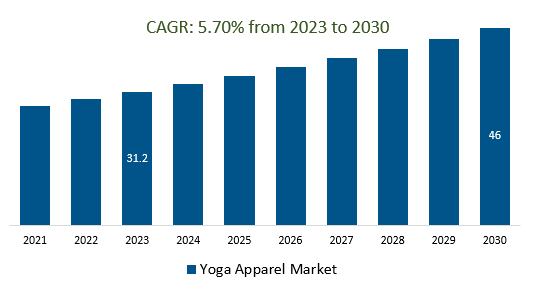
The global Yoga Apparel Systems Market Size is estimated to be US$ 31.2 Billion in 2023 and is poised to register 5.70% growth over the forecast period from 2023 to 2030 to reach US$ 46 Billion in 2030.
The market growth is increasing becoming health-conscious and recognizing the benefits of yoga and physical activity, and the demand for yoga apparel has increased. People are seeking comfortable and functional clothing to enhance their yoga practice. Leading companies are focusing on Technological Innovations, Integration of Smart Technology, Hybrid Apparel for Versatility, Global Expansion, Influencer and Celebrity Collaborations, and others to boost market shares in the industry.
Market Overview
The Yoga Apparel Market has surged due to the growing interest in wellness, offering specialized and versatile clothing tailored for yoga movements. Athleisure trends have blurred the line between workout wear and daily attire, driving expansion. Sustainability is a key focus, pushing brands toward eco-friendly materials and ethical production. Innovative fabrics provide enhanced performance, while inclusivity and customization are also prominent. With technology integration and a focus on comfort and style, the market's growth is driven by wellness prioritization and the need for adaptable clothing solutions.
Market Dynamics
Market Trends: Companies are launching Growing Health and Wellness Awareness to attract a consumer base
The Yoga Apparel Market is thriving on the back of the increasing awareness of health and wellness. As individuals embrace healthier lifestyles, the demand for yoga apparel has surged. This trend is fueled by the recognition of yoga as a holistic practice that enhances physical fitness and mental well-being. Consumers are seeking comfortable and functional clothing that complements their yoga routines and offers a seamless blend of style and performance. This growing health consciousness has not only expanded the market but has also catalyzed the development of innovative fabrics and designs, pushing brands to provide clothing that supports various yoga postures and movements.
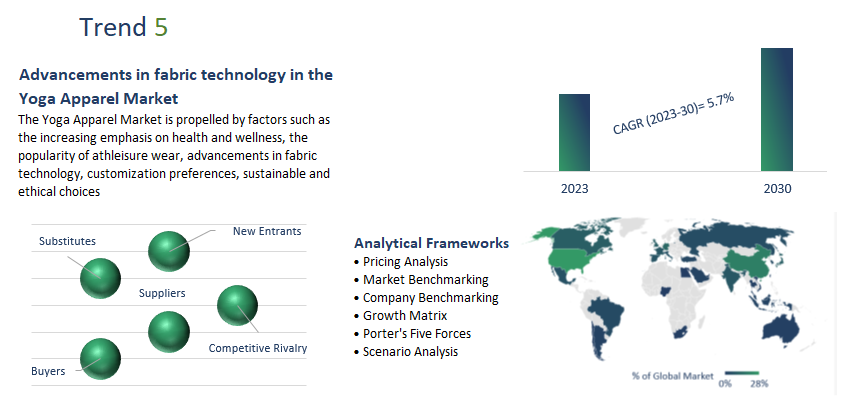
Market Drivers: Advancements in fabric technology in the Yoga Apparel Market
The Yoga Apparel Market is propelled by factors such as the increasing emphasis on health and wellness, the popularity of athleisure wear, advancements in fabric technology, customization preferences, sustainable and ethical choices, the growth of e-commerce, influencer marketing, the emerging men's yoga apparel segment, virtual workout trends, cultural and fashion influences, and the demand from global wellness tourism. These drivers collectively contribute to the market's expansion and evolution to meet the diverse demands of health-conscious consumers seeking comfortable, functional, and stylish yoga clothing.
Market opportunity: -Introduction of Virtual Workouts and Home Fitness
Virtual workouts and home fitness have significantly impacted the Yoga Apparel Market shift towards online yoga classes and home-based exercise routines, there's an increased demand for yoga apparel that offers both comfort and functionality. Consumers are seeking clothing that allows for a full range of movement and supports various poses, making fabric stretchability and moisture-wicking properties crucial. As virtual workouts enable individuals to practice yoga from the comfort of their homes, the need for versatile activewear that seamlessly transitions between workouts and daily activities has grown. This trend has prompted yoga apparel brands to cater to the specific needs of home fitness enthusiasts, driving innovation in design and materials to enhance the virtual yoga experience.
Market Segmentation
Specialty Stores: The yoga apparel market has specialty stores that play a crucial role in catering to the specific needs and preferences of yoga enthusiasts. These stores focus exclusively on yoga-related clothing, accessories, and gear, providing a curated selection for individuals who are dedicated to their yoga practice. The specialty store types within the yoga apparel market are Yoga Studios with Retail, Yoga Boutiques, Yoga Fashion Retailers, Online Yoga Retailers, Custom Yoga Apparel Stores, and Yoga Festival Marketplaces.
Supermarkets/Hypermarkets: Supermarkets and hypermarkets are designed to offer a broad range of products to cater to a diverse customer base. Their focus is on providing convenience and a one-stop shopping experience, which might not align well with the targeted and specialized nature of the yoga apparel market.
Segmentation
By Application
By Product Type
By Distribution Channel
By Region
- North America (United States, Canada, Mexico)
- Europe (Germany, France, United Kingdom, Spain, Italy, Others)
- Asia Pacific (China, India, Japan, South Korea, Australia, Others)
- Latin America (Brazil, Argentina, Others)
- Middle East and Africa (Saudi Arabia, UAE, Kuwait, Other Middle East, South Africa, Nigeria, Other Africa)
Key Players
Leading companies profiled in the study include-
- Lululemon athletica
- Green Apple Active
- Hugger Mugger Yoga Products
- Alo Yoga
- Puma SE
- Hosa Yoga
- Athleta
- Inner Waves
- Lily Lotus
- Mika Yoga Wear
- Shining Shatk
- Hugger Mugger
Yoga Apparel Systems Market Outlook 2023
1 Market Overview
1.1 Introduction to Yoga Apparel Systems Market
1.2 Scope of the Study
1.3 Research Objective
1.3.1 Key Market Scope and Segments
1.3.2 Players Covered
1.3.3 Years Considered
2 Executive Summary
2.1 2023 Yoga Apparel Systems Industry- Market Statistics
3 Market Dynamics
3.1 Market Drivers
3.2 Market Challenges
3.3 Market Opportunities
3.4 Market Trends
4 Market Factor Analysis
4.1 Porter’s Five Forces
4.2 Market Entropy
4.2.1 Global Yoga Apparel Systems Market Companies with Area Served
4.2.2 Products Offerings Global Yoga Apparel Systems Market
5 COVID-19 Impact Analysis and Outlook Scenarios
5.1.1 Covid-19 Impact Analysis
5.1.2 Post-COVID-19 Scenario- Low Growth Case
5.1.3 Post-COVID-19 Scenario- Reference Growth Case
5.1.4 Post-COVID-19 Scenario- Low Growth Case
6 Global Yoga Apparel Systems Market Trends
6.1 Global Yoga Apparel Systems Revenue (USD Million) and CAGR (%) by Type (2018-2030)
6.2 Global Yoga Apparel Systems Revenue (USD Million) and CAGR (%) by Applications (2018-2030)
6.3 Global Yoga Apparel Systems Revenue (USD Million) and CAGR (%) by Regions (2018-2030)
7 Global Yoga Apparel Systems Market Revenue (USD Million) by Type, and Applications (2018-2022)
7.1 Global Yoga Apparel Systems Revenue (USD Million) by Type (2018-2022)
7.1.1 Global Yoga Apparel Systems Revenue (USD Million), Market Share (%) by Type (2018-2022)
7.2 Global Yoga Apparel Systems Revenue (USD Million) by Applications (2018-2022)
7.2.1 Global Yoga Apparel Systems Revenue (USD Million), Market Share (%) by Applications (2018-2022)
8 Global Yoga Apparel Systems Development Regional Status and Outlook
8.1 Global Yoga Apparel Systems Revenue (USD Million) By Regions (2018-2022)
8.2 North America Yoga Apparel Systems Revenue (USD Million) by Type, and Application (2018-2022)
8.2.1 North America Yoga Apparel Systems Revenue (USD Million) by Country (2018-2022)
8.2.2 North America Yoga Apparel Systems Revenue (USD Million) by Type (2018-2022)
8.2.3 North America Yoga Apparel Systems Revenue (USD Million) by Applications (2018-2022)
8.3 Europe Yoga Apparel Systems Revenue (USD Million), by Type, and Applications (USD Million) (2018-2022)
8.3.1 Europe Yoga Apparel Systems Revenue (USD Million), by Country (2018-2022)
8.3.2 Europe Yoga Apparel Systems Revenue (USD Million) by Type (2018-2022)
8.3.3 Europe Yoga Apparel Systems Revenue (USD Million) by Applications (2018-2022)
8.4 Asia Pacific Yoga Apparel Systems Revenue (USD Million), and Revenue (USD Million) by Type, and Applications (2018-2022)
8.4.1 Asia Pacific Yoga Apparel Systems Revenue (USD Million) by Country (2018-2022)
8.4.2 Asia Pacific Yoga Apparel Systems Revenue (USD Million) by Type (2018-2022)
8.4.3 Asia Pacific Yoga Apparel Systems Revenue (USD Million) by Applications (2018-2022)
8.5 South America Yoga Apparel Systems Revenue (USD Million), by Type, and Applications (2018-2022)
8.5.1 South America Yoga Apparel Systems Revenue (USD Million), by Country (2018-2022)
8.5.2 South America Yoga Apparel Systems Revenue (USD Million) by Type (2018-2022)
8.5.3 South America Yoga Apparel Systems Revenue (USD Million) by Applications (2018-2022)
8.6 Middle East and Africa Yoga Apparel Systems Revenue (USD Million), by Type, Technology, Application, Thickness (2018-2022)
8.6.1 Middle East and Africa Yoga Apparel Systems Revenue (USD Million) by Country (2018-2022)
8.6.2 Middle East and Africa Yoga Apparel Systems Revenue (USD Million) by Type (2018-2022)
8.6.3 Middle East and Africa Yoga Apparel Systems Revenue (USD Million) by Applications (2018-2022)
9 Company Profiles
10 Global Yoga Apparel Systems Market Revenue (USD Million), by Type, and Applications (2023-2030)
10.1 Global Yoga Apparel Systems Revenue (USD Million) and Market Share (%) by Type (2023-2030)
10.1.1 Global Yoga Apparel Systems Revenue (USD Million), and Market Share (%) by Type (2023-2030)
10.2 Global Yoga Apparel Systems Revenue (USD Million) and Market Share (%) by Applications (2023-2030)
10.2.1 Global Yoga Apparel Systems Revenue (USD Million), and Market Share (%) by Applications (2023-2030)
11 Global Yoga Apparel Systems Development Regional Status and Outlook Forecast
11.1 Global Yoga Apparel Systems Revenue (USD Million) By Regions (2023-2030)
11.2 North America Yoga Apparel Systems Revenue (USD Million) by Type, and Applications (2023-2030)
11.2.1 North America Yoga Apparel Systems Revenue (USD) Million by Country (2023-2030)
11.2.2 North America Yoga Apparel Systems Revenue (USD Million), by Type (2023-2030)
11.2.3 North America Yoga Apparel Systems Revenue (USD Million), Market Share (%) by Applications (2023-2030)
11.3 Europe Yoga Apparel Systems Revenue (USD Million), by Type, and Applications (2023-2030)
11.3.1 Europe Yoga Apparel Systems Revenue (USD Million), by Country (2023-2030)
11.3.2 Europe Yoga Apparel Systems Revenue (USD Million), by Type (2023-2030)
11.3.3 Europe Yoga Apparel Systems Revenue (USD Million), by Applications (2023-2030)
11.4 Asia Pacific Yoga Apparel Systems Revenue (USD Million) by Type, and Applications (2023-2030)
11.4.1 Asia Pacific Yoga Apparel Systems Revenue (USD Million), by Country (2023-2030)
11.4.2 Asia Pacific Yoga Apparel Systems Revenue (USD Million), by Type (2023-2030)
11.4.3 Asia Pacific Yoga Apparel Systems Revenue (USD Million), by Applications (2023-2030)
11.5 South America Yoga Apparel Systems Revenue (USD Million), by Type, and Applications (2023-2030)
11.5.1 South America Yoga Apparel Systems Revenue (USD Million), by Country (2023-2030)
11.5.2 South America Yoga Apparel Systems Revenue (USD Million), by Type (2023-2030)
11.5.3 South America Yoga Apparel Systems Revenue (USD Million), by Applications (2023-2030)
11.6 Middle East and Africa Yoga Apparel Systems Revenue (USD Million), by Type, and Applications (2023-2030)
11.6.1 Middle East and Africa Yoga Apparel Systems Revenue (USD Million), by Region (2023-2030)
11.6.2 Middle East and Africa Yoga Apparel Systems Revenue (USD Million), by Type (2023-2030)
11.6.3 Middle East and Africa Yoga Apparel Systems Revenue (USD Million), by Applications (2023-2030)
12 Methodology and Data Sources
12.1 Methodology/Research Approach
12.1.1 Research Programs/Design
12.1.2 Market Size Estimation
12.1.3 Market Breakdown and Data Triangulation
12.2 Data Sources
12.2.1 Secondary Sources
12.2.2 Primary Sources
12.3 Disclaimer
List Of Tables
Table 1 Market Segmentation Analysis
Table 2 Global Yoga Apparel Systems Market Companies with Areas Served
Table 3 Products Offerings Global Yoga Apparel Systems Market
Table 4 Low Growth Scenario Forecasts
Table 5 Reference Case Growth Scenario
Table 6 High Growth Case Scenario
Table 7 Global Yoga Apparel Systems Revenue (USD Million) And CAGR (%) By Type (2018-2030)
Table 8 Global Yoga Apparel Systems Revenue (USD Million) And CAGR (%) By Applications (2018-2030)
Table 9 Global Yoga Apparel Systems Revenue (USD Million) And CAGR (%) By Regions (2018-2030)
Table 10 Global Yoga Apparel Systems Revenue (USD Million) By Type (2018-2022)
Table 11 Global Yoga Apparel Systems Revenue Market Share (%) By Type (2018-2022)
Table 12 Global Yoga Apparel Systems Revenue (USD Million) By Applications (2018-2022)
Table 13 Global Yoga Apparel Systems Revenue Market Share (%) By Applications (2018-2022)
Table 14 Global Yoga Apparel Systems Market Revenue (USD Million) By Regions (2018-2022)
Table 15 Global Yoga Apparel Systems Market Share (%) By Regions (2018-2022)
Table 16 North America Yoga Apparel Systems Revenue (USD Million) By Country (2018-2022)
Table 17 North America Yoga Apparel Systems Revenue (USD Million) By Type (2018-2022)
Table 18 North America Yoga Apparel Systems Revenue (USD Million) By Applications (2018-2022)
Table 19 Europe Yoga Apparel Systems Revenue (USD Million) By Country (2018-2022)
Table 20 Europe Yoga Apparel Systems Revenue (USD Million) By Type (2018-2022)
Table 21 Europe Yoga Apparel Systems Revenue (USD Million) By Applications (2018-2022)
Table 22 Asia Pacific Yoga Apparel Systems Revenue (USD Million) By Country (2018-2022)
Table 23 Asia Pacific Yoga Apparel Systems Revenue (USD Million) By Type (2018-2022)
Table 24 Asia Pacific Yoga Apparel Systems Revenue (USD Million) By Applications (2018-2022)
Table 25 South America Yoga Apparel Systems Revenue (USD Million) By Country (2018-2022)
Table 26 South America Yoga Apparel Systems Revenue (USD Million) By Type (2018-2022)
Table 27 South America Yoga Apparel Systems Revenue (USD Million) By Applications (2018-2022)
Table 28 Middle East and Africa Yoga Apparel Systems Revenue (USD Million) By Region (2018-2022)
Table 29 Middle East and Africa Yoga Apparel Systems Revenue (USD Million) By Type (2018-2022)
Table 30 Middle East and Africa Yoga Apparel Systems Revenue (USD Million) By Applications (2018-2022)
Table 31 Financial Analysis
Table 32 Global Yoga Apparel Systems Revenue (USD Million) By Type (2023-2030)
Table 33 Global Yoga Apparel Systems Revenue Market Share (%) By Type (2023-2030)
Table 34 Global Yoga Apparel Systems Revenue (USD Million) By Applications (2023-2030)
Table 35 Global Yoga Apparel Systems Revenue Market Share (%) By Applications (2023-2030)
Table 36 Global Yoga Apparel Systems Market Revenue (USD Million), And Revenue (USD Million) By Regions (2023-2030)
Table 37 North America Yoga Apparel Systems Revenue (USD)By Country (2023-2030)
Table 38 North America Yoga Apparel Systems Revenue (USD Million) By Type (2023-2030)
Table 39 North America Yoga Apparel Systems Revenue (USD Million) By Applications (2023-2030)
Table 40 Europe Yoga Apparel Systems Revenue (USD Million) By Country (2023-2030)
Table 41 Europe Yoga Apparel Systems Revenue (USD Million) By Type (2023-2030)
Table 42 Europe Yoga Apparel Systems Revenue (USD Million) By Applications (2023-2030)
Table 43 Asia Pacific Yoga Apparel Systems Revenue (USD Million) By Country (2023-2030)
Table 44 Asia Pacific Yoga Apparel Systems Revenue (USD Million) By Type (2023-2030)
Table 45 Asia Pacific Yoga Apparel Systems Revenue (USD Million) By Applications (2023-2030)
Table 46 South America Yoga Apparel Systems Revenue (USD Million) By Country (2023-2030)
Table 47 South America Yoga Apparel Systems Revenue (USD Million) By Type (2023-2030)
Table 48 South America Yoga Apparel Systems Revenue (USD Million) By Applications (2023-2030)
Table 49 Middle East and Africa Yoga Apparel Systems Revenue (USD Million) By Region (2023-2030)
Table 50 Middle East and Africa Yoga Apparel Systems Revenue (USD Million) By Region (2023-2030)
Table 51 Middle East and Africa Yoga Apparel Systems Revenue (USD Million) By Type (2023-2030)
Table 52 Middle East and Africa Yoga Apparel Systems Revenue (USD Million) By Applications (2023-2030)
Table 53 Research Programs/Design for This Report
Table 54 Key Data Information from Secondary Sources
Table 55 Key Data Information from Primary Sources
List Of Figures
Figure 1 Market Scope
Figure 2 Porter’s Five Forces
Figure 3 Global Yoga Apparel Systems Revenue (USD Million) By Type (2018-2022)
Figure 4 Global Yoga Apparel Systems Revenue Market Share (%) By Type (2022)
Figure 5 Global Yoga Apparel Systems Revenue (USD Million) By Applications (2018-2022)
Figure 6 Global Yoga Apparel Systems Revenue Market Share (%) By Applications (2022)
Figure 7 Global Yoga Apparel Systems Market Revenue (USD Million) By Regions (2018-2022)
Figure 8 Global Yoga Apparel Systems Market Share (%) By Regions (2022)
Figure 9 North America Yoga Apparel Systems Revenue (USD Million) By Country (2018-2022)
Figure 10 North America Yoga Apparel Systems Revenue (USD Million) By Type (2018-2022)
Figure 11 North America Yoga Apparel Systems Revenue (USD Million) By Applications (2018-2022)
Figure 12 Europe Yoga Apparel Systems Revenue (USD Million) By Country (2018-2022)
Figure 13 Europe Yoga Apparel Systems Revenue (USD Million) By Type (2018-2022)
Figure 14 Europe Yoga Apparel Systems Revenue (USD Million) By Applications (2018-2022)
Figure 15 Asia Pacific Yoga Apparel Systems Revenue (USD Million) By Country (2018-2022)
Figure 16 Asia Pacific Yoga Apparel Systems Revenue (USD Million) By Type (2018-2022)
Figure 17 Asia Pacific Yoga Apparel Systems Revenue (USD Million) By Applications (2018-2022)
Figure 18 South America Yoga Apparel Systems Revenue (USD Million) By Country (2018-2022)
Figure 19 South America Yoga Apparel Systems Revenue (USD Million) By Type (2018-2022)
Figure 20 South America Yoga Apparel Systems Revenue (USD Million) By Applications (2018-2022)
Figure 21 Middle East and Africa Yoga Apparel Systems Revenue (USD Million) By Region (2018-2022)
Figure 22 Middle East and Africa Yoga Apparel Systems Revenue (USD Million) By Type (2018-2022)
Figure 23 Middle East and Africa Yoga Apparel Systems Revenue (USD Million) By Applications (2018-2022)
Figure 24 Global Yoga Apparel Systems Revenue (USD Million) By Type (2023-2030)
Figure 25 Global Yoga Apparel Systems Revenue Market Share (%) By Type (2030)
Figure 26 Global Yoga Apparel Systems Revenue (USD Million) By Applications (2023-2030)
Figure 27 Global Yoga Apparel Systems Revenue Market Share (%) By Applications (2030)
Figure 28 Global Yoga Apparel Systems Market Revenue (USD Million) By Regions (2023-2030)
Figure 29 North America Yoga Apparel Systems Revenue (USD Million) By Country (2023-2030)
Figure 30 North America Yoga Apparel Systems Revenue (USD Million) By Type (2023-2030)
Figure 31 North America Yoga Apparel Systems Revenue (USD Million) By Applications (2023-2030)
Figure 32 Europe Yoga Apparel Systems Revenue (USD Million) By Country (2023-2030)
Figure 33 Europe Yoga Apparel Systems Revenue (USD Million) By Type (2023-2030)
Figure 34 Europe Yoga Apparel Systems Revenue (USD Million) By Applications (2023-2030)
Figure 35 Asia Pacific Yoga Apparel Systems Revenue (USD Million) By Country (2023-2030)
Figure 36 Asia Pacific Yoga Apparel Systems Revenue (USD Million) By Type (2023-2030)
Figure 37 Asia Pacific Yoga Apparel Systems Revenue (USD Million) By Applications (2023-2030)
Figure 38 South America Yoga Apparel Systems Revenue (USD Million) By Country (2023-2030)
Figure 39 South America Yoga Apparel Systems Revenue (USD Million) By Type (2023-2030)
Figure 40 South America Yoga Apparel Systems Revenue (USD Million) By Applications (2023-2030)
Figure 41 Middle East and Africa Yoga Apparel Systems Revenue (USD Million) By Region (2023-2030)
Figure 42 Middle East and Africa Yoga Apparel Systems Revenue (USD Million) By Region (2023-2030)
Figure 43 Middle East and Africa Yoga Apparel Systems Revenue (USD Million) By Type (2023-2030)
Figure 44 Middle East and Africa Yoga Apparel Systems Revenue (USD Million) By Applications (2023-2030)
Figure 45 Bottom-Up and Top-Down Approaches For This Report
Figure 46 Data Triangulation
