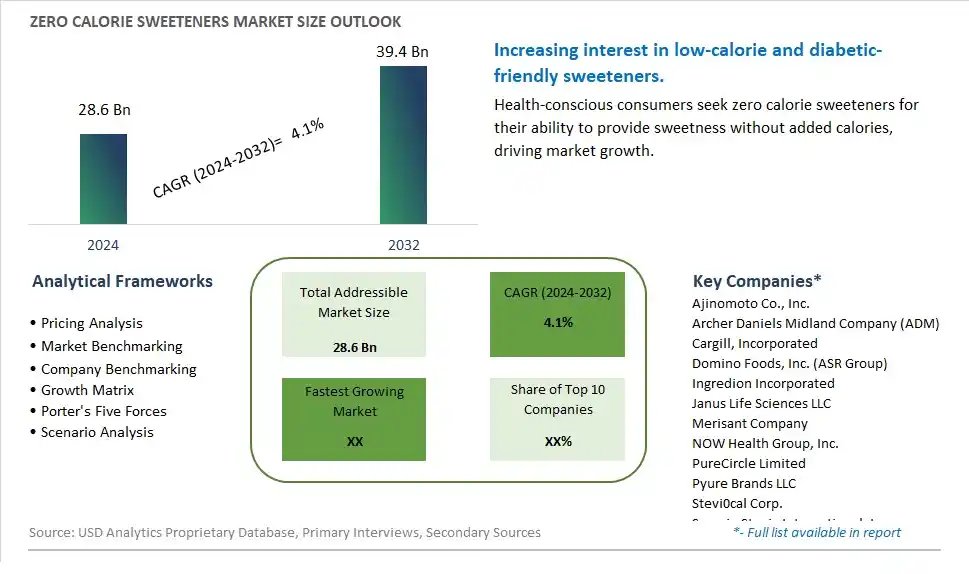
Global Zero Calorie Sweeteners Market Size is valued at $28.6 Billion in 2024 and is forecast to register a growth rate (CAGR) of 4.1% to reach $39.4 Billion by 2032.
The global Zero Calorie Sweeteners Market Comprehensive Study analyzes and forecasts the market size across 6 regions and 24 countries for diverse segments -By Type (Sucralose, Aspartame, Saccharin, Cyclamate, Stevia, Acesulfame K, Neotame), By Application (Chewing Gum, Food & Beverages, Pharmaceuticals, Others)
An Introduction to Zero Calorie Sweeteners Market
In 2024, the zero calorie sweeteners market is experiencing significant growth, driven by increasing consumer awareness of health and wellness. As concerns about obesity, diabetes, and overall sugar intake rise, consumers are seeking healthier alternatives to traditional sugar. Zero calorie sweeteners, such as stevia, aspartame, and sucralose, provide the sweetness of sugar without the calories, appealing to a wide range of consumers, including those on calorie-restricted and diabetic diets. Innovations in sweetener formulations and blends are enhancing taste profiles and broadening applications in beverages, baked goods, and processed foods. The market is also benefiting from regulatory approvals and endorsements by health organizations, boosting consumer confidence. As the demand for healthier food and beverage options continues to grow, the zero calorie sweeteners market is set for robust expansion.
Zero Calorie Sweeteners Competitive Landscape
The market report analyses the leading companies in the industry including Ajinomoto Co., Inc., Archer Daniels Midland Company (ADM), Cargill, Incorporated, Domino Foods, Inc. (ASR Group), Ingredion Incorporated, Janus Life Sciences LLC, Merisant Company, NOW Health Group, Inc., PureCircle Limited, Pyure Brands LLC, Stevi0cal Corp., Sunwin Stevia International, Inc., Sweet Green Fields Co., Ltd., Sweetlife AG, Tate & Lyle PLC, The American Sugar Refining Group, Wisdom Natural Brands, Xinghua Green Biological Preparation Co., Ltd., and Others.
Zero Calorie Sweeteners Market Dynamics
Zero Calorie Sweeteners Market Trend: Increasing Demand for Low-Calorie and Sugar-Free Alternatives
The market trend for zero-calorie sweeteners reflects a growing demand for low-calorie and sugar-free alternatives among health-conscious consumers. With rising concerns about obesity, diabetes, and other health conditions related to excessive sugar consumption, there is a shift towards healthier dietary choices. Zero-calorie sweeteners offer a solution for individuals looking to reduce their calorie intake and manage their blood sugar levels without sacrificing sweetness. This trend is driven by the desire for healthier lifestyles, as well as the growing popularity of low-carb and ketogenic diets that restrict sugar and carbohydrate intake. As a result, the market for zero-calorie sweeteners is experiencing steady growth as consumers seek alternatives to traditional sugar.
Market Driver: Health and Wellness Awareness Fuelling Consumer Choices
The market for zero-calorie sweeteners is primarily driven by increasing health and wellness awareness among consumers. With greater access to information about the adverse effects of sugar on health, more people are seeking alternatives to sugar in their diets. Zero-calorie sweeteners provide a means to enjoy sweet-tasting foods and beverages without the negative health consequences associated with sugar consumption, such as weight gain, tooth decay, and insulin resistance. The desire for weight management, improved energy levels, and overall well-being motivates consumers to choose products sweetened with zero-calorie alternatives, driving demand for these sweeteners across various food and beverage categories.
Market Opportunity: Expansion into Functional and Natural Sweetener Solutions
An opportunity for the zero-calorie sweeteners market lies in expansion into functional and natural sweetener solutions. While artificial sweeteners dominate the market, there is growing interest in natural sweeteners derived from sources such as stevia, monk fruit, and erythritol. These natural sweeteners offer the benefits of zero calories with the added appeal of being plant-based and perceived as more natural and wholesome. Manufacturers can capitalize on this opportunity by developing innovative formulations that combine zero-calorie sweeteners with functional ingredients such as vitamins, minerals, and antioxidants to create healthier and more nutritious products. Additionally, there is potential for zero-calorie sweeteners to be used in a wider range of applications, including savory foods, condiments, and alcoholic beverages, expanding their market reach and appeal to health-conscious consumers. By tapping into the growing demand for natural and functional sweetener solutions, the zero-calorie sweeteners market can unlock new opportunities for growth and differentiation in the competitive landscape.
Zero Calorie Sweeteners Market Share Analysis: Sucralose held the dominant market share in 2024
Within the Zero Calorie Sweeteners Market, the Sucralose segment holds the largest share due to several factors contributing to its dominance. Sucralose, a high-intensity artificial sweetener derived from sucrose, offers a sugar-like taste without the calories, making it a popular choice among consumers seeking to reduce their calorie intake without sacrificing sweetness. Its wide availability in various food and beverage products, including soft drinks, baked goods, and dairy products, contributes to its market dominance. Further, Sucralose is stable under a wide range of temperatures and pH levels, making it suitable for use in a diverse range of food and beverage applications. Additionally, its negligible effect on blood sugar levels and tooth decay further enhance its appeal to health-conscious consumers. As consumer demand for zero-calorie sweeteners continues to grow, Sucralose maintains its leading position in the market due to its taste, versatility, and widespread usage across the food and beverage industry.
Zero Calorie Sweeteners Market Share Analysis: Food & Beverages market is poised to register the fastest growth rae over the forecast period to 2032
The Food & Beverages segment is the fastest-growing sector within the Zero Calorie Sweeteners Market, driven by several key factors shaping consumer preferences and industry dynamics. As consumers increasingly seek healthier alternatives to sugar-laden products, the demand for zero-calorie sweeteners in food and beverages has surged. With growing concerns about obesity, diabetes, and other health issues related to high sugar consumption, food and beverage manufacturers are reformulating their products to include zero-calorie sweeteners, catering to health-conscious consumers. Further, advancements in food science and technology have led to the development of innovative formulations that mimic the taste and texture of sugar, further enhancing the appeal of zero-calorie sweeteners in a wide range of food and beverage applications. Additionally, the expanding market for functional and fortified foods and beverages, coupled with increasing consumer awareness of sugar substitutes, further drives the growth of this segment. As the demand for healthier and lower-calorie food and beverage options continues to rise, the Food & Beverages segment of the Zero Calorie Sweeteners Market is poised for sustained rapid expansion.
Zero Calorie Sweeteners Market Segmentation
By Type
Sucralose
Aspartame
Saccharin
Cyclamate
Stevia
Acesulfame K
Neotame
By Application
Chewing Gum
Food & Beverages
Pharmaceuticals
Others
Countries Analyzed
North America (US, Canada, Mexico)
Europe (Germany, UK, France, Spain, Italy, Russia, Rest of Europe)
Asia Pacific (China, India, Japan, South Korea, Australia, South East Asia, Rest of Asia)
South America (Brazil, Argentina, Rest of South America)
Middle East and Africa (Saudi Arabia, UAE, Rest of Middle East, South Africa, Egypt, Rest of Africa)
Zero Calorie Sweeteners Companies Profiled in the Study
Ajinomoto Co., Inc.
Archer Daniels Midland Company (ADM)
Cargill, Incorporated
Domino Foods, Inc. (ASR Group)
Ingredion Incorporated
Janus Life Sciences LLC
Merisant Company
NOW Health Group, Inc.
PureCircle Limited
Pyure Brands LLC
Stevi0cal Corp.
Sunwin Stevia International, Inc.
Sweet Green Fields Co., Ltd.
Sweetlife AG
Tate & Lyle PLC
The American Sugar Refining Group
Wisdom Natural Brands
Xinghua Green Biological Preparation Co., Ltd.
*- List Not Exhaustive
Chapter 1. TABLE OF CONTENTS
Chapter 2. Introduction to Zero Calorie Sweeteners Market
2.1. Market Overview
2.2. Key Statistics and Report Highlights
2.3. Scope of the Comprehensive Study
2.3.1. Market Definition
2.3.2 Countries and Regions Covered
2.3.3 Research Objective
2.3.4 Units, Currency, and Conversions
2.3.5 Industry Value Chain
2.4. Key Market Segments
2.5. Key Companies
2.6. Study Period
Chapter 3. Strategic Analysis Review
3.1. Zero Calorie Sweeteners Pricing Analysis and Forecast
3.2. Porter’s Five Forces
3.3. Market Ecosystem
3.4. SWOT Analysis
3.5. Regulatory Scenario
3.3. Effects of Inflation, Russia-Ukraine War, moderating economic growth, and other macroeconomic factors
Chapter 4. Competitive Landscape
4.1. Market Share Analysis
4.1.1. Global Zero Calorie Sweeteners Market Share by Company, 2023
4.1.2. Product Offerings of Leading Zero Calorie Sweeteners Companies
4.2. Market Entropy
4.2.1. New Product Launches in the Industry
4.2.2. Mergers, Acquisitions, Joint ventures, and Partnerships
4.3. Key Strategies and Best Practices
Chapter 5. Global Market Projections: Best, Reference, and Low Case Scenarios
5.1. Growth Analysis- Case Scenario Definitions
5.2. Low Growth Case Scenario Forecasts
5.3. Reference Growth Case Scenario Forecasts
5.4. High Growth Case Scenario Forecasts
Chapter 6. Market Dynamics
6.1. Zero Calorie Sweeteners Market Drivers
6.2. Zero Calorie Sweeteners Market Challenges
6.6. Zero Calorie Sweeteners Market Opportunities
6.4. Zero Calorie Sweeteners Market Trends
Chapter 7. Global Zero Calorie Sweeteners Market Outlook Trends
7.1. Global Zero Calorie Sweeteners Revenue (USD Million) and CAGR (%) by Type (2021-2032)
7.2. Global Zero Calorie Sweeteners Revenue (USD Million) and CAGR (%) by Application (2021-2032)
7.3. Global Zero Calorie Sweeteners Revenue (USD Million) and CAGR (%) by Product (2021-2032)
By Type
Sucralose
Aspartame
Saccharin
Cyclamate
Stevia
Acesulfame K
Neotame
By Application
Chewing Gum
Food & Beverages
Pharmaceuticals
Others
Chapter 8. Global Zero Calorie Sweeteners Regional Analysis and Outlook
8.1. Global Zero Calorie Sweeteners Revenue (USD Million) By Regions (2021- 2032)
8.2. North America Zero Calorie Sweeteners Revenue (USD Million) by Country (2021-2032)
8.2.1. United States Zero Calorie Sweeteners Regional Analysis and Outlook
8.2.2. Canada Zero Calorie Sweeteners Regional Analysis and Outlook
8.2.3. Mexico Zero Calorie Sweeteners Regional Analysis and Outlook
8.3. Europe Zero Calorie Sweeteners Revenue (USD Million), by Country (2021-2032)
8.3.1. Germany Zero Calorie Sweeteners Regional Analysis and Outlook
8.3.2. France Zero Calorie Sweeteners Regional Analysis and Outlook
8.3.3. United Kingdom Zero Calorie Sweeteners Regional Analysis and Outlook
8.3.4. Spain Zero Calorie Sweeteners Regional Analysis and Outlook
8.3.5. Italy Zero Calorie Sweeteners Regional Analysis and Outlook
8.3.6. Russia Zero Calorie Sweeteners Regional Analysis and Outlook
8.3.7. Rest of Europe Zero Calorie Sweeteners Regional Analysis and Outlook
8.4. Asia Pacific Zero Calorie Sweeteners Revenue (USD Million) by Country (2021-2032)
8.4.1. China Zero Calorie Sweeteners Regional Analysis and Outlook
8.4.2. Japan Zero Calorie Sweeteners Regional Analysis and Outlook
8.4.3. India Zero Calorie Sweeteners Regional Analysis and Outlook
8.4.4. South Korea Zero Calorie Sweeteners Regional Analysis and Outlook
8.4.5. Australia Zero Calorie Sweeteners Regional Analysis and Outlook
8.4.6. South East Asia Zero Calorie Sweeteners Regional Analysis and Outlook
8.4.7. Rest of Asia Pacific Zero Calorie Sweeteners Regional Analysis and Outlook
8.5. South America Zero Calorie Sweeteners Revenue (USD Million), by Country (2021-2032)
8.5.1. Brazil Zero Calorie Sweeteners Regional Analysis and Outlook
8.5.2. Argentina Zero Calorie Sweeteners Regional Analysis and Outlook
8.5.3. Rest of South America Zero Calorie Sweeteners Regional Analysis and Outlook
8.6. Middle East and Africa Zero Calorie Sweeteners Revenue (USD Million) by Country (2021-2032)
8.6.1. Middle East Zero Calorie Sweeteners Regional Analysis and Outlook
8.6.2. Africa Zero Calorie Sweeteners Regional Analysis and Outlook
Chapter 9. North America Zero Calorie Sweeteners Analysis and Outlook
9.1. North America Zero Calorie Sweeteners Revenue (USD Million) by Segments (2021-2032)
9.1.1. North America Zero Calorie Sweeteners Revenue (USD Million) by Type (2021-2032)
9.1.2. North America Zero Calorie Sweeteners Revenue (USD Million) by Application (2021-2032)
9.1.3. North America Zero Calorie Sweeteners Revenue (USD Million) by Product (2021-2032)
By Type
Sucralose
Aspartame
Saccharin
Cyclamate
Stevia
Acesulfame K
Neotame
By Application
Chewing Gum
Food & Beverages
Pharmaceuticals
Others
Chapter 10. Europe Zero Calorie Sweeteners Analysis and Outlook
10.1. Europe Zero Calorie Sweeteners Revenue (USD Million), by Segments (USD Million) (2021-2032)
10.1.1. Europe Zero Calorie Sweeteners Revenue (USD Million) by Type (2021-2032)
10.1.2. Europe Zero Calorie Sweeteners Revenue (USD Million) by Application (2021-2032)
10.1.3. Europe Zero Calorie Sweeteners Revenue (USD Million) by Product (2021-2032)
By Type
Sucralose
Aspartame
Saccharin
Cyclamate
Stevia
Acesulfame K
Neotame
By Application
Chewing Gum
Food & Beverages
Pharmaceuticals
Others
Chapter 11. Asia Pacific Zero Calorie Sweeteners Analysis and Outlook
11.1. Asia Pacific Zero Calorie Sweeteners Revenue (USD Million), and Revenue (USD Million) by Segments (2021-2032)
11.1.1. Asia Pacific Zero Calorie Sweeteners Revenue (USD Million) by Type (2021-2032)
11.1.2. Asia Pacific Zero Calorie Sweeteners Revenue (USD Million) by Application (2021-2032)
11.1.3. Asia Pacific Zero Calorie Sweeteners Revenue (USD Million) by Product (2021-2032)
By Type
Sucralose
Aspartame
Saccharin
Cyclamate
Stevia
Acesulfame K
Neotame
By Application
Chewing Gum
Food & Beverages
Pharmaceuticals
Others
Chapter 12. South America Zero Calorie Sweeteners Analysis and Outlook
12.1. South America Zero Calorie Sweeteners Revenue (USD Million), by Segments (2021-2032)
12.1.1. South America Zero Calorie Sweeteners Revenue (USD Million) by Type (2021-2032)
12.1.2. South America Zero Calorie Sweeteners Revenue (USD Million) by Application (2021-2032)
12.1.3. South America Zero Calorie Sweeteners Revenue (USD Million) by Product (2021-2032)
By Type
Sucralose
Aspartame
Saccharin
Cyclamate
Stevia
Acesulfame K
Neotame
By Application
Chewing Gum
Food & Beverages
Pharmaceuticals
Others
Chapter 13. Middle East and Africa Zero Calorie Sweeteners Analysis and Outlook
13.1. Middle East and Africa Zero Calorie Sweeteners Revenue (USD Million), by Segments (2021-2032)
13.1.1. Middle East and Africa Zero Calorie Sweeteners Revenue (USD Million) by Type (2021-2032)
13.1.2. Middle East and Africa Zero Calorie Sweeteners Revenue (USD Million) by Application (2021-2032)
13.1.3. Middle East and Africa Zero Calorie Sweeteners Revenue (USD Million) by Product (2021-2032)
By Type
Sucralose
Aspartame
Saccharin
Cyclamate
Stevia
Acesulfame K
Neotame
By Application
Chewing Gum
Food & Beverages
Pharmaceuticals
Others
Chapter 14. Zero Calorie Sweeteners Company Profiles
14.1 Business Overview
14.2 Product Profiles
14.3 SWOT Profiles
14.5 Recent Developments
14.6 Financial Profile
List of Companies
Ajinomoto Co., Inc.
Archer Daniels Midland Company (ADM)
Cargill, Incorporated
Domino Foods, Inc. (ASR Group)
Ingredion Incorporated
Janus Life Sciences LLC
Merisant Company
NOW Health Group, Inc.
PureCircle Limited
Pyure Brands LLC
Stevi0cal Corp.
Sunwin Stevia International, Inc.
Sweet Green Fields Co., Ltd.
Sweetlife AG
Tate & Lyle PLC
The American Sugar Refining Group
Wisdom Natural Brands
Xinghua Green Biological Preparation Co., Ltd.
15. Methodology and Data Sources
15.1 Customization Offerings
15.2 Subscription Services
15.3 Related Reports
15.4 Publisher Expertise
LIST OF TABLES
Table 1 Market Segmentation Analysis
Table 2 Global Zero Calorie Sweeteners Market Share of Leading Companies, 2023
Table 3 Product Offerings of Leading Companies
Table 4 Low Growth Scenario Forecasts
Table 5 Reference Case Growth Scenario
Table 6 High Growth Case Scenario
Table 7 Global Zero Calorie Sweeteners Revenue (USD Million) And CAGR (%) By Type (2021-2032)
Table 8 Global Zero Calorie Sweeteners Revenue (USD Million) And CAGR (%) By Application (2021-2032)
Table 9 Global Zero Calorie Sweeteners Revenue (USD Million) And CAGR (%) By Product (2021-2032)
Table 10 Global Zero Calorie Sweeteners Market Revenue (USD Million) By Regions (2021-2032)
Table 11 Global Zero Calorie Sweeteners Market Share (%) By Regions (2021-2032)
Table 12 North America Zero Calorie Sweeteners Revenue (USD Million) By Country (2021-2032)
Table 13 Europe Zero Calorie Sweeteners Revenue (USD Million) By Country (2021-2032)
Table 14 Asia Pacific Zero Calorie Sweeteners Revenue (USD Million) By Country (2021-2032)
Table 15 South America Zero Calorie Sweeteners Revenue (USD Million) By Country (2021-2032)
Table 16 Middle East and Africa Zero Calorie Sweeteners Revenue (USD Million) By Region (2021-2032)
Table 17 North America Zero Calorie Sweeteners Revenue (USD Million) By Type (2021-2032)
Table 18 North America Zero Calorie Sweeteners Revenue (USD Million) By Application (2021-2032)
Table 19 North America Zero Calorie Sweeteners Revenue (USD Million) By Product (2021-2032)
Table 20 Europe Zero Calorie Sweeteners Revenue (USD Million) By Type (2021-2032)
Table 21 Europe Zero Calorie Sweeteners Revenue (USD Million) By Application (2021-2032)
Table 22 Europe Zero Calorie Sweeteners Revenue (USD Million) By Product (2021-2032)
Table 23 Asia Pacific Zero Calorie Sweeteners Revenue (USD Million) By Type (2021-2032)
Table 24 Asia Pacific Zero Calorie Sweeteners Revenue (USD Million) By Application (2021-2032)
Table 25 Asia Pacific Zero Calorie Sweeteners Revenue (USD Million) By Product (2021-2032)
Table 26 South America Zero Calorie Sweeteners Revenue (USD Million) By Type (2021-2032)
Table 27 South America Zero Calorie Sweeteners Revenue (USD Million) By Application (2021-2032)
Table 28 South America Zero Calorie Sweeteners Revenue (USD Million) By Product (2021-2032)
Table 29 Middle East and Africa Zero Calorie Sweeteners Revenue (USD Million) By Type (2021-2032)
Table 30 Middle East and Africa Zero Calorie Sweeteners Revenue (USD Million) By Application (2021-2032)
Table 31 Middle East and Africa Zero Calorie Sweeteners Revenue (USD Million) By Product (2021-2032)
LIST OF FIGURES
Figure 1. Market Scope
Figure 2. Pricing Forecasts Per Unit, 2023- 2032
Figure 3. Porter’s Five Forces
Figure 4. Global Zero Calorie Sweeteners Market Revenue (USD Million) By Regions (2021-2032)
Figure 5. Global Zero Calorie Sweeteners Market Share (%) By Regions (2023)
Figure 6. North America Zero Calorie Sweeteners Revenue (USD Million) By Country (2021-2032)
Figure 7. United States Zero Calorie Sweeteners Revenue (USD Million) By Country (2021-2032)
Figure 8. Canada Zero Calorie Sweeteners Revenue (USD Million) By Country (2021-2032)
Figure 9. Mexico Zero Calorie Sweeteners Revenue (USD Million) By Country (2021-2032)
Figure 10. Europe Zero Calorie Sweeteners Revenue (USD Million) By Country (2021-2032)
Figure 11. Germany Zero Calorie Sweeteners Revenue (USD Million) By Country (2021-2032)
Figure 12. France Zero Calorie Sweeteners Revenue (USD Million) By Country (2021-2032)
Figure 13. United Kingdom Zero Calorie Sweeteners Revenue (USD Million) By Country (2021-2032)
Figure 14. Spain Zero Calorie Sweeteners Revenue (USD Million) By Country (2021-2032)
Figure 15. Italy Zero Calorie Sweeteners Revenue (USD Million) By Country (2021-2032)
Figure 16. Russia Zero Calorie Sweeteners Revenue (USD Million) By Country (2021-2032)
Figure 17. Rest of Europe Zero Calorie Sweeteners Revenue (USD Million) By Country (2021-2032)
Figure 11. Asia Pacific Zero Calorie Sweeteners Revenue (USD Million) By Country (2021-2032)
Figure 12. China Zero Calorie Sweeteners Revenue (USD Million) By Country (2021-2032)
Figure 13. Japan Zero Calorie Sweeteners Revenue (USD Million) By Country (2021-2032)
Figure 14. India Zero Calorie Sweeteners Revenue (USD Million) By Country (2021-2032)
Figure 15. South Korea Zero Calorie Sweeteners Revenue (USD Million) By Country (2021-2032)
Figure 16. Australia Zero Calorie Sweeteners Revenue (USD Million) By Country (2021-2032)
Figure 17. South East Asia Zero Calorie Sweeteners Revenue (USD Million) By Country (2021-2032)
Figure 18. South America Zero Calorie Sweeteners Revenue (USD Million) By Country (2021-2032)
Figure 19. Brazil Zero Calorie Sweeteners Revenue (USD Million) By Country (2021-2032)
Figure 20. Argentina Zero Calorie Sweeteners Revenue (USD Million) By Country (2021-2032)
Figure 21. Rest of Asia Pacific Zero Calorie Sweeteners Revenue (USD Million) By Country (2021-2032)
Figure 22. Middle East and Africa Zero Calorie Sweeteners Revenue (USD Million) By Region (2021-2032)
Figure 23. Saudi Arabia Zero Calorie Sweeteners Revenue (USD Million) By Region (2021-2032)
Figure 24. The UAE Zero Calorie Sweeteners Revenue (USD Million) By Region (2021-2032)
Figure 25. Rest of Middle East Zero Calorie Sweeteners Revenue (USD Million) By Region (2021-2032)
Figure 26. South Africa Zero Calorie Sweeteners Revenue (USD Million) By Region (2021-2032)
Figure 27. Africa Zero Calorie Sweeteners Revenue (USD Million) By Region (2021-2032)
Figure 28. North America Zero Calorie Sweeteners Revenue (USD Million) By Type (2021-2032)
Figure 29. North America Zero Calorie Sweeteners Revenue (USD Million) By Application (2021-2032)
Figure 30. North America Zero Calorie Sweeteners Revenue (USD Million) By Product (2021-2032)
Figure 31. Europe Zero Calorie Sweeteners Revenue (USD Million) By Type (2021-2032)
Figure 32. Europe Zero Calorie Sweeteners Revenue (USD Million) By Application (2021-2032)
Figure 33. Europe Zero Calorie Sweeteners Revenue (USD Million) By Product (2021-2032)
Figure 34. Asia Pacific Zero Calorie Sweeteners Revenue (USD Million) By Type (2021-2032)
Figure 35. Asia Pacific Zero Calorie Sweeteners Revenue (USD Million) By Application (2021-2032)
Figure 36. Asia Pacific Zero Calorie Sweeteners Revenue (USD Million) By Product (2021-2032)
Figure 37. South America Zero Calorie Sweeteners Revenue (USD Million) By Type (2021-2032)
Figure 38. South America Zero Calorie Sweeteners Revenue (USD Million) By Application (2021-2032)
Figure 39. South America Zero Calorie Sweeteners Revenue (USD Million) By Product (2021-2032)
Figure 40. Middle East and Africa Zero Calorie Sweeteners Revenue (USD Million) By Type (2021-2032)
Figure 41. Middle East and Africa Zero Calorie Sweeteners Revenue (USD Million) By Application (2021-2032)
Figure 42. Middle East and Africa Zero Calorie Sweeteners Revenue (USD Million) By Product (2021-2032)
By Type
Sucralose
Aspartame
Saccharin
Cyclamate
Stevia
Acesulfame K
Neotame
By Application
Chewing Gum
Food & Beverages
Pharmaceuticals
Others
Countries Analyzed
North America (US, Canada, Mexico)
Europe (Germany, UK, France, Spain, Italy, Russia, Rest of Europe)
Asia Pacific (China, India, Japan, South Korea, Australia, South East Asia, Rest of Asia)
South America (Brazil, Argentina, Rest of South America)
Middle East and Africa (Saudi Arabia, UAE, Rest of Middle East, South Africa, Egypt, Rest of Africa)
