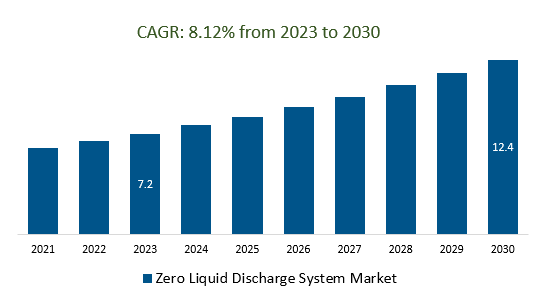
The global Zero Liquid Discharge Systems Market Size is estimated to be US$ 7.2 Billion in 2023 and is poised to register 8.12% growth over the forecast period from 2023 to 2030 to reach US$ 12.4 Billion by 2030
The market growth is driven predominantly by Stricter environmental regulations, growing water scarcity concerns, demand for managing water resources more efficiently and reducing the impact of industrial activities, long-term cost savings by reducing water consumption, and other factors. Leading companies are focusing on advancements in membrane technologies, evaporation techniques, crystallization processes, integrating renewable energy sources such as solar and wind to power ZLD processes, the launch of Modular and Scalable Solutions, integrating with water treatment and recycling processes, and others to boost market shares in the industry.
Market Overview
The Zero Liquid Discharge (ZLD) Systems market has witnessed substantial growth in recent years due to increasing environmental regulations and concerns regarding water scarcity. ZLD systems offer an innovative solution to efficiently manage industrial wastewater by minimizing liquid waste generation and recovering valuable resources from the waste stream. This market encompasses various industries such as energy, chemicals, pharmaceuticals, textiles, and more, where stringent wastewater discharge regulations are driving the adoption of ZLD systems. The market is characterized by a range of technologies including evaporation, crystallization, reverse osmosis, and hybrid processes, each catering to different industry needs.
Market Dynamics
Market Trends- Companies are launching Technological Advancements& Industry Diversification to attract a consumer base:
The Zero Liquid Discharge (ZLD) technologies improved evaporation techniques, enhanced membrane technologies, and hybrid processes, are boosting the efficiency and cost-effectiveness of these systems were initially prominent in industries such as energy and chemicals, their adoption is now expanding across sectors like textiles, pharmaceuticals, and electronics manufacturing, broadening the market's scope.
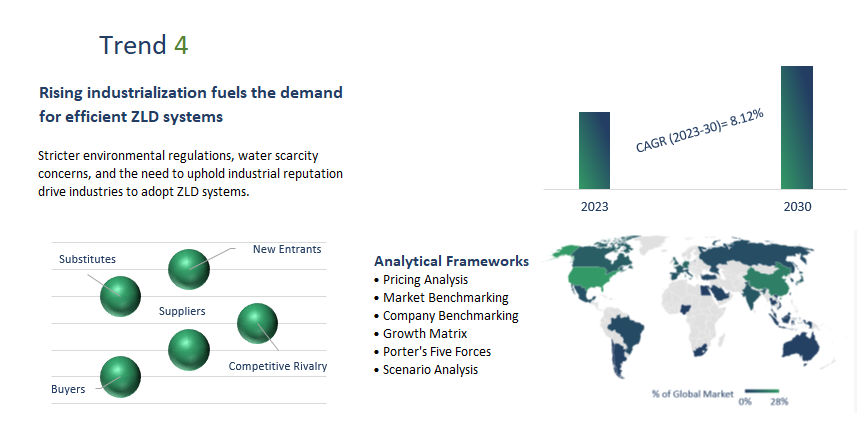
Market Driver- Rising industrialization fuels the demand for efficient ZLD systems
Stricter environmental regulations, water scarcity concerns, and the need to uphold industrial reputation drive industries to adopt ZLD systems. These systems provide a sustainable solution by effectively treating wastewater, minimizing water consumption, and aiding resource recovery. Furthermore, as industries expand globally, the demand for ZLD systems grows, making them essential for long-term viability and environmentally responsible industrial growth.
Market Opportunity-Introduction of Water Quality Concerns
ZLD systems treated water released into the environment meets or exceeds water quality standards. With increasing awareness of environmental sustainability, industries are under pressure to minimize the impact of their operations on water bodies and ecosystems. Properly treated water from ZLD systems helps prevent contamination and supports overall ecosystem health. Industries are becoming more mindful of the impact of their wastewater discharge on local water bodies and ecosystems. ZLD systems help higher-quality treated water before release.
Market Segmentation
Evaporation/Crystallization: Evaporation/Crystallization offers several advantages, including the reduction of wastewater volume, removal of contaminants, and recovery of valuable salts and minerals. Further, it demands careful temperature and pressure control to optimize efficiency and prevent scaling or fouling of equipment due to precipitated solids.
This is relevant in industries like chemicals, mining, and power generation, where effluent streams contain high concentrations of dissolved solids. By transforming wastewater into valuable resources while ensuring compliance with stringent environmental regulations, Evaporation/Crystallization stands as a key driver in the ZLD Systems market, aligning with sustainability goals and responsible water management practices.
Food and Beverages: The composition of wastewater in the industry requires specialized treatment techniques. ZLD systems in Food and Beverage plants typically involve a combination of physical, chemical, and biological processes to effectively remove organic compounds, nutrients, and pollutants. Advanced filtration, membrane separation, and evaporation technologies play a crucial role in achieving high-quality treated water suitable for safe discharge.
Thermal: Thermal ZLD systems utilize technologies like multiple-effect evaporators and mechanical vapor compression to efficiently evaporate water from wastewater streams. These systems can effectively treat wastewater with complex compositions, such as those found in industries like mining, power generation, and chemicals, thermal energy-intensive due to the heat required for evaporation, advancements in technology have led to more energy-efficient designs.
Market Segmentation
By Type
By Process
- Evaporation/Crystallization
- Filtration
- Pre-Treatment
By End-User
- Energy and Power
- Chemicals and Petrochemicals
- Food and Beverages
- Textiles
- Pharmaceuticals
- Semiconductors and Electronics
- Others
By Technology
- Reverse Osmosis
- Ultrafiltration
- Evaporation/Crystallization
By Region
- North America (United States, Canada, Mexico)
- Europe (Germany, France, United Kingdom, Spain, Italy, Others)
- Asia Pacific (China, India, Japan, South Korea, Australia, Others)
- Latin America (Brazil, Argentina, Others)
- Middle East and Africa (Saudi Arabia, UAE, Kuwait, Other Middle East, South Africa, Nigeria, Other Africa)
Key Players
Leading companies profiled in the study include-
- Aquatech International
- GEA Group AG
- Alfa Laval AB
- Veolia
- Praj Industries
- Andritz AG
- H20 GmbH
- Ion Exchange India Ltd
- Aquarion AG
- Safbon Water Technology
- Toshiba Infrastructure Systems and Solutions Corporation
- Condorchem Envitech
- Petro Sep
Zero Liquid Discharge Systems Market Outlook 2023
1 Market Overview
1.1 Introduction to Zero Liquid Discharge Systems Market
1.2 Scope of the Study
1.3 Research Objective
1.3.1 Key Market Scope and Segments
1.3.2 Players Covered
1.3.3 Years Considered
2 Executive Summary
2.1 2023 Zero Liquid Discharge Systems Industry- Market Statistics
3 Market Dynamics
3.1 Market Drivers
3.2 Market Challenges
3.3 Market Opportunities
3.4 Market Trends
4 Market Factor Analysis
4.1 Porter’s Five Forces
4.2 Market Entropy
4.2.1 Global Zero Liquid Discharge Systems Market Companies with Area Served
4.2.2 Products Offerings Global Zero Liquid Discharge Systems Market
5 COVID-19 Impact Analysis and Outlook Scenarios
5.1.1 Covid-19 Impact Analysis
5.1.2 Post-COVID-19 Scenario- Low Growth Case
5.1.3 Post-COVID-19 Scenario- Reference Growth Case
5.1.4 Post-COVID-19 Scenario- Low Growth Case
6 Global Zero Liquid Discharge Systems Market Trends
6.1 Global Zero Liquid Discharge Systems Revenue (USD Million) and CAGR (%) by Type (2018-2030)
6.2 Global Zero Liquid Discharge Systems Revenue (USD Million) and CAGR (%) by Applications (2018-2030)
6.3 Global Zero Liquid Discharge Systems Revenue (USD Million) and CAGR (%) by Regions (2018-2030)
7 Global Zero Liquid Discharge Systems Market Revenue (USD Million) by Type, and Applications (2018-2022)
7.1 Global Zero Liquid Discharge Systems Revenue (USD Million) by Type (2018-2022)
7.1.1 Global Zero Liquid Discharge Systems Revenue (USD Million), Market Share (%) by Type (2018-2022)
7.2 Global Zero Liquid Discharge Systems Revenue (USD Million) by Applications (2018-2022)
7.2.1 Global Zero Liquid Discharge Systems Revenue (USD Million), Market Share (%) by Applications (2018-2022)
8 Global Zero Liquid Discharge Systems Development Regional Status and Outlook
8.1 Global Zero Liquid Discharge Systems Revenue (USD Million) By Regions (2018-2022)
8.2 North America Zero Liquid Discharge Systems Revenue (USD Million) by Type, and Application (2018-2022)
8.2.1 North America Zero Liquid Discharge Systems Revenue (USD Million) by Country (2018-2022)
8.2.2 North America Zero Liquid Discharge Systems Revenue (USD Million) by Type (2018-2022)
8.2.3 North America Zero Liquid Discharge Systems Revenue (USD Million) by Applications (2018-2022)
8.3 Europe Zero Liquid Discharge Systems Revenue (USD Million), by Type, and Applications (USD Million) (2018-2022)
8.3.1 Europe Zero Liquid Discharge Systems Revenue (USD Million), by Country (2018-2022)
8.3.2 Europe Zero Liquid Discharge Systems Revenue (USD Million) by Type (2018-2022)
8.3.3 Europe Zero Liquid Discharge Systems Revenue (USD Million) by Applications (2018-2022)
8.4 Asia Pacific Zero Liquid Discharge Systems Revenue (USD Million), and Revenue (USD Million) by Type, and Applications (2018-2022)
8.4.1 Asia Pacific Zero Liquid Discharge Systems Revenue (USD Million) by Country (2018-2022)
8.4.2 Asia Pacific Zero Liquid Discharge Systems Revenue (USD Million) by Type (2018-2022)
8.4.3 Asia Pacific Zero Liquid Discharge Systems Revenue (USD Million) by Applications (2018-2022)
8.5 South America Zero Liquid Discharge Systems Revenue (USD Million), by Type, and Applications (2018-2022)
8.5.1 South America Zero Liquid Discharge Systems Revenue (USD Million), by Country (2018-2022)
8.5.2 South America Zero Liquid Discharge Systems Revenue (USD Million) by Type (2018-2022)
8.5.3 South America Zero Liquid Discharge Systems Revenue (USD Million) by Applications (2018-2022)
8.6 Middle East and Africa Zero Liquid Discharge Systems Revenue (USD Million), by Type, Technology, Application, Thickness (2018-2022)
8.6.1 Middle East and Africa Zero Liquid Discharge Systems Revenue (USD Million) by Country (2018-2022)
8.6.2 Middle East and Africa Zero Liquid Discharge Systems Revenue (USD Million) by Type (2018-2022)
8.6.3 Middle East and Africa Zero Liquid Discharge Systems Revenue (USD Million) by Applications (2018-2022)
9 Company Profiles
10 Global Zero Liquid Discharge Systems Market Revenue (USD Million), by Type, and Applications (2023-2030)
10.1 Global Zero Liquid Discharge Systems Revenue (USD Million) and Market Share (%) by Type (2023-2030)
10.1.1 Global Zero Liquid Discharge Systems Revenue (USD Million), and Market Share (%) by Type (2023-2030)
10.2 Global Zero Liquid Discharge Systems Revenue (USD Million) and Market Share (%) by Applications (2023-2030)
10.2.1 Global Zero Liquid Discharge Systems Revenue (USD Million), and Market Share (%) by Applications (2023-2030)
11 Global Zero Liquid Discharge Systems Development Regional Status and Outlook Forecast
11.1 Global Zero Liquid Discharge Systems Revenue (USD Million) By Regions (2023-2030)
11.2 North America Zero Liquid Discharge Systems Revenue (USD Million) by Type, and Applications (2023-2030)
11.2.1 North America Zero Liquid Discharge Systems Revenue (USD) Million by Country (2023-2030)
11.2.2 North America Zero Liquid Discharge Systems Revenue (USD Million), by Type (2023-2030)
11.2.3 North America Zero Liquid Discharge Systems Revenue (USD Million), Market Share (%) by Applications (2023-2030)
11.3 Europe Zero Liquid Discharge Systems Revenue (USD Million), by Type, and Applications (2023-2030)
11.3.1 Europe Zero Liquid Discharge Systems Revenue (USD Million), by Country (2023-2030)
11.3.2 Europe Zero Liquid Discharge Systems Revenue (USD Million), by Type (2023-2030)
11.3.3 Europe Zero Liquid Discharge Systems Revenue (USD Million), by Applications (2023-2030)
11.4 Asia Pacific Zero Liquid Discharge Systems Revenue (USD Million) by Type, and Applications (2023-2030)
11.4.1 Asia Pacific Zero Liquid Discharge Systems Revenue (USD Million), by Country (2023-2030)
11.4.2 Asia Pacific Zero Liquid Discharge Systems Revenue (USD Million), by Type (2023-2030)
11.4.3 Asia Pacific Zero Liquid Discharge Systems Revenue (USD Million), by Applications (2023-2030)
11.5 South America Zero Liquid Discharge Systems Revenue (USD Million), by Type, and Applications (2023-2030)
11.5.1 South America Zero Liquid Discharge Systems Revenue (USD Million), by Country (2023-2030)
11.5.2 South America Zero Liquid Discharge Systems Revenue (USD Million), by Type (2023-2030)
11.5.3 South America Zero Liquid Discharge Systems Revenue (USD Million), by Applications (2023-2030)
11.6 Middle East and Africa Zero Liquid Discharge Systems Revenue (USD Million), by Type, and Applications (2023-2030)
11.6.1 Middle East and Africa Zero Liquid Discharge Systems Revenue (USD Million), by Region (2023-2030)
11.6.2 Middle East and Africa Zero Liquid Discharge Systems Revenue (USD Million), by Type (2023-2030)
11.6.3 Middle East and Africa Zero Liquid Discharge Systems Revenue (USD Million), by Applications (2023-2030)
12 Methodology and Data Sources
12.1 Methodology/Research Approach
12.1.1 Research Programs/Design
12.1.2 Market Size Estimation
12.1.3 Market Breakdown and Data Triangulation
12.2 Data Sources
12.2.1 Secondary Sources
12.2.2 Primary Sources
12.3 Disclaimer
List Of Tables
Table 1 Market Segmentation Analysis
Table 2 Global Zero Liquid Discharge Systems Market Companies with Areas Served
Table 3 Products Offerings Global Zero Liquid Discharge Systems Market
Table 4 Low Growth Scenario Forecasts
Table 5 Reference Case Growth Scenario
Table 6 High Growth Case Scenario
Table 7 Global Zero Liquid Discharge Systems Revenue (USD Million) And CAGR (%) By Type (2018-2030)
Table 8 Global Zero Liquid Discharge Systems Revenue (USD Million) And CAGR (%) By Applications (2018-2030)
Table 9 Global Zero Liquid Discharge Systems Revenue (USD Million) And CAGR (%) By Regions (2018-2030)
Table 10 Global Zero Liquid Discharge Systems Revenue (USD Million) By Type (2018-2022)
Table 11 Global Zero Liquid Discharge Systems Revenue Market Share (%) By Type (2018-2022)
Table 12 Global Zero Liquid Discharge Systems Revenue (USD Million) By Applications (2018-2022)
Table 13 Global Zero Liquid Discharge Systems Revenue Market Share (%) By Applications (2018-2022)
Table 14 Global Zero Liquid Discharge Systems Market Revenue (USD Million) By Regions (2018-2022)
Table 15 Global Zero Liquid Discharge Systems Market Share (%) By Regions (2018-2022)
Table 16 North America Zero Liquid Discharge Systems Revenue (USD Million) By Country (2018-2022)
Table 17 North America Zero Liquid Discharge Systems Revenue (USD Million) By Type (2018-2022)
Table 18 North America Zero Liquid Discharge Systems Revenue (USD Million) By Applications (2018-2022)
Table 19 Europe Zero Liquid Discharge Systems Revenue (USD Million) By Country (2018-2022)
Table 20 Europe Zero Liquid Discharge Systems Revenue (USD Million) By Type (2018-2022)
Table 21 Europe Zero Liquid Discharge Systems Revenue (USD Million) By Applications (2018-2022)
Table 22 Asia Pacific Zero Liquid Discharge Systems Revenue (USD Million) By Country (2018-2022)
Table 23 Asia Pacific Zero Liquid Discharge Systems Revenue (USD Million) By Type (2018-2022)
Table 24 Asia Pacific Zero Liquid Discharge Systems Revenue (USD Million) By Applications (2018-2022)
Table 25 South America Zero Liquid Discharge Systems Revenue (USD Million) By Country (2018-2022)
Table 26 South America Zero Liquid Discharge Systems Revenue (USD Million) By Type (2018-2022)
Table 27 South America Zero Liquid Discharge Systems Revenue (USD Million) By Applications (2018-2022)
Table 28 Middle East and Africa Zero Liquid Discharge Systems Revenue (USD Million) By Region (2018-2022)
Table 29 Middle East and Africa Zero Liquid Discharge Systems Revenue (USD Million) By Type (2018-2022)
Table 30 Middle East and Africa Zero Liquid Discharge Systems Revenue (USD Million) By Applications (2018-2022)
Table 31 Financial Analysis
Table 32 Global Zero Liquid Discharge Systems Revenue (USD Million) By Type (2023-2030)
Table 33 Global Zero Liquid Discharge Systems Revenue Market Share (%) By Type (2023-2030)
Table 34 Global Zero Liquid Discharge Systems Revenue (USD Million) By Applications (2023-2030)
Table 35 Global Zero Liquid Discharge Systems Revenue Market Share (%) By Applications (2023-2030)
Table 36 Global Zero Liquid Discharge Systems Market Revenue (USD Million), And Revenue (USD Million) By Regions (2023-2030)
Table 37 North America Zero Liquid Discharge Systems Revenue (USD)By Country (2023-2030)
Table 38 North America Zero Liquid Discharge Systems Revenue (USD Million) By Type (2023-2030)
Table 39 North America Zero Liquid Discharge Systems Revenue (USD Million) By Applications (2023-2030)
Table 40 Europe Zero Liquid Discharge Systems Revenue (USD Million) By Country (2023-2030)
Table 41 Europe Zero Liquid Discharge Systems Revenue (USD Million) By Type (2023-2030)
Table 42 Europe Zero Liquid Discharge Systems Revenue (USD Million) By Applications (2023-2030)
Table 43 Asia Pacific Zero Liquid Discharge Systems Revenue (USD Million) By Country (2023-2030)
Table 44 Asia Pacific Zero Liquid Discharge Systems Revenue (USD Million) By Type (2023-2030)
Table 45 Asia Pacific Zero Liquid Discharge Systems Revenue (USD Million) By Applications (2023-2030)
Table 46 South America Zero Liquid Discharge Systems Revenue (USD Million) By Country (2023-2030)
Table 47 South America Zero Liquid Discharge Systems Revenue (USD Million) By Type (2023-2030)
Table 48 South America Zero Liquid Discharge Systems Revenue (USD Million) By Applications (2023-2030)
Table 49 Middle East and Africa Zero Liquid Discharge Systems Revenue (USD Million) By Region (2023-2030)
Table 50 Middle East and Africa Zero Liquid Discharge Systems Revenue (USD Million) By Region (2023-2030)
Table 51 Middle East and Africa Zero Liquid Discharge Systems Revenue (USD Million) By Type (2023-2030)
Table 52 Middle East and Africa Zero Liquid Discharge Systems Revenue (USD Million) By Applications (2023-2030)
Table 53 Research Programs/Design for This Report
Table 54 Key Data Information from Secondary Sources
Table 55 Key Data Information from Primary Sources
List Of Figures
Figure 1 Market Scope
Figure 2 Porter’s Five Forces
Figure 3 Global Zero Liquid Discharge Systems Revenue (USD Million) By Type (2018-2022)
Figure 4 Global Zero Liquid Discharge Systems Revenue Market Share (%) By Type (2022)
Figure 5 Global Zero Liquid Discharge Systems Revenue (USD Million) By Applications (2018-2022)
Figure 6 Global Zero Liquid Discharge Systems Revenue Market Share (%) By Applications (2022)
Figure 7 Global Zero Liquid Discharge Systems Market Revenue (USD Million) By Regions (2018-2022)
Figure 8 Global Zero Liquid Discharge Systems Market Share (%) By Regions (2022)
Figure 9 North America Zero Liquid Discharge Systems Revenue (USD Million) By Country (2018-2022)
Figure 10 North America Zero Liquid Discharge Systems Revenue (USD Million) By Type (2018-2022)
Figure 11 North America Zero Liquid Discharge Systems Revenue (USD Million) By Applications (2018-2022)
Figure 12 Europe Zero Liquid Discharge Systems Revenue (USD Million) By Country (2018-2022)
Figure 13 Europe Zero Liquid Discharge Systems Revenue (USD Million) By Type (2018-2022)
Figure 14 Europe Zero Liquid Discharge Systems Revenue (USD Million) By Applications (2018-2022)
Figure 15 Asia Pacific Zero Liquid Discharge Systems Revenue (USD Million) By Country (2018-2022)
Figure 16 Asia Pacific Zero Liquid Discharge Systems Revenue (USD Million) By Type (2018-2022)
Figure 17 Asia Pacific Zero Liquid Discharge Systems Revenue (USD Million) By Applications (2018-2022)
Figure 18 South America Zero Liquid Discharge Systems Revenue (USD Million) By Country (2018-2022)
Figure 19 South America Zero Liquid Discharge Systems Revenue (USD Million) By Type (2018-2022)
Figure 20 South America Zero Liquid Discharge Systems Revenue (USD Million) By Applications (2018-2022)
Figure 21 Middle East and Africa Zero Liquid Discharge Systems Revenue (USD Million) By Region (2018-2022)
Figure 22 Middle East and Africa Zero Liquid Discharge Systems Revenue (USD Million) By Type (2018-2022)
Figure 23 Middle East and Africa Zero Liquid Discharge Systems Revenue (USD Million) By Applications (2018-2022)
Figure 24 Global Zero Liquid Discharge Systems Revenue (USD Million) By Type (2023-2030)
Figure 25 Global Zero Liquid Discharge Systems Revenue Market Share (%) By Type (2030)
Figure 26 Global Zero Liquid Discharge Systems Revenue (USD Million) By Applications (2023-2030)
Figure 27 Global Zero Liquid Discharge Systems Revenue Market Share (%) By Applications (2030)
Figure 28 Global Zero Liquid Discharge Systems Market Revenue (USD Million) By Regions (2023-2030)
Figure 29 North America Zero Liquid Discharge Systems Revenue (USD Million) By Country (2023-2030)
Figure 30 North America Zero Liquid Discharge Systems Revenue (USD Million) By Type (2023-2030)
Figure 31 North America Zero Liquid Discharge Systems Revenue (USD Million) By Applications (2023-2030)
Figure 32 Europe Zero Liquid Discharge Systems Revenue (USD Million) By Country (2023-2030)
Figure 33 Europe Zero Liquid Discharge Systems Revenue (USD Million) By Type (2023-2030)
Figure 34 Europe Zero Liquid Discharge Systems Revenue (USD Million) By Applications (2023-2030)
Figure 35 Asia Pacific Zero Liquid Discharge Systems Revenue (USD Million) By Country (2023-2030)
Figure 36 Asia Pacific Zero Liquid Discharge Systems Revenue (USD Million) By Type (2023-2030)
Figure 37 Asia Pacific Zero Liquid Discharge Systems Revenue (USD Million) By Applications (2023-2030)
Figure 38 South America Zero Liquid Discharge Systems Revenue (USD Million) By Country (2023-2030)
Figure 39 South America Zero Liquid Discharge Systems Revenue (USD Million) By Type (2023-2030)
Figure 40 South America Zero Liquid Discharge Systems Revenue (USD Million) By Applications (2023-2030)
Figure 41 Middle East and Africa Zero Liquid Discharge Systems Revenue (USD Million) By Region (2023-2030)
Figure 42 Middle East and Africa Zero Liquid Discharge Systems Revenue (USD Million) By Region (2023-2030)
Figure 43 Middle East and Africa Zero Liquid Discharge Systems Revenue (USD Million) By Type (2023-2030)
Figure 44 Middle East and Africa Zero Liquid Discharge Systems Revenue (USD Million) By Applications (2023-2030)
Figure 45 Bottom-Up and Top-Down Approaches For This Report
Figure 46 Data Triangulation
