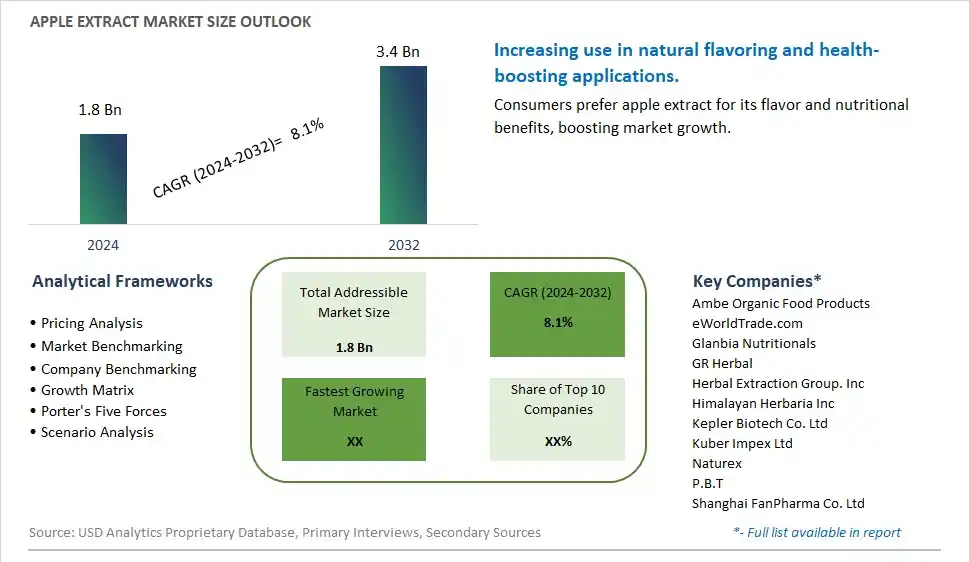
Global Apple Extract Market Size is valued at $1.8 Billion in 2024 and is forecast to register a growth rate (CAGR) of 8.1% to reach $3.4 Billion by 2032.
The global Apple Extract Market Comprehensive Study analyzes and forecasts the market size across 6 regions and 24 countries for diverse segments -By Form (Powder, Liquid), By Application (Food & Beverage, Cosmetics, Nutraceuticals, Others), By Sales Channel (B2B, B2C)
An Introduction to Apple Extract Market
In 2024, the apple extract market is thriving, fueled by the demand for natural ingredients that offer health benefits and flavor enhancement in various applications. Apple extract, rich in antioxidants and polyphenols, is used in food, beverages, and dietary supplements. The market benefits from advancements in extraction and processing technologies that preserve the nutritional integrity and potency of apple extracts. The trend towards clean label and natural ingredients is influencing product development. Increasing consumer interest in functional foods and the popularity of natural flavorings are further supporting market growth.
Apple Extract Competitive Landscape
The market report analyses the leading companies in the industry including Ambe Organic Food Products, eWorldTrade.com, Glanbia Nutritionals, GR Herbal, Herbal Extraction Group. Inc, Himalayan Herbaria Inc, Kepler Biotech Co. Ltd, Kuber Impex Ltd, Naturex, P.B.T, Shanghai FanPharma Co. Ltd, and Others.
Apple Extract Market Dynamics
Apple Extract Market Trend: Increasing Use in Nutraceuticals and Functional Foods
The most prominent trend in the Apple Extract Market is the increasing use in nutraceuticals and functional foods. Apple extract, rich in antioxidants and phytonutrients, is being incorporated into a variety of health products, such as dietary supplements, fortified foods, and beverages. This trend is driven by the demand for natural ingredients that offer multiple health benefits and enhance the nutritional profile of consumer products.
Apple Extract Market Driver: Health Consciousness and Demand for Natural Ingredients
A key driver in the Apple Extract Market is health consciousness and the demand for natural ingredients. As more individuals focus on improving their diet and avoiding synthetic additives, there is a rising demand for apple extract that provides a natural and effective source of beneficial compounds. This demand supports the growth of the market as consumers seek out natural and minimally processed food ingredients.
Apple Extract Market Opportunity: Innovation in Product Development and Applications
One significant opportunity in the Apple Extract Market lies in innovation in product development and applications. Companies can create new products that utilize apple extract in various formulations, such as functional beverages, health supplements, and beauty products, offering consumers convenient and health-focused options. By highlighting the benefits and versatility of apple extract, manufacturers can attract a broader consumer base and drive market growth.
Apple Extract Market Share Analysis- Largest Segment by Form
In the Apple Extract Market, Powder is the largest segment. This dominance is attributed to the versatility and convenience of powdered apple extract. Powdered forms are preferred for their extended shelf life, ease of storage, and compatibility with a wide range of applications, including dietary supplements, functional foods, and baked goods. The powder form also facilitates precise dosing and integration into various product formulations without the need for refrigeration. Additionally, powdered apple extract often retains a higher concentration of nutrients compared to liquid forms, which enhances its appeal in the health and wellness sectors. These attributes make powdered apple extract the most substantial segment in the market.
Apple Extract Market Share Analysis- Poised to Grow Fastest Over the Next Five Years by Application
The Food & Beverage application segment in the Apple Extract Market is expected to grow the fastest over the next five years. This growth is driven by the rising consumer demand for natural and healthy ingredients in food and beverage products. Apple extract is valued for its natural sweetness, flavor enhancement, and nutritional benefits, making it a popular choice for product formulations in this sector. The increasing trend towards clean label and organic products, coupled with the growing popularity of functional foods, supports the expansion of apple extract usage in food and beverages. Additionally, innovations in product development and the rising demand for healthier alternatives contribute to the rapid growth of this segment.
Apple Extract Market Share Analysis- Largest Segment by Sales Channel
The B2B (Business-to-Business) segment is the largest in the Apple Extract Market. This predominance is due to the high volume and bulk requirements of apple extract used in manufacturing and commercial applications. B2B transactions involve large-scale orders for use in food and beverage production, dietary supplements, and industrial applications. Companies in these sectors prefer B2B purchases to secure consistent supply and potentially lower costs associated with bulk buying. The scale of operations and the need for large quantities of apple extract for production processes make the B2B channel the largest segment in the market.
Apple Extract Market Segmentation
By Form
Powder
Liquid
By Application
Food & Beverage
Cosmetics
Nutraceuticals
Others
By Sales Channel
B2B
B2C
Countries Analyzed
North America (US, Canada, Mexico)
Europe (Germany, UK, France, Spain, Italy, Russia, Rest of Europe)
Asia Pacific (China, India, Japan, South Korea, Australia, South East Asia, Rest of Asia)
South America (Brazil, Argentina, Rest of South America)
Middle East and Africa (Saudi Arabia, UAE, Rest of Middle East, South Africa, Egypt, Rest of Africa)
Apple Extract Companies Profiled in the Study
Ambe Organic Food Products
eWorldTrade.com
Glanbia Nutritionals
GR Herbal
Herbal Extraction Group. Inc
Himalayan Herbaria Inc
Kepler Biotech Co. Ltd
Kuber Impex Ltd
Naturex
P.B.T
Shanghai FanPharma Co. Ltd
*- List Not Exhaustive
Chapter 1. TABLE OF CONTENTS
Chapter 2. Introduction to Apple Extract Market
2.1. Market Overview
2.2. Key Statistics and Report Highlights
2.3. Scope of the Comprehensive Study
2.3.1. Market Definition
2.3.2 Countries and Regions Covered
2.3.3 Research Objective
2.3.4 Units, Currency, and Conversions
2.3.5 Industry Value Chain
2.4. Key Market Segments
2.5. Key Companies
2.6. Study Period
Chapter 3. Strategic Analysis Review
3.1. Apple Extract Pricing Analysis and Forecast
3.2. Porter’s Five Forces
3.3. Market Ecosystem
3.4. SWOT Analysis
3.5. Regulatory Scenario
3.3. Effects of Inflation, Russia-Ukraine War, moderating economic growth, and other macroeconomic factors
Chapter 4. Competitive Landscape
4.1. Market Share Analysis
4.1.1. Global Apple Extract Market Share by Company, 2023
4.1.2. Product Offerings of Leading Apple Extract Companies
4.2. Market Entropy
4.2.1. New Product Launches in the Industry
4.2.2. Mergers, Acquisitions, Joint ventures, and Partnerships
4.3. Key Strategies and Best Practices
Chapter 5. Global Market Projections: Best, Reference, and Low Case Scenarios
5.1. Growth Analysis- Case Scenario Definitions
5.2. Low Growth Case Scenario Forecasts
5.3. Reference Growth Case Scenario Forecasts
5.4. High Growth Case Scenario Forecasts
Chapter 6. Market Dynamics
6.1. Apple Extract Market Drivers
6.2. Apple Extract Market Challenges
6.6. Apple Extract Market Opportunities
6.4. Apple Extract Market Trends
Chapter 7. Global Apple Extract Market Outlook Trends
7.1. Global Apple Extract Revenue (USD Million) and CAGR (%) by Type (2021-2032)
7.2. Global Apple Extract Revenue (USD Million) and CAGR (%) by Application (2021-2032)
7.3. Global Apple Extract Revenue (USD Million) and CAGR (%) by Product (2021-2032)
By Form
Powder
Liquid
By Application
Food & Beverage
Cosmetics
Nutraceuticals
Others
By Sales Channel
B2B
B2C
Chapter 8. Global Apple Extract Regional Analysis and Outlook
8.1. Global Apple Extract Revenue (USD Million) By Regions (2021- 2032)
8.2. North America Apple Extract Revenue (USD Million) by Country (2021-2032)
8.2.1. United States Apple Extract Regional Analysis and Outlook
8.2.2. Canada Apple Extract Regional Analysis and Outlook
8.2.3. Mexico Apple Extract Regional Analysis and Outlook
8.3. Europe Apple Extract Revenue (USD Million), by Country (2021-2032)
8.3.1. Germany Apple Extract Regional Analysis and Outlook
8.3.2. France Apple Extract Regional Analysis and Outlook
8.3.3. United Kingdom Apple Extract Regional Analysis and Outlook
8.3.4. Spain Apple Extract Regional Analysis and Outlook
8.3.5. Italy Apple Extract Regional Analysis and Outlook
8.3.6. Russia Apple Extract Regional Analysis and Outlook
8.3.7. Rest of Europe Apple Extract Regional Analysis and Outlook
8.4. Asia Pacific Apple Extract Revenue (USD Million) by Country (2021-2032)
8.4.1. China Apple Extract Regional Analysis and Outlook
8.4.2. Japan Apple Extract Regional Analysis and Outlook
8.4.3. India Apple Extract Regional Analysis and Outlook
8.4.4. South Korea Apple Extract Regional Analysis and Outlook
8.4.5. Australia Apple Extract Regional Analysis and Outlook
8.4.6. South East Asia Apple Extract Regional Analysis and Outlook
8.4.7. Rest of Asia Pacific Apple Extract Regional Analysis and Outlook
8.5. South America Apple Extract Revenue (USD Million), by Country (2021-2032)
8.5.1. Brazil Apple Extract Regional Analysis and Outlook
8.5.2. Argentina Apple Extract Regional Analysis and Outlook
8.5.3. Rest of South America Apple Extract Regional Analysis and Outlook
8.6. Middle East and Africa Apple Extract Revenue (USD Million) by Country (2021-2032)
8.6.1. Middle East Apple Extract Regional Analysis and Outlook
8.6.2. Africa Apple Extract Regional Analysis and Outlook
Chapter 9. North America Apple Extract Analysis and Outlook
9.1. North America Apple Extract Revenue (USD Million) by Segments (2021-2032)
9.1.1. North America Apple Extract Revenue (USD Million) by Type (2021-2032)
9.1.2. North America Apple Extract Revenue (USD Million) by Application (2021-2032)
9.1.3. North America Apple Extract Revenue (USD Million) by Product (2021-2032)
By Form
Powder
Liquid
By Application
Food & Beverage
Cosmetics
Nutraceuticals
Others
By Sales Channel
B2B
B2C
Chapter 10. Europe Apple Extract Analysis and Outlook
10.1. Europe Apple Extract Revenue (USD Million), by Segments (USD Million) (2021-2032)
10.1.1. Europe Apple Extract Revenue (USD Million) by Type (2021-2032)
10.1.2. Europe Apple Extract Revenue (USD Million) by Application (2021-2032)
10.1.3. Europe Apple Extract Revenue (USD Million) by Product (2021-2032)
By Form
Powder
Liquid
By Application
Food & Beverage
Cosmetics
Nutraceuticals
Others
By Sales Channel
B2B
B2C
Chapter 11. Asia Pacific Apple Extract Analysis and Outlook
11.1. Asia Pacific Apple Extract Revenue (USD Million), and Revenue (USD Million) by Segments (2021-2032)
11.1.1. Asia Pacific Apple Extract Revenue (USD Million) by Type (2021-2032)
11.1.2. Asia Pacific Apple Extract Revenue (USD Million) by Application (2021-2032)
11.1.3. Asia Pacific Apple Extract Revenue (USD Million) by Product (2021-2032)
By Form
Powder
Liquid
By Application
Food & Beverage
Cosmetics
Nutraceuticals
Others
By Sales Channel
B2B
B2C
Chapter 12. South America Apple Extract Analysis and Outlook
12.1. South America Apple Extract Revenue (USD Million), by Segments (2021-2032)
12.1.1. South America Apple Extract Revenue (USD Million) by Type (2021-2032)
12.1.2. South America Apple Extract Revenue (USD Million) by Application (2021-2032)
12.1.3. South America Apple Extract Revenue (USD Million) by Product (2021-2032)
By Form
Powder
Liquid
By Application
Food & Beverage
Cosmetics
Nutraceuticals
Others
By Sales Channel
B2B
B2C
Chapter 13. Middle East and Africa Apple Extract Analysis and Outlook
13.1. Middle East and Africa Apple Extract Revenue (USD Million), by Segments (2021-2032)
13.1.1. Middle East and Africa Apple Extract Revenue (USD Million) by Type (2021-2032)
13.1.2. Middle East and Africa Apple Extract Revenue (USD Million) by Application (2021-2032)
13.1.3. Middle East and Africa Apple Extract Revenue (USD Million) by Product (2021-2032)
By Form
Powder
Liquid
By Application
Food & Beverage
Cosmetics
Nutraceuticals
Others
By Sales Channel
B2B
B2C
Chapter 14. Apple Extract Company Profiles
14.1 Business Overview
14.2 Product Profiles
14.3 SWOT Profiles
14.5 Recent Developments
14.6 Financial Profile
List of Companies
Ambe Organic Food Products
eWorldTrade.com
Glanbia Nutritionals
GR Herbal
Herbal Extraction Group. Inc
Himalayan Herbaria Inc
Kepler Biotech Co. Ltd
Kuber Impex Ltd
Naturex
P.B.T
Shanghai FanPharma Co. Ltd
15. Methodology and Data Sources
15.1 Customization Offerings
15.2 Subscription Services
15.3 Related Reports
15.4 Publisher Expertise
LIST OF TABLES
Table 1 Market Segmentation Analysis
Table 2 Global Apple Extract Market Share of Leading Companies, 2023
Table 3 Product Offerings of Leading Companies
Table 4 Low Growth Scenario Forecasts
Table 5 Reference Case Growth Scenario
Table 6 High Growth Case Scenario
Table 7 Global Apple Extract Revenue (USD Million) And CAGR (%) By Type (2021-2032)
Table 8 Global Apple Extract Revenue (USD Million) And CAGR (%) By Application (2021-2032)
Table 9 Global Apple Extract Revenue (USD Million) And CAGR (%) By Product (2021-2032)
Table 10 Global Apple Extract Market Revenue (USD Million) By Regions (2021-2032)
Table 11 Global Apple Extract Market Share (%) By Regions (2021-2032)
Table 12 North America Apple Extract Revenue (USD Million) By Country (2021-2032)
Table 13 Europe Apple Extract Revenue (USD Million) By Country (2021-2032)
Table 14 Asia Pacific Apple Extract Revenue (USD Million) By Country (2021-2032)
Table 15 South America Apple Extract Revenue (USD Million) By Country (2021-2032)
Table 16 Middle East and Africa Apple Extract Revenue (USD Million) By Region (2021-2032)
Table 17 North America Apple Extract Revenue (USD Million) By Type (2021-2032)
Table 18 North America Apple Extract Revenue (USD Million) By Application (2021-2032)
Table 19 North America Apple Extract Revenue (USD Million) By Product (2021-2032)
Table 20 Europe Apple Extract Revenue (USD Million) By Type (2021-2032)
Table 21 Europe Apple Extract Revenue (USD Million) By Application (2021-2032)
Table 22 Europe Apple Extract Revenue (USD Million) By Product (2021-2032)
Table 23 Asia Pacific Apple Extract Revenue (USD Million) By Type (2021-2032)
Table 24 Asia Pacific Apple Extract Revenue (USD Million) By Application (2021-2032)
Table 25 Asia Pacific Apple Extract Revenue (USD Million) By Product (2021-2032)
Table 26 South America Apple Extract Revenue (USD Million) By Type (2021-2032)
Table 27 South America Apple Extract Revenue (USD Million) By Application (2021-2032)
Table 28 South America Apple Extract Revenue (USD Million) By Product (2021-2032)
Table 29 Middle East and Africa Apple Extract Revenue (USD Million) By Type (2021-2032)
Table 30 Middle East and Africa Apple Extract Revenue (USD Million) By Application (2021-2032)
Table 31 Middle East and Africa Apple Extract Revenue (USD Million) By Product (2021-2032)
LIST OF FIGURES
Figure 1. Market Scope
Figure 2. Pricing Forecasts Per Unit, 2023- 2032
Figure 3. Porter’s Five Forces
Figure 4. Global Apple Extract Market Revenue (USD Million) By Regions (2021-2032)
Figure 5. Global Apple Extract Market Share (%) By Regions (2023)
Figure 6. North America Apple Extract Revenue (USD Million) By Country (2021-2032)
Figure 7. United States Apple Extract Revenue (USD Million) By Country (2021-2032)
Figure 8. Canada Apple Extract Revenue (USD Million) By Country (2021-2032)
Figure 9. Mexico Apple Extract Revenue (USD Million) By Country (2021-2032)
Figure 10. Europe Apple Extract Revenue (USD Million) By Country (2021-2032)
Figure 11. Germany Apple Extract Revenue (USD Million) By Country (2021-2032)
Figure 12. France Apple Extract Revenue (USD Million) By Country (2021-2032)
Figure 13. United Kingdom Apple Extract Revenue (USD Million) By Country (2021-2032)
Figure 14. Spain Apple Extract Revenue (USD Million) By Country (2021-2032)
Figure 15. Italy Apple Extract Revenue (USD Million) By Country (2021-2032)
Figure 16. Russia Apple Extract Revenue (USD Million) By Country (2021-2032)
Figure 17. Rest of Europe Apple Extract Revenue (USD Million) By Country (2021-2032)
Figure 11. Asia Pacific Apple Extract Revenue (USD Million) By Country (2021-2032)
Figure 12. China Apple Extract Revenue (USD Million) By Country (2021-2032)
Figure 13. Japan Apple Extract Revenue (USD Million) By Country (2021-2032)
Figure 14. India Apple Extract Revenue (USD Million) By Country (2021-2032)
Figure 15. South Korea Apple Extract Revenue (USD Million) By Country (2021-2032)
Figure 16. Australia Apple Extract Revenue (USD Million) By Country (2021-2032)
Figure 17. South East Asia Apple Extract Revenue (USD Million) By Country (2021-2032)
Figure 18. South America Apple Extract Revenue (USD Million) By Country (2021-2032)
Figure 19. Brazil Apple Extract Revenue (USD Million) By Country (2021-2032)
Figure 20. Argentina Apple Extract Revenue (USD Million) By Country (2021-2032)
Figure 21. Rest of Asia Pacific Apple Extract Revenue (USD Million) By Country (2021-2032)
Figure 22. Middle East and Africa Apple Extract Revenue (USD Million) By Region (2021-2032)
Figure 23. Saudi Arabia Apple Extract Revenue (USD Million) By Region (2021-2032)
Figure 24. The UAE Apple Extract Revenue (USD Million) By Region (2021-2032)
Figure 25. Rest of Middle East Apple Extract Revenue (USD Million) By Region (2021-2032)
Figure 26. South Africa Apple Extract Revenue (USD Million) By Region (2021-2032)
Figure 27. Africa Apple Extract Revenue (USD Million) By Region (2021-2032)
Figure 28. North America Apple Extract Revenue (USD Million) By Type (2021-2032)
Figure 29. North America Apple Extract Revenue (USD Million) By Application (2021-2032)
Figure 30. North America Apple Extract Revenue (USD Million) By Product (2021-2032)
Figure 31. Europe Apple Extract Revenue (USD Million) By Type (2021-2032)
Figure 32. Europe Apple Extract Revenue (USD Million) By Application (2021-2032)
Figure 33. Europe Apple Extract Revenue (USD Million) By Product (2021-2032)
Figure 34. Asia Pacific Apple Extract Revenue (USD Million) By Type (2021-2032)
Figure 35. Asia Pacific Apple Extract Revenue (USD Million) By Application (2021-2032)
Figure 36. Asia Pacific Apple Extract Revenue (USD Million) By Product (2021-2032)
Figure 37. South America Apple Extract Revenue (USD Million) By Type (2021-2032)
Figure 38. South America Apple Extract Revenue (USD Million) By Application (2021-2032)
Figure 39. South America Apple Extract Revenue (USD Million) By Product (2021-2032)
Figure 40. Middle East and Africa Apple Extract Revenue (USD Million) By Type (2021-2032)
Figure 41. Middle East and Africa Apple Extract Revenue (USD Million) By Application (2021-2032)
Figure 42. Middle East and Africa Apple Extract Revenue (USD Million) By Product (2021-2032)
By Form
Powder
Liquid
By Application
Food & Beverage
Cosmetics
Nutraceuticals
Others
By Sales Channel
B2B
B2C
Countries Analyzed
North America (US, Canada, Mexico)
Europe (Germany, UK, France, Spain, Italy, Russia, Rest of Europe)
Asia Pacific (China, India, Japan, South Korea, Australia, South East Asia, Rest of Asia)
South America (Brazil, Argentina, Rest of South America)
Middle East and Africa (Saudi Arabia, UAE, Rest of Middle East, South Africa, Egypt, Rest of Africa)
