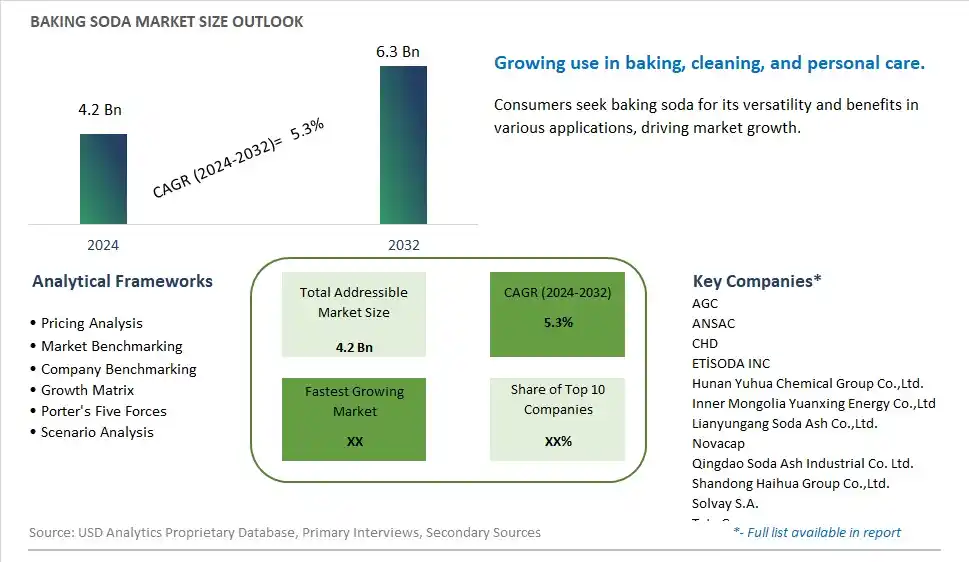
Global Baking Soda Market Size is valued at $4.2 Billion in 2024 and is forecast to register a growth rate (CAGR) of 5.3% to reach $6.3 Billion by 2032.
The global Baking Soda Market Comprehensive Study analyzes and forecasts the market size across 6 regions and 24 countries for diverse segments -By Packaging (Cartons, Pouches, Others), By Type (Soda Ash, Double Decomposition, Natural Soda), By Distribution Channel (Supermarkets/Hypermarkets, Convenience Stores, Online retail, Others)
An Introduction to Baking Soda Market
In 2024, the baking soda market is thriving, fueled by the demand for versatile and effective leavening agents and household products. Baking soda, known for its leavening, cleaning, and deodorizing properties, is used in baking, cleaning, and personal care products. The market benefits from advancements in production and packaging technologies that enhance product purity and usability. The trend towards clean label and natural ingredients is influencing product development. Increasing consumer interest in natural and multifunctional household products, supported by the popularity of home baking, is further supporting market growth.
Baking Soda Competitive Landscape
The market report analyses the leading companies in the industry including AGC, ANSAC, CHD, ETÄ°SODA INC, Hunan Yuhua Chemical Group Co.,Ltd., Inner Mongolia Yuanxing Energy Co.,Ltd, Lianyungang Soda Ash Co.,Ltd., Novacap, Qingdao Soda Ash Industrial Co. Ltd., Shandong Haihua Group Co.,Ltd., Solvay S.A., Tata Group, Tianjin Bohai Wynn Chemical Co.,Ltd., Tosoh, and Others.
Baking Soda Market Dynamics
Baking Soda Market Trend: Growing Use of Baking Soda in Natural Cleaning Products
The most prominent trend in the Baking Soda Market is the growing use of baking soda in natural cleaning products. Consumers are increasingly looking for eco-friendly and non-toxic cleaning solutions, leading to a surge in demand for baking soda as a versatile and effective cleaning agent. This trend is part of a broader movement towards sustainable and health-conscious household products.
Baking Soda Market Driver: Rising Awareness of Multi-purpose Applications
A key driver in the Baking Soda Market is the rising awareness of its multi-purpose applications. Beyond baking, consumers are recognizing the benefits of baking soda for cleaning, deodorizing, personal care, and even as a health supplement. This versatility drives market growth as more consumers incorporate baking soda into various aspects of their daily lives.
Baking Soda Market Opportunity: Expansion into Specialized Health and Beauty Products
One significant opportunity in the Baking Soda Market lies in the expansion into specialized health and beauty products. Companies can develop new baking soda-based products, such as toothpaste, skincare items, and bath products, highlighting its natural and beneficial properties. By creating innovative health and beauty solutions, manufacturers can attract health-conscious consumers and expand their market presence.
Baking Soda Market Share Analysis- Largest Segment by Packaging
In the Baking Soda Market, Cartons are the largest packaging segment. This predominance is primarily due to the versatility and bulk purchasing preferences associated with cartons. Cartons are preferred by both commercial users and large-scale consumers for their cost-effectiveness and ability to store larger quantities, which is essential for frequent use in industrial baking and food processing. The convenience of bulk packaging in cartons also supports the widespread use of baking soda in various applications, including household cleaning, personal care products, and industrial uses. Consequently, cartons maintain their position as the largest segment in the baking soda market due to their practicality and efficiency in meeting high-volume demands.
Baking Soda Market Share Analysis- Poised to Grow Fastest Over the Next Five Years by Type
Natural Soda is set to grow the fastest in the Baking Soda Market over the next five years. This growth is driven by increasing consumer and industry preference for natural and environmentally friendly products. Natural soda, derived from natural sources such as trona ore, offers a more sustainable alternative to synthetic soda ash and double decomposition methods. With rising awareness about eco-friendly products and the demand for natural ingredients across various sectors, including food, pharmaceuticals, and personal care, natural soda's growth is accelerated. Additionally, its application in organic and natural product lines aligns with current market trends, making it the fastest-growing type in the baking soda market.
Baking Soda Market Share Analysis- Largest Segment by Distribution Channel
In the Baking Soda Market, Supermarkets/Hypermarkets represent the largest distribution channel. This dominance is due to the extensive reach and high footfall of these retail formats, which make them ideal for distributing baking soda to a broad consumer base. Supermarkets and hypermarkets offer a wide range of products and are often the primary shopping destinations for household staples, including baking soda. Their capacity to stock large quantities and offer competitive pricing further solidifies their position as the largest distribution channel. Additionally, the convenience of one-stop shopping for various household and food items drives continued reliance on supermarkets and hypermarkets for baking soda purchases.
Baking Soda Market Segmentation
By Packaging
Cartons
Pouches
Others
By Type
Soda Ash
Double Decomposition
Natural Soda
By Distribution Channel
Supermarkets/Hypermarkets
Convenience Stores
Online retail
Others
Countries Analyzed
North America (US, Canada, Mexico)
Europe (Germany, UK, France, Spain, Italy, Russia, Rest of Europe)
Asia Pacific (China, India, Japan, South Korea, Australia, South East Asia, Rest of Asia)
South America (Brazil, Argentina, Rest of South America)
Middle East and Africa (Saudi Arabia, UAE, Rest of Middle East, South Africa, Egypt, Rest of Africa)
Baking Soda Companies Profiled in the Study
AGC
ANSAC
CHD
ETÄ°SODA INC
Hunan Yuhua Chemical Group Co.,Ltd.
Inner Mongolia Yuanxing Energy Co.,Ltd
Lianyungang Soda Ash Co.,Ltd.
Novacap
Qingdao Soda Ash Industrial Co. Ltd.
Shandong Haihua Group Co.,Ltd.
Solvay S.A.
Tata Group
Tianjin Bohai Wynn Chemical Co.,Ltd.
Tosoh
*- List Not Exhaustive
Chapter 1. TABLE OF CONTENTS
Chapter 2. Introduction to Baking Soda Market
2.1. Market Overview
2.2. Key Statistics and Report Highlights
2.3. Scope of the Comprehensive Study
2.3.1. Market Definition
2.3.2 Countries and Regions Covered
2.3.3 Research Objective
2.3.4 Units, Currency, and Conversions
2.3.5 Industry Value Chain
2.4. Key Market Segments
2.5. Key Companies
2.6. Study Period
Chapter 3. Strategic Analysis Review
3.1. Baking Soda Pricing Analysis and Forecast
3.2. Porter’s Five Forces
3.3. Market Ecosystem
3.4. SWOT Analysis
3.5. Regulatory Scenario
3.3. Effects of Inflation, Russia-Ukraine War, moderating economic growth, and other macroeconomic factors
Chapter 4. Competitive Landscape
4.1. Market Share Analysis
4.1.1. Global Baking Soda Market Share by Company, 2023
4.1.2. Product Offerings of Leading Baking Soda Companies
4.2. Market Entropy
4.2.1. New Product Launches in the Industry
4.2.2. Mergers, Acquisitions, Joint ventures, and Partnerships
4.3. Key Strategies and Best Practices
Chapter 5. Global Market Projections: Best, Reference, and Low Case Scenarios
5.1. Growth Analysis- Case Scenario Definitions
5.2. Low Growth Case Scenario Forecasts
5.3. Reference Growth Case Scenario Forecasts
5.4. High Growth Case Scenario Forecasts
Chapter 6. Market Dynamics
6.1. Baking Soda Market Drivers
6.2. Baking Soda Market Challenges
6.6. Baking Soda Market Opportunities
6.4. Baking Soda Market Trends
Chapter 7. Global Baking Soda Market Outlook Trends
7.1. Global Baking Soda Revenue (USD Million) and CAGR (%) by Type (2021-2032)
7.2. Global Baking Soda Revenue (USD Million) and CAGR (%) by Application (2021-2032)
7.3. Global Baking Soda Revenue (USD Million) and CAGR (%) by Product (2021-2032)
By Packaging
Cartons
Pouches
Others
By Type
Soda Ash
Double Decomposition
Natural Soda
By Distribution Channel
Supermarkets/Hypermarkets
Convenience Stores
Online retail
Others
Chapter 8. Global Baking Soda Regional Analysis and Outlook
8.1. Global Baking Soda Revenue (USD Million) By Regions (2021- 2032)
8.2. North America Baking Soda Revenue (USD Million) by Country (2021-2032)
8.2.1. United States Baking Soda Regional Analysis and Outlook
8.2.2. Canada Baking Soda Regional Analysis and Outlook
8.2.3. Mexico Baking Soda Regional Analysis and Outlook
8.3. Europe Baking Soda Revenue (USD Million), by Country (2021-2032)
8.3.1. Germany Baking Soda Regional Analysis and Outlook
8.3.2. France Baking Soda Regional Analysis and Outlook
8.3.3. United Kingdom Baking Soda Regional Analysis and Outlook
8.3.4. Spain Baking Soda Regional Analysis and Outlook
8.3.5. Italy Baking Soda Regional Analysis and Outlook
8.3.6. Russia Baking Soda Regional Analysis and Outlook
8.3.7. Rest of Europe Baking Soda Regional Analysis and Outlook
8.4. Asia Pacific Baking Soda Revenue (USD Million) by Country (2021-2032)
8.4.1. China Baking Soda Regional Analysis and Outlook
8.4.2. Japan Baking Soda Regional Analysis and Outlook
8.4.3. India Baking Soda Regional Analysis and Outlook
8.4.4. South Korea Baking Soda Regional Analysis and Outlook
8.4.5. Australia Baking Soda Regional Analysis and Outlook
8.4.6. South East Asia Baking Soda Regional Analysis and Outlook
8.4.7. Rest of Asia Pacific Baking Soda Regional Analysis and Outlook
8.5. South America Baking Soda Revenue (USD Million), by Country (2021-2032)
8.5.1. Brazil Baking Soda Regional Analysis and Outlook
8.5.2. Argentina Baking Soda Regional Analysis and Outlook
8.5.3. Rest of South America Baking Soda Regional Analysis and Outlook
8.6. Middle East and Africa Baking Soda Revenue (USD Million) by Country (2021-2032)
8.6.1. Middle East Baking Soda Regional Analysis and Outlook
8.6.2. Africa Baking Soda Regional Analysis and Outlook
Chapter 9. North America Baking Soda Analysis and Outlook
9.1. North America Baking Soda Revenue (USD Million) by Segments (2021-2032)
9.1.1. North America Baking Soda Revenue (USD Million) by Type (2021-2032)
9.1.2. North America Baking Soda Revenue (USD Million) by Application (2021-2032)
9.1.3. North America Baking Soda Revenue (USD Million) by Product (2021-2032)
By Packaging
Cartons
Pouches
Others
By Type
Soda Ash
Double Decomposition
Natural Soda
By Distribution Channel
Supermarkets/Hypermarkets
Convenience Stores
Online retail
Others
Chapter 10. Europe Baking Soda Analysis and Outlook
10.1. Europe Baking Soda Revenue (USD Million), by Segments (USD Million) (2021-2032)
10.1.1. Europe Baking Soda Revenue (USD Million) by Type (2021-2032)
10.1.2. Europe Baking Soda Revenue (USD Million) by Application (2021-2032)
10.1.3. Europe Baking Soda Revenue (USD Million) by Product (2021-2032)
By Packaging
Cartons
Pouches
Others
By Type
Soda Ash
Double Decomposition
Natural Soda
By Distribution Channel
Supermarkets/Hypermarkets
Convenience Stores
Online retail
Others
Chapter 11. Asia Pacific Baking Soda Analysis and Outlook
11.1. Asia Pacific Baking Soda Revenue (USD Million), and Revenue (USD Million) by Segments (2021-2032)
11.1.1. Asia Pacific Baking Soda Revenue (USD Million) by Type (2021-2032)
11.1.2. Asia Pacific Baking Soda Revenue (USD Million) by Application (2021-2032)
11.1.3. Asia Pacific Baking Soda Revenue (USD Million) by Product (2021-2032)
By Packaging
Cartons
Pouches
Others
By Type
Soda Ash
Double Decomposition
Natural Soda
By Distribution Channel
Supermarkets/Hypermarkets
Convenience Stores
Online retail
Others
Chapter 12. South America Baking Soda Analysis and Outlook
12.1. South America Baking Soda Revenue (USD Million), by Segments (2021-2032)
12.1.1. South America Baking Soda Revenue (USD Million) by Type (2021-2032)
12.1.2. South America Baking Soda Revenue (USD Million) by Application (2021-2032)
12.1.3. South America Baking Soda Revenue (USD Million) by Product (2021-2032)
By Packaging
Cartons
Pouches
Others
By Type
Soda Ash
Double Decomposition
Natural Soda
By Distribution Channel
Supermarkets/Hypermarkets
Convenience Stores
Online retail
Others
Chapter 13. Middle East and Africa Baking Soda Analysis and Outlook
13.1. Middle East and Africa Baking Soda Revenue (USD Million), by Segments (2021-2032)
13.1.1. Middle East and Africa Baking Soda Revenue (USD Million) by Type (2021-2032)
13.1.2. Middle East and Africa Baking Soda Revenue (USD Million) by Application (2021-2032)
13.1.3. Middle East and Africa Baking Soda Revenue (USD Million) by Product (2021-2032)
By Packaging
Cartons
Pouches
Others
By Type
Soda Ash
Double Decomposition
Natural Soda
By Distribution Channel
Supermarkets/Hypermarkets
Convenience Stores
Online retail
Others
Chapter 14. Baking Soda Company Profiles
14.1 Business Overview
14.2 Product Profiles
14.3 SWOT Profiles
14.5 Recent Developments
14.6 Financial Profile
List of Companies
AGC
ANSAC
CHD
ETÄ°SODA INC
Hunan Yuhua Chemical Group Co.,Ltd.
Inner Mongolia Yuanxing Energy Co.,Ltd
Lianyungang Soda Ash Co.,Ltd.
Novacap
Qingdao Soda Ash Industrial Co. Ltd.
Shandong Haihua Group Co.,Ltd.
Solvay S.A.
Tata Group
Tianjin Bohai Wynn Chemical Co.,Ltd.
Tosoh
15. Methodology and Data Sources
15.1 Customization Offerings
15.2 Subscription Services
15.3 Related Reports
15.4 Publisher Expertise
LIST OF TABLES
Table 1 Market Segmentation Analysis
Table 2 Global Baking Soda Market Share of Leading Companies, 2023
Table 3 Product Offerings of Leading Companies
Table 4 Low Growth Scenario Forecasts
Table 5 Reference Case Growth Scenario
Table 6 High Growth Case Scenario
Table 7 Global Baking Soda Revenue (USD Million) And CAGR (%) By Type (2021-2032)
Table 8 Global Baking Soda Revenue (USD Million) And CAGR (%) By Application (2021-2032)
Table 9 Global Baking Soda Revenue (USD Million) And CAGR (%) By Product (2021-2032)
Table 10 Global Baking Soda Market Revenue (USD Million) By Regions (2021-2032)
Table 11 Global Baking Soda Market Share (%) By Regions (2021-2032)
Table 12 North America Baking Soda Revenue (USD Million) By Country (2021-2032)
Table 13 Europe Baking Soda Revenue (USD Million) By Country (2021-2032)
Table 14 Asia Pacific Baking Soda Revenue (USD Million) By Country (2021-2032)
Table 15 South America Baking Soda Revenue (USD Million) By Country (2021-2032)
Table 16 Middle East and Africa Baking Soda Revenue (USD Million) By Region (2021-2032)
Table 17 North America Baking Soda Revenue (USD Million) By Type (2021-2032)
Table 18 North America Baking Soda Revenue (USD Million) By Application (2021-2032)
Table 19 North America Baking Soda Revenue (USD Million) By Product (2021-2032)
Table 20 Europe Baking Soda Revenue (USD Million) By Type (2021-2032)
Table 21 Europe Baking Soda Revenue (USD Million) By Application (2021-2032)
Table 22 Europe Baking Soda Revenue (USD Million) By Product (2021-2032)
Table 23 Asia Pacific Baking Soda Revenue (USD Million) By Type (2021-2032)
Table 24 Asia Pacific Baking Soda Revenue (USD Million) By Application (2021-2032)
Table 25 Asia Pacific Baking Soda Revenue (USD Million) By Product (2021-2032)
Table 26 South America Baking Soda Revenue (USD Million) By Type (2021-2032)
Table 27 South America Baking Soda Revenue (USD Million) By Application (2021-2032)
Table 28 South America Baking Soda Revenue (USD Million) By Product (2021-2032)
Table 29 Middle East and Africa Baking Soda Revenue (USD Million) By Type (2021-2032)
Table 30 Middle East and Africa Baking Soda Revenue (USD Million) By Application (2021-2032)
Table 31 Middle East and Africa Baking Soda Revenue (USD Million) By Product (2021-2032)
LIST OF FIGURES
Figure 1. Market Scope
Figure 2. Pricing Forecasts Per Unit, 2023- 2032
Figure 3. Porter’s Five Forces
Figure 4. Global Baking Soda Market Revenue (USD Million) By Regions (2021-2032)
Figure 5. Global Baking Soda Market Share (%) By Regions (2023)
Figure 6. North America Baking Soda Revenue (USD Million) By Country (2021-2032)
Figure 7. United States Baking Soda Revenue (USD Million) By Country (2021-2032)
Figure 8. Canada Baking Soda Revenue (USD Million) By Country (2021-2032)
Figure 9. Mexico Baking Soda Revenue (USD Million) By Country (2021-2032)
Figure 10. Europe Baking Soda Revenue (USD Million) By Country (2021-2032)
Figure 11. Germany Baking Soda Revenue (USD Million) By Country (2021-2032)
Figure 12. France Baking Soda Revenue (USD Million) By Country (2021-2032)
Figure 13. United Kingdom Baking Soda Revenue (USD Million) By Country (2021-2032)
Figure 14. Spain Baking Soda Revenue (USD Million) By Country (2021-2032)
Figure 15. Italy Baking Soda Revenue (USD Million) By Country (2021-2032)
Figure 16. Russia Baking Soda Revenue (USD Million) By Country (2021-2032)
Figure 17. Rest of Europe Baking Soda Revenue (USD Million) By Country (2021-2032)
Figure 11. Asia Pacific Baking Soda Revenue (USD Million) By Country (2021-2032)
Figure 12. China Baking Soda Revenue (USD Million) By Country (2021-2032)
Figure 13. Japan Baking Soda Revenue (USD Million) By Country (2021-2032)
Figure 14. India Baking Soda Revenue (USD Million) By Country (2021-2032)
Figure 15. South Korea Baking Soda Revenue (USD Million) By Country (2021-2032)
Figure 16. Australia Baking Soda Revenue (USD Million) By Country (2021-2032)
Figure 17. South East Asia Baking Soda Revenue (USD Million) By Country (2021-2032)
Figure 18. South America Baking Soda Revenue (USD Million) By Country (2021-2032)
Figure 19. Brazil Baking Soda Revenue (USD Million) By Country (2021-2032)
Figure 20. Argentina Baking Soda Revenue (USD Million) By Country (2021-2032)
Figure 21. Rest of Asia Pacific Baking Soda Revenue (USD Million) By Country (2021-2032)
Figure 22. Middle East and Africa Baking Soda Revenue (USD Million) By Region (2021-2032)
Figure 23. Saudi Arabia Baking Soda Revenue (USD Million) By Region (2021-2032)
Figure 24. The UAE Baking Soda Revenue (USD Million) By Region (2021-2032)
Figure 25. Rest of Middle East Baking Soda Revenue (USD Million) By Region (2021-2032)
Figure 26. South Africa Baking Soda Revenue (USD Million) By Region (2021-2032)
Figure 27. Africa Baking Soda Revenue (USD Million) By Region (2021-2032)
Figure 28. North America Baking Soda Revenue (USD Million) By Type (2021-2032)
Figure 29. North America Baking Soda Revenue (USD Million) By Application (2021-2032)
Figure 30. North America Baking Soda Revenue (USD Million) By Product (2021-2032)
Figure 31. Europe Baking Soda Revenue (USD Million) By Type (2021-2032)
Figure 32. Europe Baking Soda Revenue (USD Million) By Application (2021-2032)
Figure 33. Europe Baking Soda Revenue (USD Million) By Product (2021-2032)
Figure 34. Asia Pacific Baking Soda Revenue (USD Million) By Type (2021-2032)
Figure 35. Asia Pacific Baking Soda Revenue (USD Million) By Application (2021-2032)
Figure 36. Asia Pacific Baking Soda Revenue (USD Million) By Product (2021-2032)
Figure 37. South America Baking Soda Revenue (USD Million) By Type (2021-2032)
Figure 38. South America Baking Soda Revenue (USD Million) By Application (2021-2032)
Figure 39. South America Baking Soda Revenue (USD Million) By Product (2021-2032)
Figure 40. Middle East and Africa Baking Soda Revenue (USD Million) By Type (2021-2032)
Figure 41. Middle East and Africa Baking Soda Revenue (USD Million) By Application (2021-2032)
Figure 42. Middle East and Africa Baking Soda Revenue (USD Million) By Product (2021-2032)
By Packaging
Cartons
Pouches
Others
By Type
Soda Ash
Double Decomposition
Natural Soda
By Distribution Channel
Supermarkets/Hypermarkets
Convenience Stores
Online retail
Others
Countries Analyzed
North America (US, Canada, Mexico)
Europe (Germany, UK, France, Spain, Italy, Russia, Rest of Europe)
Asia Pacific (China, India, Japan, South Korea, Australia, South East Asia, Rest of Asia)
South America (Brazil, Argentina, Rest of South America)
Middle East and Africa (Saudi Arabia, UAE, Rest of Middle East, South Africa, Egypt, Rest of Africa)
