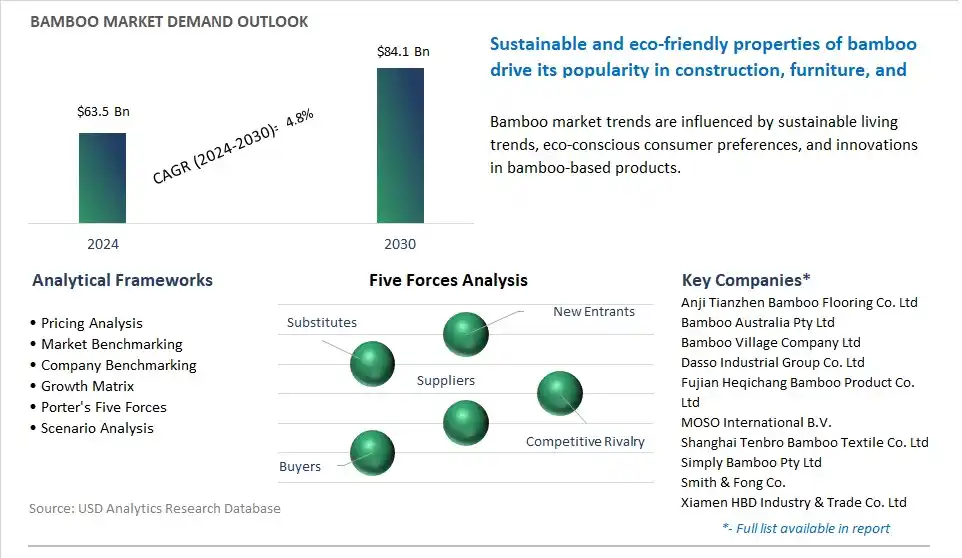
The global Bamboo Market is poised to register a 4.8% CAGR from $63.5 Billion in 2024 to $84.1 Billion in 2030.
The global Bamboo Market Study analyzes and forecasts the market size across 6 regions and 24 countries for diverse segments -By Application (Raw Material, Industrial Products, Furniture, Shoots, Others), By Species (Moso Bamboo, Bambusa Vulgaris, Others).
An Introduction to Global Bamboo Market in 2024
The market for bamboo products is witnessing growth driven by the increasing recognition of bamboo as a sustainable and versatile material in construction, furniture, textiles, and consumer goods industries. Key trends shaping the future of the industry include innovations in bamboo cultivation, processing technologies, and product applications to meet the demands for eco-friendly, renewable, and aesthetically appealing alternatives to traditional materials. Advanced bamboo products offer benefits such as strength, durability, flexibility, and rapid growth cycles, making them suitable for use in structural elements, flooring, decking, and home furnishings. Moreover, the integration of bamboo composites, engineered bamboo boards, and bamboo-based textiles expands the range of applications and performance characteristics, enabling designers and manufacturers to create innovative and sustainable products for diverse markets. Additionally, the growing emphasis on sustainable sourcing, carbon sequestration, and circular economy principles drives market demand for bamboo products that contribute to environmental conservation, biodiversity preservation, and climate change mitigation. As consumers and industries seek solutions to reduce environmental impact and promote sustainable living practices, the bamboo products market is poised for continued growth and innovation as a preferred choice for green building, interior design, and lifestyle products.
Bamboo Market Competitive Landscape
The market report analyses the leading companies in the industry including Anji Tianzhen Bamboo Flooring Co. Ltd, Bamboo Australia Pty Ltd, Bamboo Village Company Ltd, Dasso Industrial Group Co. Ltd, Fujian Heqichang Bamboo Product Co. Ltd, MOSO International B.V., Shanghai Tenbro Bamboo Textile Co. Ltd, Simply Bamboo Pty Ltd, Smith & Fong Co., Xiamen HBD Industry & Trade Co. Ltd.
Bamboo Market Dynamics
Bamboo Market Trend: Increasing Demand for Sustainable and Eco-Friendly Materials
A prominent trend in the bamboo market is the increasing demand for sustainable and eco-friendly materials across various industries. With growing concerns about environmental degradation and climate change, there is a rising preference for renewable resources such as bamboo, which is known for its fast growth rate, renewable nature, and minimal environmental impact. Bamboo is being utilized in diverse applications including construction, furniture, flooring, textiles, and packaging, as consumers and businesses seek alternatives to traditional materials with lower carbon footprints. This trend is driven by consumer awareness, corporate sustainability initiatives, and government regulations promoting green procurement practices, shaping the future of the bamboo market towards greater adoption of sustainable solutions.
Bamboo Market Driver: Versatility and Durability of Bamboo Products
The primary driver behind the growth of the bamboo market is the versatility and durability of bamboo products. Bamboo offers a wide range of applications due to its strength, flexibility, and natural properties such as resistance to pests, moisture, and mold. Bamboo-based products such as flooring, furniture, kitchenware, and clothing are increasingly favored for their durability, aesthetic appeal, and sustainable credentials. Moreover, advancements in bamboo processing technologies, such as laminating, pressing, and treatment methods, enable the production of high-quality and value-added bamboo products that meet the performance requirements of various industries. This driver is fueled by the increasing demand for durable and long-lasting materials in consumer and industrial sectors, stimulating market growth and investment in bamboo-based solutions.
Bamboo Market Opportunity: Expansion into New Industries and Applications
An opportunity for market growth within the bamboo sector lies in the expansion into new industries and applications beyond traditional uses. While construction, furniture, and textiles remain key markets for bamboo, there are untapped opportunities in sectors such as automotive, aerospace, energy, and healthcare. Bamboo-based materials can be utilized in applications such as automotive interiors, structural components, renewable energy production, and medical devices, offering advantages such as lightweight, strength, and biocompatibility. By leveraging its unique properties and versatility, bamboo manufacturers can explore new markets, develop innovative products, and unlock new revenue streams in dynamic and growing industries. Additionally, collaboration with industry partners, research institutions, and government agencies enables bamboo suppliers to address market needs, comply with regulatory requirements, and drive market expansion in emerging sectors.
Bamboo Market Share Analysis: Industrial Products segment generated the highest revenue in the industry
The Industrial Products segment is the largest segment in the Bamboo Market for diverse compelling reasons. The bamboo is widely used as a raw material for the production of various industrial products due to its exceptional properties such as strength, durability, flexibility, and sustainability. Industries such as construction, textiles, paper, pulp, and packaging utilize bamboo fibers, boards, and composites in the manufacturing of a wide range of products, including flooring, panels, boards, veneers, paper, pulp, and packaging materials. Additionally, bamboo-based industrial products offer diverse advantages over traditional materials such as wood, plastic, and metal, including faster growth rates, lower environmental impact, and renewable resources. In addition, the growing emphasis on sustainable development and eco-friendly alternatives drives the demand for bamboo-based industrial products as consumers and industries seek environmentally responsible solutions. Further, technological advancements in bamboo processing and manufacturing techniques enable the production of high-quality, value-added industrial products with improved performance characteristics and aesthetics. As industries continue to recognize the economic, environmental, and social benefits of bamboo as a versatile raw material, the Industrial Products segment solidifies its position as the largest segment in the Bamboo Market.
Bamboo Market Share Analysis: Moso Bamboo Segment is poised to register the fastest growth rate (CAGR) over the forecast period to 2030
The Moso Bamboo segment is the fastest-growing segment in the Bamboo Market for diverse compelling reasons. The Moso Bamboo (Phyllostachys edulis) is one of the most commercially important species of bamboo due to its rapid growth rate, versatility, and suitability for various applications. Moso Bamboo is known for its tall culms, which can reach heights of over 20 meters within a few months, making it one of the fastest-growing plants in the world. Additionally, Moso Bamboo is widely cultivated in China and other regions with suitable climates for bamboo cultivation, contributing to its availability and accessibility in the market. In addition, Moso Bamboo is valued for its strong and durable fibers, making it suitable for a wide range of applications such as construction, furniture, flooring, textiles, paper, and packaging. Further, the growing demand for sustainable and eco-friendly materials drives the popularity of Moso Bamboo as a renewable resource that offers environmental benefits such as carbon sequestration, soil conservation, and biodiversity preservation. As industries and consumers increasingly prioritize sustainability and seek alternatives to traditional materials, the Moso Bamboo segment experiences rapid growth, positioning it as the fastest-growing segment in the Bamboo Market.
Bamboo Market Report Segmentation
By Application
Raw Material
Industrial Products
Furniture
Shoots
Others
By Species
Moso Bamboo
Bambusa Vulgaris
Others
Regions Included
North America (US, Canada, Mexico)
Europe (Germany, UK, France, Spain, Italy, Russia, Rest of Europe)
Asia Pacific (China, India, Japan, South Korea, Australia, South East Asia, Rest of Asia)
South America (Brazil, Argentina, Rest of South America)
Middle East and Africa (Saudi Arabia, UAE, Rest of Middle East, South Africa, Egypt, Rest of Africa)
Bamboo Companies Profiled in the Market Study
Anji Tianzhen Bamboo Flooring Co. Ltd
Bamboo Australia Pty Ltd
Bamboo Village Company Ltd
Dasso Industrial Group Co. Ltd
Fujian Heqichang Bamboo Product Co. Ltd
MOSO International B.V.
Shanghai Tenbro Bamboo Textile Co. Ltd
Simply Bamboo Pty Ltd
Smith & Fong Co.
Xiamen HBD Industry & Trade Co. Ltd
*- List Not Exhaustive
TABLE OF CONTENTS
1 Introduction to 2024 Bamboo Market
1.1 Market Overview
1.2 Quick Facts
1.3 Scope/Objective of the Study
1.4 Market Definition
1.5 Countries and Regions Covered
1.6 Units, Currency, and Conversions
1.7 Industry Value Chain
2 Research Methodology
2.1 Market Size Estimation
2.2 Sources and Research Methodology
2.3 Data Triangulation
2.4 Assumptions and Limitations
3 Executive Summary
3.1 Global Bamboo Market Size Outlook, $ Million, 2021 to 2030
3.2 Bamboo Market Outlook by Type, $ Million, 2021 to 2030
3.3 Bamboo Market Outlook by Product, $ Million, 2021 to 2030
3.4 Bamboo Market Outlook by Application, $ Million, 2021 to 2030
3.5 Bamboo Market Outlook by Key Countries, $ Million, 2021 to 2030
4 Market Dynamics
4.1 Key Driving Forces of Bamboo Industry
4.2 Key Market Trends in Bamboo Industry
4.3 Potential Opportunities in Bamboo Industry
4.4 Key Challenges in Bamboo Industry
5 Market Factor Analysis
5.1 Value Chain Analysis
5.2 Competitive Landscape
5.2.1 Global Bamboo Market Share by Company (%), 2023
5.2.2 Product Offerings by Company
5.3 Porter’s Five Forces Analysis
5.4 Pricing Analysis and Outlook
6 Growth Outlook Across Scenarios
6.1 Growth Analysis-Case Scenario Definitions
6.2 Low Growth Scenario Forecasts
6.3 Reference Growth Scenario Forecasts
6.4 High Growth Scenario Forecasts
7 Global Bamboo Market Outlook by Segments
7.1 Bamboo Market Outlook by Segments, $ Million, 2021- 2030
By Application
Raw Material
Industrial Products
Furniture
Shoots
Others
By Species
Moso Bamboo
Bambusa Vulgaris
Others
8 North America Bamboo Market Analysis and Outlook To 2030
8.1 Introduction to North America Bamboo Markets in 2024
8.2 North America Bamboo Market Size Outlook by Country, 2021-2030
8.2.1 United States
8.2.2 Canada
8.2.3 Mexico
8.3 North America Bamboo Market size Outlook by Segments, 2021-2030
By Application
Raw Material
Industrial Products
Furniture
Shoots
Others
By Species
Moso Bamboo
Bambusa Vulgaris
Others
9 Europe Bamboo Market Analysis and Outlook To 2030
9.1 Introduction to Europe Bamboo Markets in 2024
9.2 Europe Bamboo Market Size Outlook by Country, 2021-2030
9.2.1 Germany
9.2.2 France
9.2.3 Spain
9.2.4 United Kingdom
9.2.4 Italy
9.2.5 Russia
9.2.6 Norway
9.2.7 Rest of Europe
9.3 Europe Bamboo Market Size Outlook by Segments, 2021-2030
By Application
Raw Material
Industrial Products
Furniture
Shoots
Others
By Species
Moso Bamboo
Bambusa Vulgaris
Others
10 Asia Pacific Bamboo Market Analysis and Outlook To 2030
10.1 Introduction to Asia Pacific Bamboo Markets in 2024
10.2 Asia Pacific Bamboo Market Size Outlook by Country, 2021-2030
10.2.1 China
10.2.2 India
10.2.3 Japan
10.2.4 South Korea
10.2.5 Indonesia
10.2.6 Malaysia
10.2.7 Australia
10.2.8 Rest of Asia Pacific
10.3 Asia Pacific Bamboo Market size Outlook by Segments, 2021-2030
By Application
Raw Material
Industrial Products
Furniture
Shoots
Others
By Species
Moso Bamboo
Bambusa Vulgaris
Others
11 South America Bamboo Market Analysis and Outlook To 2030
11.1 Introduction to South America Bamboo Markets in 2024
11.2 South America Bamboo Market Size Outlook by Country, 2021-2030
11.2.1 Brazil
11.2.2 Argentina
11.2.3 Rest of South America
11.3 South America Bamboo Market size Outlook by Segments, 2021-2030
By Application
Raw Material
Industrial Products
Furniture
Shoots
Others
By Species
Moso Bamboo
Bambusa Vulgaris
Others
12 Middle East and Africa Bamboo Market Analysis and Outlook To 2030
12.1 Introduction to Middle East and Africa Bamboo Markets in 2024
12.2 Middle East and Africa Bamboo Market Size Outlook by Country, 2021-2030
12.2.1 Saudi Arabia
12.2.2 UAE
12.2.3 Oman
12.2.4 Rest of Middle East
12.2.5 Egypt
12.2.6 Nigeria
12.2.7 South Africa
12.2.8 Rest of Africa
12.3 Middle East and Africa Bamboo Market size Outlook by Segments, 2021-2030
By Application
Raw Material
Industrial Products
Furniture
Shoots
Others
By Species
Moso Bamboo
Bambusa Vulgaris
Others
13 Company Profiles
13.1 Company Snapshot
13.2 SWOT Profiles
13.3 Products and Services
13.4 Recent Developments
13.5 Financial Profile
Anji Tianzhen Bamboo Flooring Co. Ltd
Bamboo Australia Pty Ltd
Bamboo Village Company Ltd
Dasso Industrial Group Co. Ltd
Fujian Heqichang Bamboo Product Co. Ltd
MOSO International B.V.
Shanghai Tenbro Bamboo Textile Co. Ltd
Simply Bamboo Pty Ltd
Smith & Fong Co.
Xiamen HBD Industry & Trade Co. Ltd
14 Appendix
14.1 Customization Offerings
14.2 Subscription Services
14.3 Related Reports
14.4 Publisher Expertise
By Application
Raw Material
Industrial Products
Furniture
Shoots
Others
By Species
Moso Bamboo
Bambusa Vulgaris
Others
Countries Analyzed
North America (US, Canada, Mexico)
Europe (Germany, UK, France, Spain, Italy, Russia, Rest of Europe)
Asia Pacific (China, India, Japan, South Korea, Australia, South East Asia, Rest of Asia)
South America (Brazil, Argentina, Rest of South America)
Middle East and Africa (Saudi Arabia, UAE, Rest of Middle East, South Africa, Egypt, Rest of Africa)
