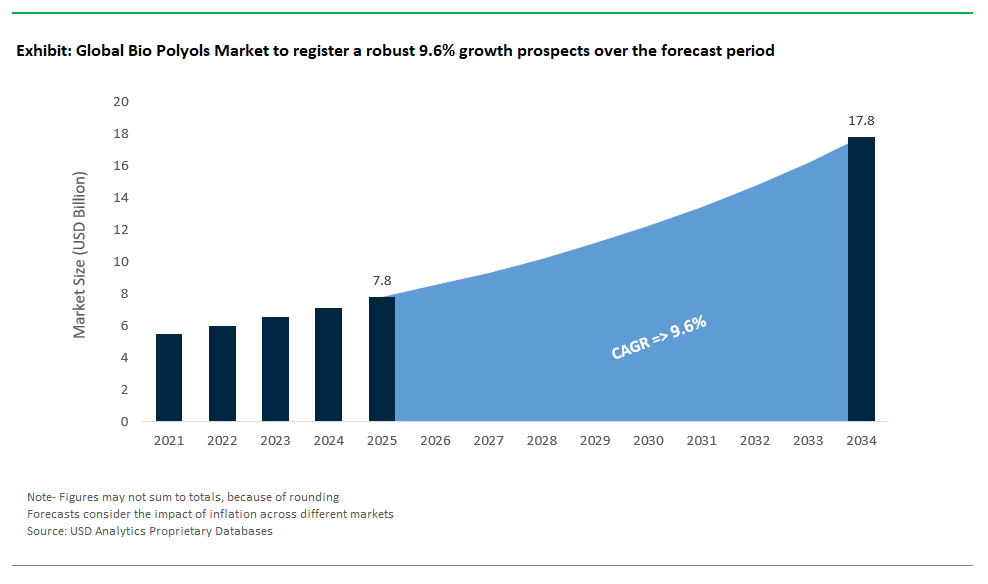
Exceptional Growth Outlook: Market Value and CAGR Position Bio Polyols Industry for Long-Term Leadership
The global Bio Polyols Industry is experiencing an accelerated expansion, with the market value projected to surge from $7.8 billion in 2025 to an impressive $17.8 billion by 2034, reflecting a robust CAGR of 9.6% over the forecast period. This remarkable growth trajectory is fueled by a fundamental shift within the global chemicals sector, as manufacturers, end-users, and policy-makers unite in the quest for sustainable and renewable alternatives to conventional petroleum-based polyols. With the rising implementation of bio-based raw materials and innovative circular economy solutions, the Bio Polyols Market is firmly on track to become a critical pillar of the sustainable materials revolution worldwide.
The rapid evolution of the Bio Polyols Industry is underpinned by the urgent need to address environmental challenges, reduce fossil dependency, and meet stringent regulatory requirements. Bio polyols originating from renewable feedstocks like vegetable oils, animal fats, glycerin, sugars, and even captured CO2 are transforming the production of polyurethanes (PUs) used in foams, coatings, adhesives, sealants, and elastomers across industries such as automotive, construction, furniture, and packaging. The portfolio of bio polyols now encompasses Natural Oil Polyols (NOPs), recycled/renewable content polyols, sugar-based polyols, glycerin-based polyols, and emerging CO2-based polyols, each providing targeted solutions for a greener value chain. With wide applications ranging from flexible and rigid foams for insulation to CASE (Coatings, Adhesives, Sealants, Elastomers) and automotive components, bio polyols are at the heart of the next generation of sustainable, high-performance materials.
Recent Innovations, Strategic Investments, and Global Developments Drive Bio Polyols Market Momentum
A wave of strategic investments, technological breakthroughs, and sustainability-driven initiatives is fundamentally reshaping the Bio Polyols Industry. In July 2025, AGC’s Group Company achieved ISCC PLUS certification in Southeast Asia, elevating sustainable sourcing and mass balance practices across the supply chain for chemicals and downstream bio polyols. That same month, Eni and the European Investment Bank (EIB) inked a €500 million finance deal to convert the Livorno Refinery into a biorefinery, illustrating a sector-wide pivot toward bio-based intermediates and enhancing feedstock security for bio polyol producers.
The market has also witnessed intensified R&D activity. In May 2025, leading manufacturers escalated the development of eco-friendly alternatives specifically for rigid polyurethane foam, supporting the green construction and insulation sector. This trend was complemented in April 2024 by Emery Oleochemicals’ opening of a new application lab in Thailand a move that directly supports innovation in green polymer additives and bio polyols for high-performance applications. At the start of 2025, Freudenberg Performance Materials’ brand, nora, introduced a carbon-negative rubber floor prototype, capturing more carbon than emitted a milestone that, while focused on rubber, exemplifies how bio-based polyols are enabling similar climate-positive materials in construction and flooring.
Pioneering research in January 2025 delivered a recyclable thin-film soft electronic material using water-based polyurethane dispersion, signaling new opportunities for bio-based polyols in smart packaging and electronic materials. The industry’s embrace of the circular economy was evident in December 2024 as Jaguar Land Rover, Adient, and Dow advanced closed-loop PU foam seats recycling end-of-life vehicle foam into new, sustainable materials. Policy incentives also play a pivotal role: in August 2024, the U.S. EPA recognized innovative companies for their pollution prevention achievements, catalyzing the uptake of green chemicals like bio polyols.
Corporate expansion and product launches further support industry dynamism. Emery Oleochemicals launched a new portfolio of ester base stocks and EV fluid building blocks in July 2024, targeting the transportation sector’s shift toward sustainable chemical components. Meanwhile, Covestro unveiled mass-balanced polyether polyols for insulation and cooling systems at Techtextil 2024 (June 2024), demonstrating their commitment to sustainable drop-in solutions derived from biowaste. The convergence of regulatory pressure, end-user demand, and ongoing technological innovation ensures the Bio Polyols Industry is positioned for sustained, value-driven growth.
Regulatory Mandates and EV Boom Shape the Future of Bio Polyols
Regulatory Trends Propel Widespread Adoption of Bio Polyols
Stringent environmental regulations and bold corporate sustainability mandates are accelerating the adoption of bio polyols worldwide. Governments in North America, Europe, and Asia-Pacific are rolling out tougher emissions standards and green procurement policies, compelling manufacturers to integrate bio-based materials to comply with laws such as the EU Green Deal and the U.S. EPA’s sustainable materials guidelines. Global demand for green and bio polyols is currently driven by regulatory and corporate requirements for eco-friendly alternatives in automotive, construction, and packaging. This is supported by the surge in ISCC PLUS certifications (such as AGC’s July 2025 milestone), enabling companies to make verifiable sustainability claims. The result is a dramatic uptick in R&D investment, supply chain collaboration, and product launches aimed at “drop-in” replacements that perform identically to their fossil-based counterparts but with a fraction of the environmental footprint. The growing emphasis on traceability, circular economy, and ESG reporting further solidifies bio polyols as a mainstay in the modern chemical industry.
EV Industry and Lightweighting Create Massive Opportunities for Bio Polyols
The global shift to electric vehicles (EVs) and the pursuit of lightweight, energy-efficient transportation solutions are unleashing new growth avenues for bio polyols. EV manufacturers are under pressure to reduce vehicle weight for optimal battery performance, making bio-polyol-based foams and elastomers highly attractive. 30% of current market demand for bio polyols originates in the automotive industry, with a 25% growth projection as automakers intensify the use of these materials in seating, dashboards, acoustic panels, and battery insulation. Premium automotive seating already uses bio-polyol foams in 15 to 30% of cases, delivering 5 to 7% weight reduction and improved comfort. High-profile collaborations such as the Jaguar Land Rover, Dow, and Adient partnership on closed-loop polyurethane foam and Emery Oleochemicals’ EV-focused product launches underscore the market’s proactive pivot toward sustainable automotive solutions. As interior air quality and VOC emissions standards tighten, bio polyols will continue to gain ground, establishing themselves as indispensable in the decarbonization of the transportation sector and beyond.
Leading Innovators Drive the Bio Polyols Industry Forward
The global competitive landscape for bio polyols is defined by the strategic moves of chemical titans and agile bio-based specialists.
BASF: Advancing Sustainable Polyols Production Across Asia-Pacific
BASF SE continues to reinforce its leadership in sustainable chemistry. In April 2023, BASF launched its first bio-based polyol, Sovermol, in Mangalore, India designed for New Energy Vehicles and wind turbines in the Asia-Pacific market. Sovermol is VOC-free and derived from sustainable feedstocks, demonstrating BASF’s commitment to environmental stewardship. The company’s relentless focus on R&D, expanding production capabilities, and participation in major industry events solidifies its influence in flexible/rigid foams, coatings, and adhesives, while helping customers achieve significant carbon reductions across applications.
Covestro: Mass-Balanced Polyether Polyols for Circular Economy Integration
Covestro AG, recognized for its commitment to the circular economy, is driving innovation with mass-balanced polyether polyols produced at its Dormagen facility (introduced September 2022). By using bio-circular raw materials and ISCC PLUS certified sites, Covestro offers “drop-in” solutions that integrate seamlessly into customers’ existing processes. The company aims for climate neutrality by 2035 for its Scope 1 and 2 emissions and by 2050 for Scope 3, providing customers with climate-smart products and verified sustainability credentials.
Cargill: Expanding Bio-Industrial Capabilities and Feedstock Supply
Cargill, Incorporated is an essential upstream supplier, providing vegetable oils and bio-based specialty chemicals. The acquisition of Croda’s performance technologies in December 2021 expanded Cargill’s reach in industrial chemicals, while the 2021 partnership with HELM to build a renewable BDO plant introduced QIRA, a bio-based BDO for plastics and coatings. Cargill’s strong agricultural roots and processing expertise position it as a cornerstone in the bio polyol value chain, delivering reliable, sustainable feedstocks for polyurethane manufacturers worldwide.
Dow: Pioneering Circular Polyurethanes and Recycled Content Polyols
The Dow Chemical Company leverages its global presence and expertise in polyurethane systems to champion the circular economy. In December 2024, Dow partnered with Jaguar Land Rover and Adient to launch a closed-loop system for PU foam seats, while its RENUVA program in France converts end-of-life mattresses into polyols. These advances reinforce Dow’s reputation for integrating recycling and renewable feedstocks into high-value polyurethane products, supporting customers’ waste reduction and carbon abatement strategies.
Emery Oleochemicals: Innovating with Ester Base Stocks and Green Polyols
Emery Oleochemicals, with its dual base in Malaysia and the U.S., is a vanguard in oleochemistry. The July 2024 launch of ester base stocks and EV fluid building blocks reflects its focus on high-performance solutions for the transportation sector. Emery’s investment in a new Thailand application lab (April 2024) accelerates R&D on green polyols and polymer additives. The company’s deep commitment to economic and environmental sustainability keeps it at the forefront of bio-based materials innovation.
Stepan Company: Expanding Sustainable Polyols for Insulation and Construction
Stepan Company is broadening its impact in the rigid foam segment, supplying polyols with renewable content tailored for insulation in construction and appliances. The company’s emphasis on performance and sustainability ensures it remains a trusted partner for customers seeking thermal efficiency and reduced environmental impact in building materials.
Bio Polyols Market Share Analysis: Key Segment Insights for 2025
By Type: Polyether Polyols Maintain Dominance While Polyester Gains Momentum
Polyether polyols represent the largest share of the bio polyols market, accounting for 65% in 2025, driven by their extensive use in flexible polyurethane foam for applications such as mattresses, furniture, and automotive seating. These polyols are preferred for their ease of processing, low viscosity, and superior compatibility with various isocyanates, making them highly cost-effective for mass production. The surge in demand from the automotive interior and furniture sectors, combined with global trends favoring eco-friendly and renewable materials, reinforces their market leadership.
Polyester polyols, though holding a smaller share, are witnessing steady growth owing to their application in rigid foams, coatings, adhesives, sealants, and elastomers (CASE). Known for excellent mechanical strength, high thermal stability, and chemical resistance, polyester polyols are increasingly being adopted in construction insulation and industrial coatings. Their compatibility with sustainability-focused formulations and ability to deliver low-VOC performance align perfectly with the circular economy objectives and regulatory frameworks set by governments globally.
By Application: Flexible Foam Leads, Rigid Foam Gains Strong Traction
Polyurethane flexible foam dominates the application landscape, capturing 40% of the market share in 2025, supported by growing demand in furniture, bedding, and automotive interiors. This segment benefits from increasing consumer awareness of comfort, ergonomics, and sustainability, with manufacturers introducing bio-based foam solutions to meet regulatory and environmental requirements. The global expansion of the automotive sector and e-commerce-driven furniture market adds further impetus to this growth trajectory.
Polyurethane rigid foam secures approximately 30% share, bolstered by its essential role in thermal insulation for buildings and refrigeration systems. With global green building codes and energy-efficiency regulations pushing construction companies toward sustainable solutions, bio-polyol-based rigid foams are gaining significant traction. The CASE segment (Coatings, Adhesives, Sealants, and Elastomers), holding around 20%, is also expanding rapidly, driven by eco-friendly formulations and stricter VOC emission norms, particularly in developed markets.
.png)
United States: Regulatory Mandates and Innovation Position the U.S. as a Global Leader
The United States plays a pivotal role in shaping the global bio polyols market, driven by strong government initiatives and extensive technological innovation. Programs such as the USDA BioPreferred Program have created a robust framework that promotes the purchase and usage of bio-based products across federal agencies and private enterprises. Additionally, the EPA’s Pollution Prevention (P2) Recognition Project (August 2024) highlights companies adopting green chemistry and sustainable manufacturing practices, encouraging the transition from fossil-based chemicals to renewable alternatives such as bio polyols. These policy interventions are significantly boosting adoption in key sectors, including automotive (interior components and seating), furniture and bedding, and construction (insulation materials). Furthermore, the rising demand for eco-friendly packaging and energy-efficient materials continues to reinforce the U.S. as a leading consumption hub.
Technological advancements and heavy R&D investments further distinguish the U.S. market. Companies such as Cargill are investing in renewable BDO (1,4-Butanediol) production through QIRA technology, creating a sustainable precursor for bio polyols and other biodegradable plastics. Similarly, Biosynthetic Technologies is pioneering high-performance bio-based esters, enhancing thermal stability and durability for premium polyurethane applications. These innovations align with evolving regulatory mandates for VOC reduction and corporate ESG commitments, driving demand for sustainable polyurethane solutions. In addition, U.S.-based manufacturers are strategically expanding their production capacity and supply chain networks to meet surging domestic and global demand, making the United States an innovation-driven hub for bio polyols.
Germany: Europe’s Innovation Hub for Bio Polyols and Circular Economy Solutions
Germany stands out as Europe’s leading market for bio polyols, fueled by its commitment to sustainable industrial practices and compliance with EU environmental regulations. The country operates under stringent EU Ecolabel standards and advanced eco-certifications, which actively promote the adoption of renewable and low-carbon materials. BASF SE and Covestro AG, two of the world’s largest chemical companies, are spearheading the development of mass-balanced bio-circular polyols that serve as direct drop-in replacements for petroleum-based polyols, enabling manufacturers to achieve sustainability goals without compromising performance. These advancements align with Germany’s broader strategy to decarbonize industries and transition toward a circular economy, reinforcing the nation’s leadership in bio-based chemical innovation.
Germany’s automotive sector, a cornerstone of its economy, is increasingly adopting bio-polyol-based polyurethane materials for lightweighting and interior components, aligning with EU CO₂ reduction mandates. Similarly, the construction industry is leveraging bio-based rigid foams for thermal insulation, supporting energy efficiency targets under the EU Green Deal. Extensive academic and industrial R&D collaborations are also accelerating innovations in green chemistry, feedstock diversification, and scalable production technologies. The willingness of German industries to invest in eco-friendly solutions for long-term regulatory compliance and corporate social responsibility solidifies Germany as a global benchmark for sustainable polyurethane development.
China: Infrastructure Growth and Green Policies Drive Bio Polyols Adoption
China is rapidly emerging as one of the most influential markets for bio polyols, driven by its booming construction sector, automotive manufacturing base, and government-led green initiatives. Policies such as the Green Building Action Plan mandate the use of environmentally friendly materials, boosting demand for bio-polyol-based rigid foams in insulation applications. Additionally, the government’s strong push for New Energy Vehicles (NEVs) has accelerated the integration of lightweight, sustainable polyurethane components, positioning bio polyols as a critical input material. These developments align with China’s overarching goals to reduce carbon emissions and support its dual-carbon strategy aimed at peak emissions by 2030 and neutrality by 2060.
China’s robust manufacturing ecosystem and access to low-cost feedstocks are enabling rapid scale-up of bio polyol production. Leading domestic players like Wanhua Chemical Group are heavily investing in R&D and production infrastructure, with an emphasis on bio-based and circular chemistry solutions. Strategic collaborations between local manufacturers and global chemical giants further enhance technology transfer and innovation in the country. With e-commerce growth, rising urbanization, and strong governmental policies favoring green manufacturing, China is positioned to dominate the Asia-Pacific bio polyols market, both as a manufacturing powerhouse and a key consumer market.
India: Infrastructure Boom and Policy Support Accelerate Market Growth
India is witnessing robust growth in the bio polyols market, fueled by its expanding construction sector and government-driven sustainability initiatives. Infrastructure programs such as the Smart Cities Mission and Housing for All are creating massive demand for energy-efficient insulation foams, a core application for bio-based polyurethane. Moreover, India’s burgeoning automotive and furniture markets are increasingly adopting bio-polyol-based solutions as consumer awareness of eco-friendly products gains traction. Regulatory initiatives promoting green manufacturing and renewable resources, coupled with rising environmental consciousness among end-users, further enhance the adoption curve.
Global chemical leaders are strengthening their presence in India to capitalize on its growth potential. For instance, BASF established its Sovermol bio-polyol production unit in April 2023, focusing on coatings, adhesives, sealants, and elastomers (CASE) applications tailored for regional demand. Local manufacturers are also investing in capacity expansions to cater to both domestic and export markets. With a strong policy push under “Make in India” and increasing investments in sustainable material technologies, India is poised to become a strategic hub for bio polyol production and downstream polyurethane applications.
Netherlands: A European Leader in Circular Economy and Bio-Based Innovation
The Netherlands has positioned itself as a strategic hub for bio-based chemicals and circular economy-driven manufacturing, offering a highly supportive regulatory and research ecosystem for bio polyols. Government-backed sustainability initiatives and public-private partnerships are driving innovation in renewable feedstocks and process optimization. Major companies like Shell and LyondellBasell are leading efforts to develop bio-circular propylene oxide a key precursor for bio polyols at their Maasvlakte facilities, ensuring a secure and sustainable raw material supply chain for European manufacturers.
Applications in insulation, specialty foams, and CASE products are expanding rapidly, supported by strict EU environmental regulations favoring renewable chemistry solutions. The Netherlands’ strong commitment to resource efficiency and greenhouse gas reduction ensures continued adoption of bio polyols across industrial sectors. By fostering technological breakthroughs and global collaborations, the Netherlands is not only serving domestic demand but also emerging as a critical export hub for sustainable chemical solutions in Europe.
Japan: High-Performance Bio Polyols Power Advanced Applications
Japan is at the forefront of innovation in high-performance bio polyols, driven by heavy R&D investments in biomass utilization and green chemistry. Industries such as automotive, construction, and electronics are integrating bio-based materials to meet the country’s Net Zero Energy Building roadmap and stringent sustainability goals. Government incentives for carbon-neutral technologies further accelerate the transition to renewable chemical feedstocks.
Japanese companies are focusing on enhancing oxidative stability, thermal performance, and low-temperature flexibility in bio polyols, enabling their application in demanding sectors such as aerospace, EV components, and industrial coatings. Cutting-edge developments in bio-based polyurethanes for electronics and specialty coatings position Japan as a leader in niche, high-value applications. This strong innovation ecosystem, combined with rigorous regulatory standards, ensures Japan’s continued dominance in the Asia-Pacific market for premium bio polyols.
South Korea: Sustainability Initiatives and Automotive Strength Fuel Market Growth
South Korea is gaining prominence in the global bio polyols market through its strategic focus on sustainable materials, green manufacturing, and advanced automotive technologies. Government programs supporting eco-friendly industrial practices and low-carbon manufacturing have incentivized companies to develop innovative bio-based polyol formulations for EV components, lightweighting solutions, and specialty coatings.
South Korean manufacturers are heavily investing in bio-additives and circular production models, aligning with the country’s carbon reduction targets. The growing use of bio polyols in electronics and construction sectors, along with the rapid adoption of CASE applications, positions South Korea as a critical market for bio-based polyurethane technologies. Its strong export capability and technological expertise ensure sustained growth in the coming decade.
Malaysia: Feedstock Availability and Oleochemical Expertise Drive Leadership
Malaysia’s bio polyols industry benefits from its abundant palm oil resources, making it a key global supplier of natural oil-based polyols. Companies like Emery Oleochemicals leverage the country’s oleochemical expertise to produce sustainable feedstocks for downstream applications in flexible foams, coatings, adhesives, and automotive parts. Government initiatives promoting MSPO-certified sustainable palm oil production and green manufacturing practices further enhance Malaysia’s competitive advantage in the bio polyols value chain.
As global demand for bio-based materials rises, Malaysia is expanding its production infrastructure and R&D capabilities to cater to both domestic and export markets. With growing emphasis on eco-certifications and sustainable sourcing, Malaysia is positioned as a critical hub for oleochemical-based polyol manufacturing, contributing to global efforts in decarbonizing the polyurethane industry.
Bio Polyols Market Report Scope
Bio Polyols Market
|
Parameter
|
Details
|
|
Market Size (2025)
|
$7.8 Billion
|
|
Market Size (2034)
|
$17.8 Billion
|
|
Market Growth Rate
|
9.6%
|
|
Segments
|
By Type (Polyether Polyols, Polyester Polyols)
By Raw Material, Natural Oils and their Derivatives (Soybean Oil, Castor Oil, Rapeseed Oil, Sunflower Oil, Palm Oil), Sucrose, Glycerin, Carbon Dioxide, Lignin, Others)
By Application (Polyurethane Flexible Foam, Polyurethane Rigid Foam, Coatings, Adhesives, Sealants, and Elastomers (CASE), Other Polyurethane Applications)
By End-Use Industry (Furniture & Bedding, Construction, Automotive, Packaging, Footwear, Electronics, Marine, Other Industrial Applications
|
|
Study Period
|
2019- 2024 and 2025-2034
|
|
Units
|
Revenue (USD)
|
|
Qualitative Analysis
|
Porter’s Five Forces, SWOT Profile, Market Share, Scenario Forecasts, Market Ecosystem, Company Ranking, Market Dynamics, Industry Benchmarking
|
|
Companies
|
BASF SE, The Dow Chemical Company, Covestro AG, Cargill, Incorporated, Emery Oleochemicals Group, Stepan Company, Wanhua Chemical Group Co., Ltd., Shell plc, Mitsui Chemicals, Inc., Huntsman International LLC, Tosoh Corporation, KPX Chemical Co., Ltd., Perstorp Group, Novomer Inc., Bio-based Technologies LLC
|
|
Countries
|
US, Canada, Mexico, Germany, France, Spain, Italy, UK, Russia, China, India, Japan, South Korea, Australia, South East Asia, Brazil, Argentina, Middle East, Africa
|
Bio Polyols Market Segmentation
By Type
- Polyether Polyols
- Polyester Polyols
By Raw Material
- Natural Oils and their Derivatives (Soybean Oil, Castor Oil, Rapeseed Oil, Sunflower Oil, Palm Oil)
- Sucrose
- Glycerin
- Carbon Dioxide
- Lignin
- Others
By Application
- Polyurethane Flexible Foam
- Polyurethane Rigid Foam
- Coatings, Adhesives, Sealants, and Elastomers (CASE)
- Other Polyurethane Applications
By End-Use Industry
- Furniture & Bedding
- Construction
- Automotive
- Packaging
- Footwear
- Electronics
- Marine
- Other Industrial Applications
Countries Analyzed
- North America (US, Canada, Mexico)
- Europe (Germany, UK, France, Spain, Italy, Russia, Rest of Europe)
- Asia Pacific (China, India, Japan, South Korea, Australia, South East Asia, Rest of Asia)
- South America (Brazil, Argentina, Rest of South America)
- Middle East and Africa (Saudi Arabia, UAE, Rest of Middle East, South Africa, Egypt, Rest of Africa)
Top Companies in Bio Polyols Market
- BASF SE
- The Dow Chemical Company
- Covestro AG
- Cargill, Incorporated
- Emery Oleochemicals Group
- Stepan Company
- Wanhua Chemical Group Co., Ltd.
- Shell plc
- Mitsui Chemicals, Inc.
- Huntsman International LLC
- Tosoh Corporation
- KPX Chemical Co., Ltd.
- Perstorp Group
- Novomer Inc.
- Bio-based Technologies LLC
* List Not Exhaustive
Research Coverage
This report by USDAnalytics investigates the global bio polyols market, delivering a comprehensive review of market dynamics, breakthroughs in sustainable chemistry, and key competitive strategies. It provides historical data from 2021 to 2024 and reliable forecasts for 2025–2034, highlighting growth opportunities across types, raw materials, applications, and end-use industries. The analysis reviews technological advancements, regulatory frameworks, and innovation pipelines, ensuring that stakeholders gain actionable insights to align with circular economy trends and low-carbon manufacturing goals.
This report is an essential resource for industry leaders, providing in-depth analysis, trend evaluations, and competitive benchmarking to support strategic decision-making in a rapidly evolving market landscape.
Segmentation Covered:
By Type: Polyether Polyols, Polyester Polyols
By Application: Flexible Foam, Rigid Foam, CASE (Coatings, Adhesives, Sealants, Elastomers), Others
By End-Use: Furniture & Bedding, Automotive, Construction, Packaging, Footwear, Electronics, Marine
By Raw Material: Natural Oils & Derivatives, Glycerin, Carbon Dioxide, Lignin, Others
Geographical Scope:
North America, Europe, Asia-Pacific, South America, Middle East & Africa
Data Coverage:
Historic Data (2021–2024) | Forecast Data (2025–2034)
Key Companies Profiled:
BASF SE, Dow Chemical, Covestro AG, Cargill, Emery Oleochemicals, Stepan Company, Wanhua Chemical, Shell, Huntsman, Mitsui Chemicals, and others
Deliverables
- Comprehensive Market Research Report (PDF and Excel) with detailed tables, charts, and interactive visualizations
- Country-Specific Forecasts & Analysis
- Segment-Wise Revenue Forecasts (2025–2034)
- Competitive Analysis, Benchmarking, and SWOT Profiles
- Recent Developments & Innovation Tracker
- Executive Summary & Analyst Commentary
- Post-Purchase Analyst Support for Client-Specific Questions and Custom Data Requirements
