
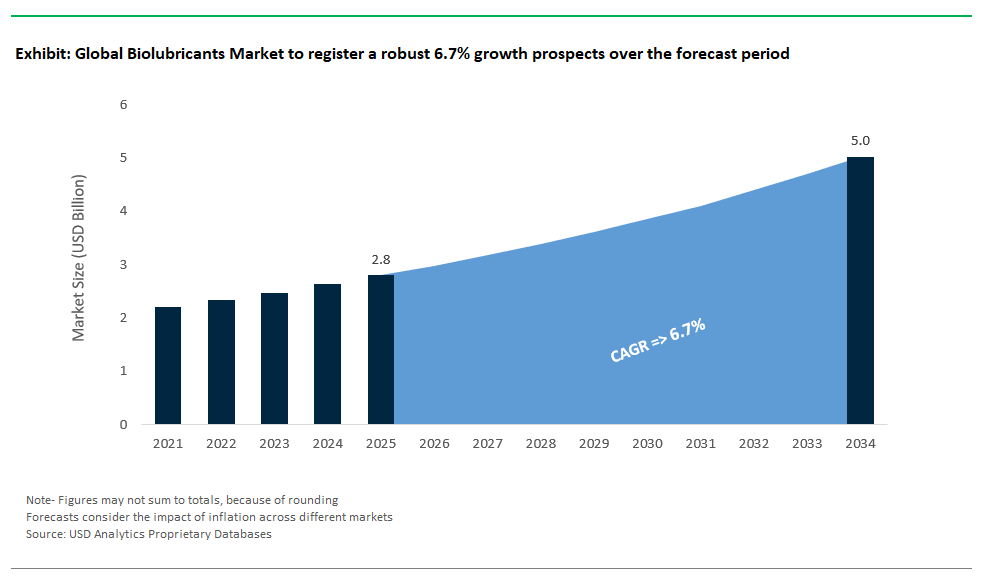
The global Biolubricants Market is charting a remarkable path, poised to expand from $2.8 billion in 2025 to $5.1 billion by 2034, reflecting a strong CAGR of 6.7%. This surge is driven by the convergence of environmental mandates, tightening regulations, and industry-wide efforts to lower the carbon footprint of manufacturing and transportation. As industries worldwide seek sustainable solutions, biolubricants derived from renewable sources like vegetable oils, animal fats, and synthetic esters are increasingly recognized as high-performance, low-toxicity alternatives to conventional petroleum-based lubricants. Their inherent biodegradability and environmental safety make them the preferred choice for applications in sensitive ecosystems, including marine, forestry, agriculture, and urban infrastructure, as well as in advanced sectors such as automotive, industrial machinery, and food processing.
Biolubricants are engineered to deliver not just ecological benefits but also technical excellence. With advances in formulation, these lubricants now rival or exceed traditional mineral oils in attributes like lubricity, viscosity stability, and oxidative resistance. Their key base stocks rapeseed, soybean, sunflower oils, animal fats, and bio-based synthetic esters provide versatility and adaptability for use in hydraulic fluids, gear oils, metalworking fluids, engine oils, and greases. The ongoing transition to eco-friendly lubricants is underpinned by regulatory frameworks like the U.S. EPA Vessel General Permit (VGP) and EU Ecolabel, which increasingly mandate or incentivize the use of biodegradable lubricants. Major industrial users, OEMs, and fleet operators are embracing biolubricants not only to meet compliance but also to demonstrate a broader commitment to corporate sustainability and operational efficiency.
The Biolubricants market is witnessing a period of robust innovation, high-profile partnerships, and expanded production capacity, reflecting a deepening industry commitment to sustainability. In July 2025, AMES joined the HP Metal Jet Production Service network, aligning sustainable lubrication with advanced additive manufacturing and signaling broader cross-industry integration of eco-friendly practices. The same month, Sirius Space Services announced plans to adopt eco-friendly lubricants within its new precision machining operations, underlining aerospace’s shift towards greener manufacturing.
MX3D secured €7 million in May 2025 to scale up its robotic metal 3D printing, with a focus on using high-performance, environmentally friendly lubricants for advanced machinery. Also in May, Emery Oleochemicals launched its DEHYLUB® line of advanced electric vehicle (EV) fluids, directly targeting the surging demand for bio-based lubricants capable of addressing unique EV requirements, such as thermal stability and electrical compatibility. FUCHS SE continued to promote its Planto line of biodegradable lubricants in April, reinforcing its leadership in responding to tightening environmental standards and customer sustainability demands.
Strategic M&A and upstream investments are also reshaping the market landscape. In November 2024, Shell finalized its acquisition of the PANOLIN Group’s Environmentally Considerate Lubricants (ECLs) business, cementing its position in the global market for biodegradable lubricants, particularly for marine and industrial applications. Upstream, Cargill continues to invest in sustainable oilseed processing (October 2024), while Croda International expanded its bio-based ester capacity in September to meet soaring demand from lubricant formulators. Biosynthetic Technologies and TotalEnergies have both introduced new bio-based esters and greases, underscoring the sector’s rapid pace of product and technology development to match evolving industrial and automotive needs.
A defining trend in the biolubricants industry is the global tightening of environmental standards, pushing industries to adopt biodegradable and non-toxic lubricants as the new baseline. Regulatory mandates such as the U.S. EPA’s Vessel General Permit (VGP) and various EU Ecolabel schemes are compelling widespread replacement of mineral oil-based fluids with biolubricants in marine, construction, forestry, and agriculture sectors. These measures address pressing concerns about water and soil contamination, persistence of petroleum lubricants, and ecosystem toxicity. Major manufacturers like FUCHS SE have ramped up the development and promotion of biodegradable product lines (e.g., Planto), aligning portfolios with customer demand and regulatory direction. Government-backed programs such as USDA’s BioPreferred in the U.S. and UEIL’s sustainability task force in Europe are accelerating awareness and procurement, driving investment into new feedstock diversification and bio-based R&D. The net impact: biolubricants are now seen not just as specialty niche products but as mainstream choices for meeting environmental goals, reducing operational risk, and supporting corporate ESG mandates.
The rapid expansion of the electric vehicle (EV) industry is opening a substantial new opportunity for specialized bio-based lubricants. Unlike conventional internal combustion engines, EVs require lubricants with specific dielectric properties, advanced thermal management, and compatibility with modern composite and electronic materials. Bio-based esters and chemically engineered lubricants, such as those found in Emery Oleochemicals’ DEHYLUB® line (launched May 2025), are emerging as the solutions of choice for EV transmission fluids, bearing greases, and thermal management systems. EV manufacturers are partnering with lubricant innovators to develop products that minimize friction, enhance heat dissipation, and provide long-term component protection under high torque and variable load conditions. This trend is supported by growing consumer and regulatory pressure to decarbonize the entire EV supply chain, further incentivizing adoption of sustainable lubricants. The result is a fast-growing market segment where bio-based formulations are setting new performance and sustainability benchmarks, paving the way for biolubricants to become standard in future mobility ecosystems.
The global Biolubricants market is defined by a dynamic blend of major oil companies, specialty chemical firms, and bio-based lubricant pioneers all vying for leadership in sustainable lubrication.
FUCHS SE (Germany) stands as the world’s largest independent lubricant specialist, leveraging deep R&D capabilities to deliver the Planto series of high-performance biolubricants. From hydraulic oils to gear oils and metalworking fluids, FUCHS offers bio-based and synthetic ester products that satisfy the toughest environmental standards, with continuous investment in eco-efficiency and global expansion.
Shell plc (Netherlands) is scaling its presence in the sustainable lubricants sector, most notably with the acquisition of PANOLIN’s Environmentally Considerate Lubricants (ECLs) business in late 2024. This move significantly expands Shell’s portfolio for marine, industrial, and utility applications, aligning with its broader energy transition strategy and bolstered by industry-leading R&D capabilities.
Cargill, Incorporated (United States) remains a critical supplier of renewable feedstocks rapeseed, soybean, sunflower oils and bio-based additives. Investments in advanced oilseed processing enhance the sustainability and performance of its offerings, supporting lubricant formulators worldwide in developing next-generation bio-based products.
Emery Oleochemicals Group (Malaysia/US) is at the forefront of bio-based lubricant technology, delivering advanced products for automotive, industrial, and EV markets through its DEHYLUB® and EDENOL® brands. The company’s recent launch of specialized EV fluids underscores its innovation focus and ability to anticipate market trends.
PANOLIN AG (Switzerland) continues to set standards in premium EALs and biodegradable lubricants for marine, hydro, and heavy-duty industrial uses. Even after acquisition by Shell, PANOLIN’s brand and technical expertise remain vital to advancing high-performance, environmentally safe lubrication for the most sensitive and regulated markets.
Vegetable oils dominate the global biolubricants market, capturing an estimated 45% share in 2025, owing to their inherent sustainability, biodegradability, and alignment with stringent environmental regulations such as the EU Ecolabel and USDA BioPreferred Program. Common feedstocks such as rapeseed, soybean, and palm oil have become critical raw materials for manufacturing lubricants used in forestry, agriculture, and marine applications. These oils are particularly valued for their cost-effectiveness and environmental safety, which resonate with corporate sustainability objectives across major industries. Additionally, rapid advancements in additive chemistry are improving the oxidative stability and low-temperature performance of vegetable oil-based lubricants, making them competitive even in industrial-grade applications.
Synthetic esters (bio-based) hold around 30% of the market share and are rapidly expanding in high-performance sectors such as wind energy, aerospace, and marine operations, where thermal stability and durability are critical. Despite higher production costs, synthetic esters are gaining traction due to their ability to meet the operational demands of gearboxes, compressors, and hydraulic systems in extreme environments. Other base oils, such as animal fats and emerging options like algae-based and polyalkylene glycols, currently occupy a smaller segment but remain strategically important for future market diversification. Continuous investment in R&D for next-generation bio-based oils positions these alternatives for long-term adoption as industries transition toward circular economy principles and reduced carbon emissions.
.png)
Hydraulic oils lead the biolubricants market with a significant 25% share in 2025, primarily driven by widespread use in agriculture, forestry, and heavy construction machinery operating in environmentally sensitive areas. Regulatory mandates such as EPA Vessel General Permit (VGP) and eco-label certifications have further accelerated the transition to biodegradable hydraulic fluids. Manufacturers are developing advanced formulations that provide anti-wear, anti-corrosion, and high-viscosity index characteristics, ensuring superior performance in high-pressure hydraulic systems. These innovations are making biolubricants an indispensable component for industries aiming to comply with sustainability standards without compromising on equipment reliability and lifespan.
Automotive lubricants account for approximately 20% of the application share, benefiting from the surging electric vehicle (EV) and hybrid vehicle market. Bio-based engine oils, transmission fluids, and specialty greases are witnessing strong demand as automotive OEMs adopt green chemistry principles to meet carbon neutrality targets. Beyond these leading categories, metalworking fluids are growing steadily due to strict EPA and REACH regulations that restrict conventional mineral oils. Similarly, gear oils and greases are registering increased adoption in renewable energy sectors, particularly for wind turbines and marine propulsion systems. Niche applications such as chainsaw oils and transformer oils are gaining attention in specialized sectors, highlighting the versatility and future growth potential of biolubricants across diverse industrial applications.
The United States stands as a dominant player in the biolubricants market, underpinned by strong regulatory support and a surge in sustainability-driven industrial practices. Federal programs such as the USDA BioPreferred Program mandate the use of bio-based products, including lubricants, across government procurement channels, driving baseline demand. Additionally, the EPA Vessel General Permit (VGP) regulation has significantly boosted the uptake of Environmentally Acceptable Lubricants (EALs) in marine applications, reinforcing the market's regulatory backbone. Industries such as forestry, agriculture, and marine transport are leading adopters of biodegradable lubricants due to their proximity to environmentally sensitive zones. The increasing emphasis on sustainability by corporate ESG strategies has further accelerated biolubricant integration in industrial machinery and off-highway equipment.
Technological innovation is another defining factor in the U.S. market. Companies like Biosynthetic Technologies LLC are spearheading advancements in high-performance synthetic esters designed for demanding applications in the automotive and aerospace industries. The growing penetration of electric vehicles presents a transformative opportunity, as EVs require specialized lubricants with thermal management properties. Strategic investments in R&D and manufacturing capacity expansion by global leaders and regional players ensure that the U.S. biolubricants market remains at the forefront of innovation, sustainability, and high-performance lubrication solutions through 2034.
Germany has emerged as Europe’s hub for biolubricant innovation, bolstered by stringent environmental regulations and EU Ecolabel compliance. As the home base of leading manufacturers such as FUCHS SE, Germany is pioneering advancements in additive technology, oxidative stability enhancement, and bio-based feedstock optimization. The country's industrial ecosystem comprising automotive, heavy machinery, and renewable energy sectors has aggressively embraced biolubricants to align with corporate sustainability mandates and regulatory frameworks. The increasing shift toward eco-friendly lubricants in wind turbines and industrial gear systems reflects Germany’s commitment to reducing environmental impact while maintaining operational efficiency.
The German market also benefits from robust research collaboration between academia and industry, driving breakthroughs in low-temperature performance and thermal stability for bio-based formulations. National incentives for green technologies coupled with a high level of consumer and corporate awareness have established Germany as a benchmark for sustainable lubrication practices. Looking ahead, continued investment in premium bio-based lubricants for high-demand sectors will ensure Germany retains its competitive edge in both domestic and international markets.
France is rapidly positioning itself as a key player in Europe’s biolubricants landscape, leveraging strong policy alignment with EU environmental mandates and rising industrial investment in sustainable technologies. Companies like TotalEnergies SE have expanded their portfolio of bio-based lubricants, while sectors such as automotive, aerospace, and agriculture are spearheading adoption initiatives. The commitment of Sirius Space in July 2025 to implement eco-friendly lubricants in its manufacturing facility exemplifies the growing industrial trend toward environmentally responsible operations. Regulatory incentives and funding programs further bolster demand by encouraging businesses to transition from conventional lubricants to sustainable alternatives.
Technological innovation remains central to France’s strategy, with research focused on developing bio-based additives and advanced chemical structures that enhance oxidative resistance and performance consistency. The confluence of policy support, corporate ESG objectives, and consumer preference for sustainable solutions ensures a favorable outlook for biolubricants in France. As industries aim to achieve net-zero emission targets, biolubricants will serve as a critical enabler of the country's green manufacturing ecosystem.
The Netherlands plays a strategic role in the European biolubricants market, primarily due to its robust maritime economy and strict environmental regulations. As a leading hub for global shipping and port operations, the adoption of Environmentally Acceptable Lubricants (EALs) in marine propulsion systems has accelerated significantly. This trend was reinforced by Shell’s acquisition of PANOLIN’s ECL business in November 2024, signaling a long-term commitment to sustainable maritime operations. Strong government initiatives promoting a circular economy and low-carbon manufacturing have positioned the Netherlands as a global leader in sustainable lubrication solutions.
Beyond the marine sector, Dutch industries are increasingly incorporating biolubricants into industrial machinery and transportation equipment to comply with environmental mandates. Collaborative R&D programs between government agencies and industry leaders have fostered innovation in bio-based chemistries that improve oxidative stability and extend lubricant life cycles. These strategic efforts ensure that the Netherlands remains a key growth market for premium-grade, eco-certified lubricants through the forecast period.
|
Parameter |
Details |
|
Market Size (2025) |
$2.8 Billion |
|
Market Size (2034) |
$5.1 Billion |
|
Market Growth Rate |
6.7% |
|
Segments |
By Base Oil Type, Vegetable Oils, Animal Fats, Synthetic Esters (Bio-based), Others) |
|
Study Period |
2019- 2024 and 2025-2034 |
|
Units |
Revenue (USD) |
|
Qualitative Analysis |
Porter’s Five Forces, SWOT Profile, Market Share, Scenario Forecasts, Market Ecosystem, Company Ranking, Market Dynamics, Industry Benchmarking |
|
Companies |
FUCHS SE, Shell plc, Cargill, Incorporated, Emery Oleochemicals Group, PANOLIN AG, TotalEnergies SE, ExxonMobil Corporation, BP p.l.c., Chevron Corporation, Croda International plc, Biosynthetic Technologies LLC, Klüber Lubrication München SE & Co. KG, Renewable Lubricants Inc., Novvi LLC, Axel Christiernsson International AB |
|
Countries |
US, Canada, Mexico, Germany, France, Spain, Italy, UK, Russia, China, India, Japan, South Korea, Australia, South East Asia, Brazil, Argentina, Middle East, Africa |
* List Not Exhaustive
Table of Contents: Biolubricants Market
1. Executive Summary
2. Biolubricants Market Landscape & Outlook (2025–2034)
3. Market Analysis: Recent Innovations and Strategic Industry Moves in Biolubricants
4. Trends and Opportunities Redefining the Biolubricants Market
5. Competitive Landscape: Key Players Accelerate Innovation in the Biolubricants Market
6. Biolubricants Market Share Analysis: Key Segment Insights for 2025
7. Country Analysis and Outlook of Biolubricants Market
8. Biolubricants Market Size Outlook by Region (2025-2034)
9. Company Profiles: Leading Players in the Biolubricants Market
10. Methodology
11. Appendix
The global Biolubricants Market is expected to grow from $2.8 billion in 2025 to $5.1 billion by 2034, representing a strong CAGR of 6.7%. This growth is fueled by tightening environmental regulations, corporate sustainability initiatives, and the increasing adoption of renewable, biodegradable lubricants across industries.
Stringent environmental standards, such as the U.S. EPA Vessel General Permit and EU Ecolabel, are key drivers for the adoption of biolubricants. The push for lower carbon footprints, ecosystem protection, and regulatory mandates in sectors like marine, forestry, agriculture, and automotive are accelerating the shift from conventional petroleum-based lubricants to bio-based, non-toxic alternatives.
By base oil, vegetable oils lead with a 45% share in 2025, favored for sustainability and compliance with eco-labels. Synthetic esters are gaining momentum, holding around 30% market share due to their performance in demanding environments. Application-wise, hydraulic oils dominate (25% share), with automotive lubricants and specialized EV fluids showing strong growth thanks to the rapid expansion of electric and hybrid vehicles.
Major players include FUCHS SE (Planto Series), Shell (following its acquisition of PANOLIN ECL), Cargill (renewable feedstocks), Emery Oleochemicals (DEHYLUB® and EDENOL® lines), and PANOLIN AG. These firms are leading innovation through investments in biodegradable, high-performance lubricants tailored to evolving industrial, automotive, and maritime needs.
The United States is a dominant market, driven by regulatory mandates and the expanding EV sector, while Germany leads in European innovation and industrial adoption. France and the Netherlands are accelerating market penetration with policy support and strong investment, particularly in automotive and maritime applications. Across all regions, the transition toward sustainability and compliance with eco-labels continues to shape the future of the biolubricants industry.