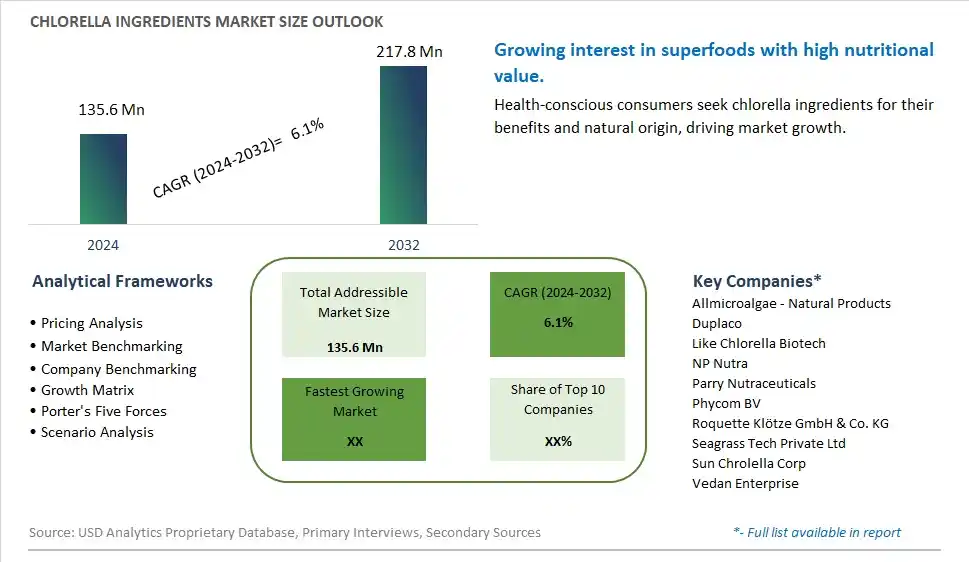
Global Chlorella Ingredients Market Size is valued at $135.6 Million in 2024 and is forecast to register a growth rate (CAGR) of 6.1% to reach $217.8 Million by 2032.
The global Chlorella Ingredients Market Comprehensive Study analyzes and forecasts the market size across 6 regions and 24 countries for diverse segments -By End-User (Food and Beverages, Health and Medical, Animal Feed, Cosmetics and Personal Care, Fertilizers Sector), By Source (Marine water, Fresh Water)
An Introduction to Chlorella Ingredients Market
In 2024, the chlorella ingredients market is thriving, driven by the demand for nutrient-dense superfoods that support overall health and wellness. Chlorella, a type of green algae, is rich in proteins, vitamins, minerals, and chlorophyll, making it a popular ingredient in dietary supplements, smoothies, and functional foods. The market benefits from advancements in chlorella cultivation and processing technologies that enhance product purity and bioavailability. The trend towards clean label and natural ingredients is influencing product development. Increasing consumer interest in plant-based nutrition and the popularity of detoxifying and immune-boosting supplements are further propelling market growth.
Chlorella Ingredients Competitive Landscape
The market report analyses the leading companies in the industry including Allmicroalgae - Natural Products, Duplaco, Like Chlorella Biotech, NP Nutra, Parry Nutraceuticals, Phycom BV, Roquette Klötze GmbH & Co. KG, Seagrass Tech Private Ltd, Sun Chrolella Corp, Vedan Enterprise, and Others.
Chlorella Ingredients Market Dynamics
Chlorella Ingredients Market Trend: Increasing Use in Dietary Supplements and Superfoods
The most prominent trend in the Chlorella Ingredients Market is the increasing use in dietary supplements and superfoods. Chlorella, known for its high nutrient content and detoxifying properties, is becoming a sought-after ingredient in health products. This trend is driven by the demand for natural and nutrient-dense ingredients that support overall health and wellness.
Chlorella Ingredients Market Driver: Health Consciousness and Nutritional Benefits
A key driver in the Chlorella Ingredients Market is health consciousness and the recognized nutritional benefits of chlorella. As more individuals focus on improving their diet and incorporating superfoods, there is a rising demand for chlorella ingredients that offer essential vitamins, minerals, and antioxidants. This demand supports market growth as consumers seek health-enhancing supplements.
Chlorella Ingredients Market Opportunity: Expansion into Functional Foods and Beverages
One significant opportunity in the Chlorella Ingredients Market lies in the expansion into functional foods and beverages. Companies can innovate by incorporating chlorella into a variety of products, such as smoothies, energy bars, and dietary supplements, offering consumers convenient and effective ways to enhance their intake of this superfood. By highlighting the health benefits and versatility of chlorella, manufacturers can attract a broader consumer base and drive market growth.
Chlorella Ingredients Market Share Analysis- Largest Segment by End-User
In the Chlorella Ingredients Market, the Food and Beverages end-user segment is the largest. This segment's dominance is driven by the growing consumer demand for functional foods and beverages enriched with natural ingredients known for their health benefits. Chlorella, a type of green algae, is valued for its high protein content, vitamins, and minerals, making it a popular ingredient in health-conscious food and beverage products. Its use in smoothies, energy bars, and dietary supplements highlights its significant role in this market. The increasing consumer awareness about the nutritional benefits of chlorella, combined with the trend towards clean-label and natural ingredients, supports the food and beverages segment's leading position.
Chlorella Ingredients Market Share Analysis- Poised to Grow Fastest Over the Next Five Years by Source
The Fresh Water source segment in the Chlorella Ingredients Market is poised to grow the fastest over the next five years. This growth is driven by advancements in freshwater cultivation techniques, which are making the production of high-quality chlorella more efficient and sustainable. Freshwater chlorella is favored for its purity and the ability to be cultivated in controlled environments, which ensures a consistent quality product. As the demand for chlorella ingredients increases in health and wellness applications, including dietary supplements and functional foods, the efficiency and sustainability of freshwater production methods are expected to drive rapid growth in this segment. Additionally, the rising consumer preference for environmentally friendly and sustainable sourcing further supports the growth of freshwater chlorella.
Chlorella Ingredients Market Segmentation
By End-User
Food and Beverages
Health and Medical
Animal Feed
Cosmetics and Personal Care
Fertilizers Sector
By Source
Marine water
Fresh Water
Countries Analyzed
North America (US, Canada, Mexico)
Europe (Germany, UK, France, Spain, Italy, Russia, Rest of Europe)
Asia Pacific (China, India, Japan, South Korea, Australia, South East Asia, Rest of Asia)
South America (Brazil, Argentina, Rest of South America)
Middle East and Africa (Saudi Arabia, UAE, Rest of Middle East, South Africa, Egypt, Rest of Africa)
Chlorella Ingredients Companies Profiled in the Study
Allmicroalgae - Natural Products
Duplaco
Like Chlorella Biotech
NP Nutra
Parry Nutraceuticals
Phycom BV
Roquette Klötze GmbH & Co. KG
Seagrass Tech Private Ltd
Sun Chrolella Corp
Vedan Enterprise
*- List Not Exhaustive
Chapter 1. TABLE OF CONTENTS
Chapter 2. Introduction to Chlorella Ingredients Market
2.1. Market Overview
2.2. Key Statistics and Report Highlights
2.3. Scope of the Comprehensive Study
2.3.1. Market Definition
2.3.2 Countries and Regions Covered
2.3.3 Research Objective
2.3.4 Units, Currency, and Conversions
2.3.5 Industry Value Chain
2.4. Key Market Segments
2.5. Key Companies
2.6. Study Period
Chapter 3. Strategic Analysis Review
3.1. Chlorella Ingredients Pricing Analysis and Forecast
3.2. Porter’s Five Forces
3.3. Market Ecosystem
3.4. SWOT Analysis
3.5. Regulatory Scenario
3.3. Effects of Inflation, Russia-Ukraine War, moderating economic growth, and other macroeconomic factors
Chapter 4. Competitive Landscape
4.1. Market Share Analysis
4.1.1. Global Chlorella Ingredients Market Share by Company, 2023
4.1.2. Product Offerings of Leading Chlorella Ingredients Companies
4.2. Market Entropy
4.2.1. New Product Launches in the Industry
4.2.2. Mergers, Acquisitions, Joint ventures, and Partnerships
4.3. Key Strategies and Best Practices
Chapter 5. Global Market Projections: Best, Reference, and Low Case Scenarios
5.1. Growth Analysis- Case Scenario Definitions
5.2. Low Growth Case Scenario Forecasts
5.3. Reference Growth Case Scenario Forecasts
5.4. High Growth Case Scenario Forecasts
Chapter 6. Market Dynamics
6.1. Chlorella Ingredients Market Drivers
6.2. Chlorella Ingredients Market Challenges
6.6. Chlorella Ingredients Market Opportunities
6.4. Chlorella Ingredients Market Trends
Chapter 7. Global Chlorella Ingredients Market Outlook Trends
7.1. Global Chlorella Ingredients Revenue (USD Million) and CAGR (%) by Type (2021-2032)
7.2. Global Chlorella Ingredients Revenue (USD Million) and CAGR (%) by Application (2021-2032)
7.3. Global Chlorella Ingredients Revenue (USD Million) and CAGR (%) by Product (2021-2032)
By End-User
Food and Beverages
Health and Medical
Animal Feed
Cosmetics and Personal Care
Fertilizers Sector
By Source
Marine water
Fresh Water
Chapter 8. Global Chlorella Ingredients Regional Analysis and Outlook
8.1. Global Chlorella Ingredients Revenue (USD Million) By Regions (2021- 2032)
8.2. North America Chlorella Ingredients Revenue (USD Million) by Country (2021-2032)
8.2.1. United States Chlorella Ingredients Regional Analysis and Outlook
8.2.2. Canada Chlorella Ingredients Regional Analysis and Outlook
8.2.3. Mexico Chlorella Ingredients Regional Analysis and Outlook
8.3. Europe Chlorella Ingredients Revenue (USD Million), by Country (2021-2032)
8.3.1. Germany Chlorella Ingredients Regional Analysis and Outlook
8.3.2. France Chlorella Ingredients Regional Analysis and Outlook
8.3.3. United Kingdom Chlorella Ingredients Regional Analysis and Outlook
8.3.4. Spain Chlorella Ingredients Regional Analysis and Outlook
8.3.5. Italy Chlorella Ingredients Regional Analysis and Outlook
8.3.6. Russia Chlorella Ingredients Regional Analysis and Outlook
8.3.7. Rest of Europe Chlorella Ingredients Regional Analysis and Outlook
8.4. Asia Pacific Chlorella Ingredients Revenue (USD Million) by Country (2021-2032)
8.4.1. China Chlorella Ingredients Regional Analysis and Outlook
8.4.2. Japan Chlorella Ingredients Regional Analysis and Outlook
8.4.3. India Chlorella Ingredients Regional Analysis and Outlook
8.4.4. South Korea Chlorella Ingredients Regional Analysis and Outlook
8.4.5. Australia Chlorella Ingredients Regional Analysis and Outlook
8.4.6. South East Asia Chlorella Ingredients Regional Analysis and Outlook
8.4.7. Rest of Asia Pacific Chlorella Ingredients Regional Analysis and Outlook
8.5. South America Chlorella Ingredients Revenue (USD Million), by Country (2021-2032)
8.5.1. Brazil Chlorella Ingredients Regional Analysis and Outlook
8.5.2. Argentina Chlorella Ingredients Regional Analysis and Outlook
8.5.3. Rest of South America Chlorella Ingredients Regional Analysis and Outlook
8.6. Middle East and Africa Chlorella Ingredients Revenue (USD Million) by Country (2021-2032)
8.6.1. Middle East Chlorella Ingredients Regional Analysis and Outlook
8.6.2. Africa Chlorella Ingredients Regional Analysis and Outlook
Chapter 9. North America Chlorella Ingredients Analysis and Outlook
9.1. North America Chlorella Ingredients Revenue (USD Million) by Segments (2021-2032)
9.1.1. North America Chlorella Ingredients Revenue (USD Million) by Type (2021-2032)
9.1.2. North America Chlorella Ingredients Revenue (USD Million) by Application (2021-2032)
9.1.3. North America Chlorella Ingredients Revenue (USD Million) by Product (2021-2032)
By End-User
Food and Beverages
Health and Medical
Animal Feed
Cosmetics and Personal Care
Fertilizers Sector
By Source
Marine water
Fresh Water
Chapter 10. Europe Chlorella Ingredients Analysis and Outlook
10.1. Europe Chlorella Ingredients Revenue (USD Million), by Segments (USD Million) (2021-2032)
10.1.1. Europe Chlorella Ingredients Revenue (USD Million) by Type (2021-2032)
10.1.2. Europe Chlorella Ingredients Revenue (USD Million) by Application (2021-2032)
10.1.3. Europe Chlorella Ingredients Revenue (USD Million) by Product (2021-2032)
By End-User
Food and Beverages
Health and Medical
Animal Feed
Cosmetics and Personal Care
Fertilizers Sector
By Source
Marine water
Fresh Water
Chapter 11. Asia Pacific Chlorella Ingredients Analysis and Outlook
11.1. Asia Pacific Chlorella Ingredients Revenue (USD Million), and Revenue (USD Million) by Segments (2021-2032)
11.1.1. Asia Pacific Chlorella Ingredients Revenue (USD Million) by Type (2021-2032)
11.1.2. Asia Pacific Chlorella Ingredients Revenue (USD Million) by Application (2021-2032)
11.1.3. Asia Pacific Chlorella Ingredients Revenue (USD Million) by Product (2021-2032)
By End-User
Food and Beverages
Health and Medical
Animal Feed
Cosmetics and Personal Care
Fertilizers Sector
By Source
Marine water
Fresh Water
Chapter 12. South America Chlorella Ingredients Analysis and Outlook
12.1. South America Chlorella Ingredients Revenue (USD Million), by Segments (2021-2032)
12.1.1. South America Chlorella Ingredients Revenue (USD Million) by Type (2021-2032)
12.1.2. South America Chlorella Ingredients Revenue (USD Million) by Application (2021-2032)
12.1.3. South America Chlorella Ingredients Revenue (USD Million) by Product (2021-2032)
By End-User
Food and Beverages
Health and Medical
Animal Feed
Cosmetics and Personal Care
Fertilizers Sector
By Source
Marine water
Fresh Water
Chapter 13. Middle East and Africa Chlorella Ingredients Analysis and Outlook
13.1. Middle East and Africa Chlorella Ingredients Revenue (USD Million), by Segments (2021-2032)
13.1.1. Middle East and Africa Chlorella Ingredients Revenue (USD Million) by Type (2021-2032)
13.1.2. Middle East and Africa Chlorella Ingredients Revenue (USD Million) by Application (2021-2032)
13.1.3. Middle East and Africa Chlorella Ingredients Revenue (USD Million) by Product (2021-2032)
By End-User
Food and Beverages
Health and Medical
Animal Feed
Cosmetics and Personal Care
Fertilizers Sector
By Source
Marine water
Fresh Water
Chapter 14. Chlorella Ingredients Company Profiles
14.1 Business Overview
14.2 Product Profiles
14.3 SWOT Profiles
14.5 Recent Developments
14.6 Financial Profile
List of Companies
Allmicroalgae - Natural Products
Duplaco
Like Chlorella Biotech
NP Nutra
Parry Nutraceuticals
Phycom BV
Roquette Klötze GmbH & Co. KG
Seagrass Tech Private Ltd
Sun Chrolella Corp
Vedan Enterprise
15. Methodology and Data Sources
15.1 Customization Offerings
15.2 Subscription Services
15.3 Related Reports
15.4 Publisher Expertise
LIST OF TABLES
Table 1 Market Segmentation Analysis
Table 2 Global Chlorella Ingredients Market Share of Leading Companies, 2023
Table 3 Product Offerings of Leading Companies
Table 4 Low Growth Scenario Forecasts
Table 5 Reference Case Growth Scenario
Table 6 High Growth Case Scenario
Table 7 Global Chlorella Ingredients Revenue (USD Million) And CAGR (%) By Type (2021-2032)
Table 8 Global Chlorella Ingredients Revenue (USD Million) And CAGR (%) By Application (2021-2032)
Table 9 Global Chlorella Ingredients Revenue (USD Million) And CAGR (%) By Product (2021-2032)
Table 10 Global Chlorella Ingredients Market Revenue (USD Million) By Regions (2021-2032)
Table 11 Global Chlorella Ingredients Market Share (%) By Regions (2021-2032)
Table 12 North America Chlorella Ingredients Revenue (USD Million) By Country (2021-2032)
Table 13 Europe Chlorella Ingredients Revenue (USD Million) By Country (2021-2032)
Table 14 Asia Pacific Chlorella Ingredients Revenue (USD Million) By Country (2021-2032)
Table 15 South America Chlorella Ingredients Revenue (USD Million) By Country (2021-2032)
Table 16 Middle East and Africa Chlorella Ingredients Revenue (USD Million) By Region (2021-2032)
Table 17 North America Chlorella Ingredients Revenue (USD Million) By Type (2021-2032)
Table 18 North America Chlorella Ingredients Revenue (USD Million) By Application (2021-2032)
Table 19 North America Chlorella Ingredients Revenue (USD Million) By Product (2021-2032)
Table 20 Europe Chlorella Ingredients Revenue (USD Million) By Type (2021-2032)
Table 21 Europe Chlorella Ingredients Revenue (USD Million) By Application (2021-2032)
Table 22 Europe Chlorella Ingredients Revenue (USD Million) By Product (2021-2032)
Table 23 Asia Pacific Chlorella Ingredients Revenue (USD Million) By Type (2021-2032)
Table 24 Asia Pacific Chlorella Ingredients Revenue (USD Million) By Application (2021-2032)
Table 25 Asia Pacific Chlorella Ingredients Revenue (USD Million) By Product (2021-2032)
Table 26 South America Chlorella Ingredients Revenue (USD Million) By Type (2021-2032)
Table 27 South America Chlorella Ingredients Revenue (USD Million) By Application (2021-2032)
Table 28 South America Chlorella Ingredients Revenue (USD Million) By Product (2021-2032)
Table 29 Middle East and Africa Chlorella Ingredients Revenue (USD Million) By Type (2021-2032)
Table 30 Middle East and Africa Chlorella Ingredients Revenue (USD Million) By Application (2021-2032)
Table 31 Middle East and Africa Chlorella Ingredients Revenue (USD Million) By Product (2021-2032)
LIST OF FIGURES
Figure 1. Market Scope
Figure 2. Pricing Forecasts Per Unit, 2023- 2032
Figure 3. Porter’s Five Forces
Figure 4. Global Chlorella Ingredients Market Revenue (USD Million) By Regions (2021-2032)
Figure 5. Global Chlorella Ingredients Market Share (%) By Regions (2023)
Figure 6. North America Chlorella Ingredients Revenue (USD Million) By Country (2021-2032)
Figure 7. United States Chlorella Ingredients Revenue (USD Million) By Country (2021-2032)
Figure 8. Canada Chlorella Ingredients Revenue (USD Million) By Country (2021-2032)
Figure 9. Mexico Chlorella Ingredients Revenue (USD Million) By Country (2021-2032)
Figure 10. Europe Chlorella Ingredients Revenue (USD Million) By Country (2021-2032)
Figure 11. Germany Chlorella Ingredients Revenue (USD Million) By Country (2021-2032)
Figure 12. France Chlorella Ingredients Revenue (USD Million) By Country (2021-2032)
Figure 13. United Kingdom Chlorella Ingredients Revenue (USD Million) By Country (2021-2032)
Figure 14. Spain Chlorella Ingredients Revenue (USD Million) By Country (2021-2032)
Figure 15. Italy Chlorella Ingredients Revenue (USD Million) By Country (2021-2032)
Figure 16. Russia Chlorella Ingredients Revenue (USD Million) By Country (2021-2032)
Figure 17. Rest of Europe Chlorella Ingredients Revenue (USD Million) By Country (2021-2032)
Figure 11. Asia Pacific Chlorella Ingredients Revenue (USD Million) By Country (2021-2032)
Figure 12. China Chlorella Ingredients Revenue (USD Million) By Country (2021-2032)
Figure 13. Japan Chlorella Ingredients Revenue (USD Million) By Country (2021-2032)
Figure 14. India Chlorella Ingredients Revenue (USD Million) By Country (2021-2032)
Figure 15. South Korea Chlorella Ingredients Revenue (USD Million) By Country (2021-2032)
Figure 16. Australia Chlorella Ingredients Revenue (USD Million) By Country (2021-2032)
Figure 17. South East Asia Chlorella Ingredients Revenue (USD Million) By Country (2021-2032)
Figure 18. South America Chlorella Ingredients Revenue (USD Million) By Country (2021-2032)
Figure 19. Brazil Chlorella Ingredients Revenue (USD Million) By Country (2021-2032)
Figure 20. Argentina Chlorella Ingredients Revenue (USD Million) By Country (2021-2032)
Figure 21. Rest of Asia Pacific Chlorella Ingredients Revenue (USD Million) By Country (2021-2032)
Figure 22. Middle East and Africa Chlorella Ingredients Revenue (USD Million) By Region (2021-2032)
Figure 23. Saudi Arabia Chlorella Ingredients Revenue (USD Million) By Region (2021-2032)
Figure 24. The UAE Chlorella Ingredients Revenue (USD Million) By Region (2021-2032)
Figure 25. Rest of Middle East Chlorella Ingredients Revenue (USD Million) By Region (2021-2032)
Figure 26. South Africa Chlorella Ingredients Revenue (USD Million) By Region (2021-2032)
Figure 27. Africa Chlorella Ingredients Revenue (USD Million) By Region (2021-2032)
Figure 28. North America Chlorella Ingredients Revenue (USD Million) By Type (2021-2032)
Figure 29. North America Chlorella Ingredients Revenue (USD Million) By Application (2021-2032)
Figure 30. North America Chlorella Ingredients Revenue (USD Million) By Product (2021-2032)
Figure 31. Europe Chlorella Ingredients Revenue (USD Million) By Type (2021-2032)
Figure 32. Europe Chlorella Ingredients Revenue (USD Million) By Application (2021-2032)
Figure 33. Europe Chlorella Ingredients Revenue (USD Million) By Product (2021-2032)
Figure 34. Asia Pacific Chlorella Ingredients Revenue (USD Million) By Type (2021-2032)
Figure 35. Asia Pacific Chlorella Ingredients Revenue (USD Million) By Application (2021-2032)
Figure 36. Asia Pacific Chlorella Ingredients Revenue (USD Million) By Product (2021-2032)
Figure 37. South America Chlorella Ingredients Revenue (USD Million) By Type (2021-2032)
Figure 38. South America Chlorella Ingredients Revenue (USD Million) By Application (2021-2032)
Figure 39. South America Chlorella Ingredients Revenue (USD Million) By Product (2021-2032)
Figure 40. Middle East and Africa Chlorella Ingredients Revenue (USD Million) By Type (2021-2032)
Figure 41. Middle East and Africa Chlorella Ingredients Revenue (USD Million) By Application (2021-2032)
Figure 42. Middle East and Africa Chlorella Ingredients Revenue (USD Million) By Product (2021-2032)
By End-User
Food and Beverages
Health and Medical
Animal Feed
Cosmetics and Personal Care
Fertilizers Sector
By Source
Marine water
Fresh Water
Countries Analyzed
North America (US, Canada, Mexico)
Europe (Germany, UK, France, Spain, Italy, Russia, Rest of Europe)
Asia Pacific (China, India, Japan, South Korea, Australia, South East Asia, Rest of Asia)
South America (Brazil, Argentina, Rest of South America)
Middle East and Africa (Saudi Arabia, UAE, Rest of Middle East, South Africa, Egypt, Rest of Africa)
