
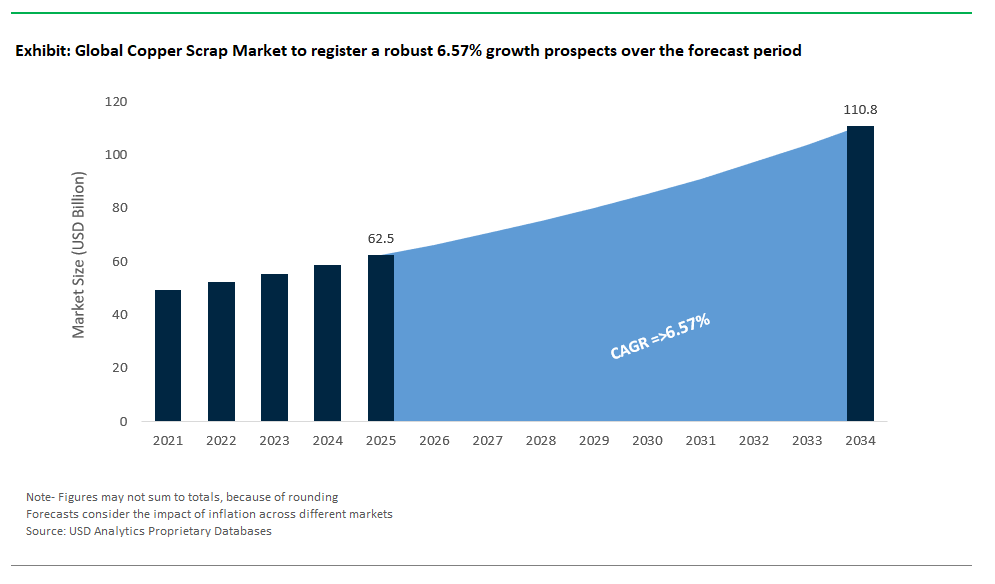
The global copper scrap industry is entering a period of robust expansion, with the market projected to surge from $62.5 billion in 2025 to $110.8 billion by 2034, reflecting a healthy CAGR of 6.57%. This sustained growth is a direct response to the world’s insatiable demand for copper, driven by the electrification of transportation, renewable energy development, and digital infrastructure expansion. As the backbone of the circular economy in metals, copper scrap recycling has evolved from a secondary supply stream into a critical pillar of global copper sourcing.
The copper scrap sector encompasses a broad array of activities, including the collection, sorting, processing, and refining of both industrial (new) and obsolete (old) copper scrap. Industrial scrap typically arises from manufacturing offcuts and trimmings, while obsolete scrap is sourced from end-of-life products like power cables, electronics, and plumbing materials. Recycling copper not only preserves valuable resources but also slashes energy usage and carbon emissions compared to primary mining and smelting making secondary copper a strategic asset for industries aiming to meet sustainability targets and regulatory mandates. As copper demand continues to accelerate, especially from high-growth sectors, the efficient recovery and utilization of scrap copper have become vital for ensuring supply chain resilience and resource stewardship.
The copper scrap market is witnessing a wave of strategic investments, technological innovations, and global partnerships all focused on increasing recycling efficiency and expanding supply capacity for high-purity copper.
In July 2025, HyProMag USA partnered with Intelligent Lifecycle Solutions (ILS), leveraging ILS’s 3rd generation HDD magnet separation technology to process electronic waste an innovation that underscores the industry’s drive toward advanced separation solutions for complex e-scrap, which is a major source of copper. Similarly, Mkango Resources’ July 2025 milestone in producing recycled rare earth alloy demonstrates how closed-loop processes are gaining traction for multiple valuable metals, including copper found in e-waste streams.
Primary copper supply constraints are adding urgency to scrap recycling: Anglo American’s 13% fall in copper output for H1 2025 highlights the need to bolster secondary supply channels. Meanwhile, Japanese copper smelters’ ongoing negotiations over treatment charges underscore the volatile economics of primary copper supply reinforcing the stability and attractiveness of recycled copper as a hedge against global supply risk.
On the processing front, Aurubis’ €85 million investment in its Belgian recycling plant (December 2024) is a prime example of scaling up advanced recovery capacity for copper and nickel. Similarly, Veolia’s new eco-friendly copper recovery solution (November 2024) for nuclear electrical cables, and Hindalco’s INR 2,000 crore investment in Indian copper and e-waste recycling (August 2023), both point to a sector prioritizing green innovation and capacity expansion. Industry consolidation, such as Nupur Recyclers’ March 2024 acquisition of Frank Metals Recyclers, signals a growing trend toward scale and operational synergies across regional markets, especially in fast-growing economies like India.
The copper scrap market is fundamentally shaped by the accelerating transition to electric vehicles and renewable energy systems. Electric vehicles (EVs) require up to four times as much copper as conventional cars, while large-scale wind turbines may contain several tons of copper in their generation and transmission systems. The rise of solar PV, battery storage, and grid upgrades all highly copper-intensive has made recycled copper indispensable for supporting global clean energy targets.
Government incentives and ambitious carbon neutrality policies in regions such as the EU, China, and North America are propelling the need for more robust copper recycling systems. According to the International Renewable Energy Agency (IRENA), copper demand could climb by 275% by 2050 on the back of green energy deployments a surge that primary mining alone cannot accommodate. As a result, end-of-life EVs, solar panels, and wind turbines are fast becoming crucial sources of high-grade scrap, prompting industry leaders to invest in facilities specifically designed for the recovery of copper from next-generation waste streams.
New technological advancements are revolutionizing the efficiency, quality, and profitability of copper scrap recycling. Sensor-based sorting technologies such as X-ray transmission, near-infrared spectroscopy, and even robotic automation now enable the precise separation of copper from mixed waste, boosting both yield and product purity. These improvements make recycled copper more suitable for demanding applications, from high-voltage electrical wiring to precision electronic components.
Advanced metallurgical and refining techniques are also unlocking higher value from complex scrap, such as printed circuit boards and multi-material e-waste. Fast, efficient magnet separation systems (as highlighted by Inserma’s technology) are producing cleaner copper feedstock and improving recovery rates. Industry R&D is focused on developing cost-effective methods to extract copper from previously uneconomic or contaminated sources, broadening the supply base and maximizing resource recovery. This evolution opens new market opportunities and strengthens the industry’s contribution to a low-carbon, resource-efficient economy.
The copper scrap industry is dominated by global recycling giants, integrated metal producers, and innovative regional players all investing in advanced technologies and sustainable business models.
Aurubis AG is recognized as the world’s largest copper recycler, producing high-purity copper cathodes and precious metals from both primary and secondary materials. The company’s €85 million investment in Belgium is expanding its state-of-the-art recovery capacity, positioning Aurubis as a leader in sustainable, resource-efficient metal production. Its circular economy strategy prioritizes maximum metal recovery from complex scrap, supporting both environmental goals and supply chain resilience.
Sims Limited (Australia): Global Integration and Technology Leadership
Sims Limited is a global powerhouse in metal recycling, with operations spanning ferrous and non-ferrous metals, including copper. Leveraging advanced shredding and separation technologies, Sims processes large volumes of copper scrap from end-of-life products and industrial waste. The company’s vertical integration from collection to processing and supply ensures control over quality and scale, while a focus on sustainability and technology sets it apart in the market.
Jain Metal Group specializes in the recovery and processing of copper cables and e-waste in India, supplying refined copper billets and high-purity scrap to key manufacturing sectors. With decades of expertise and a new, state-of-the-art recycling plant, Jain Metal is at the forefront of India’s effort to build a closed-loop metal economy, addressing both resource conservation and environmental sustainability.
Hindalco is a major global producer of copper and aluminum, with an expanding focus on copper scrap and e-waste recycling. Its significant capital commitment is aimed at boosting India’s recycling capacity and reducing e-waste, while supplying high-quality recycled copper rods for sensitive industrial uses. Hindalco’s integrated operations and green initiatives underscore its role as a circular economy leader in Asia.
CMC’s robust network of recycling facilities and steel mills enables the efficient collection, processing, and supply of both ferrous and non-ferrous metals, including copper scrap. The company’s integrated model supports both in-house steelmaking and external sales, with a strong emphasis on sustainability and resource conversion. CMC’s operations exemplify the circular economy in action, turning metal waste into valuable raw materials for construction and manufacturing.
No. 1 copper scrap secures a leading 22% market share in 2025, remaining the preferred grade among smelters due to its high purity exceeding 99% copper content and minimal processing requirements. Alongside No. 1, Bare Bright copper scrap (also high-purity) continues to dominate global trade, especially in regions where direct remelting is essential for cost efficiency and quality control. These high-grade categories are critical for primary copper producers seeking to maximize recovery and reduce refining costs, particularly as supply chain sustainability and purity standards rise. Insulated copper wire scrap commands a significant 15% market share, reflecting the ongoing surge in electronic waste recycling and growing copper intensity in consumer electronics, telecom, and power infrastructure. However, this segment’s value chain requires sophisticated stripping and separation processes before refining, adding complexity and cost but also presenting substantial opportunities for advanced recyclers.
Brass, bronze, and mixed copper scrap remain essential for alloy producers, serving as key raw materials for foundries and secondary brass/bronze manufacturing. Mixed copper scrap, while delivering lower margins due to increased sorting and contamination, still plays a pivotal role in bulk recycling programs, especially in regions with less formalized collection systems. As regulatory and environmental pressures mount, advanced sorting technologies and process innovations are expected to further shift market shares toward higher-grade, cleaner scrap, with increased emphasis on supply chain traceability and the circular economy.
Industrial scrap (new scrap) is the leading source in the copper scrap market, accounting for 35% of global supply in 2025. Derived from manufacturing offcuts, production line waste, and fabrication residues, industrial scrap is prized for its consistent quality, minimal contamination, and predictable volume making it highly attractive for both primary and secondary copper producers. The dominance of industrial scrap highlights the strong integration of copper recycling within global manufacturing, particularly in electronics, automotive, and heavy equipment industries where scrap recovery is increasingly optimized through digital tracking and process automation.
Electrical & electronic scrap (E-waste) now constitutes 25% of market share and stands out as the fastest-growing segment. Global mandates for electronics recycling, combined with the increasing copper content in printed circuit boards, power systems, and appliances, are fueling this expansion. E-waste is a major focal point for regulatory innovation, investment in advanced separation technologies, and the recovery of both copper and critical minerals. Construction, automotive, plumbing, and consumer goods scrap remain steady contributors, tightly linked to urbanization, demolition, vehicle recycling, and household circularity initiatives. As governments strengthen EPR (Extended Producer Responsibility) and waste management frameworks, the share of organized and high-value copper scrap from all sources is set to rise, further accelerating the evolution toward a more circular and resilient global copper economy.
.png)
China remains the world’s largest consumer and importer of copper scrap, underpinned by massive growth in manufacturing, construction, and electronics sectors. The country’s insatiable demand for copper supports both primary imports and a strategic focus on copper scrap, especially for applications in electrical wiring, electronics, and urban infrastructure. In response to mounting environmental pressures, China’s "National Sword" policy has imposed strict quality standards on imported copper scrap, dramatically shifting global flows toward higher-purity and cleaner materials. This regulatory tightening has led to rapid upgrades in both domestic recycling infrastructure and import supply chains, catalyzing investments in advanced sorting, detection, and processing technologies. As China continues to emphasize circular economy principles, resource efficiency, and urban mining, the country’s copper recycling sector is increasingly defined by quality, scale, and the integration of secondary copper into manufacturing.
Government-driven initiatives are strengthening domestic collection and processing capabilities, while continuous investment in automation and digitalization supports China’s ambition to lead the global recycling value chain. With ongoing efforts to secure both primary and secondary copper resources, China’s influence over global scrap pricing, trade flows, and technology adoption will remain profound for the foreseeable future.
India is emerging as a copper scrap powerhouse, propelled by rapid urbanization, government investment in infrastructure, and progressive recycling policies. National programs such as "Make in India," along with the Production Linked Incentive (PLI) scheme, are driving major manufacturing expansions in construction, automotive, electronics, and power sectors. As copper demand surges, the recycling ecosystem is scaling quickly exemplified by Hindalco’s INR 2,000 crore investment in copper and e-waste recycling. India is a major consumer of copper scrap for wire rod and brass mills, foundries, and ingot makers, leveraging both domestic recovery and rising imports to satisfy industrial needs.
The government’s implementation of Extended Producer Responsibility (EPR), Battery Waste Management Rules, and non-ferrous recycling frameworks is formalizing the sector and boosting collection rates, especially for e-waste and industrial scrap. Technological advancements such as automated cable stripping and local production of copper alloys from recycled feedstock are elevating India’s capabilities. As the informal sector is gradually brought into the fold, and product innovations in billet and alloy production expand, India is set to become a model for developing markets seeking to achieve sustainable, circular growth in copper resource management.
The United States stands as both a top generator and exporter of copper scrap, with its extensive industrial base and mature recycling infrastructure. The U.S. utilizes a high percentage of recycled copper, with key applications spanning electrical and electronics (45% of domestic copper use) and construction (28%). Robust environmental regulations and a strong sustainability ethos underpin efficient collection and high recovery rates over 66% of copper scrap is efficiently recovered and processed domestically. U.S. recyclers and technology providers are global leaders in advanced sorting, magnet separation, and e-waste disassembly, driving ever-greater purity and value from recovered copper streams.
The U.S. is also at the forefront of e-waste recycling, with ongoing R&D focused on recovering critical minerals and rare earths in addition to copper. Major exporters of copper scrap, American firms shape global trade dynamics, supported by innovation, high-quality standards, and strategic partnerships. As infrastructure renewal, grid modernization, and green manufacturing initiatives gain pace, the U.S. copper scrap market is well positioned for sustained growth, both at home and as a key supplier to international buyers.
Germany is synonymous with technological excellence in recycling and a robust circular economy model. As home to global leaders like Aurubis AG, the country continuously invests in state-of-the-art recycling facilities and process innovation for copper and non-ferrous metals. Germany’s rigorous environmental regulations drive high collection rates and quality standards, while policy frameworks promote resource efficiency and minimal landfill waste. The industrial sector particularly automotive, electrical, and advanced manufacturing relies heavily on high-quality secondary copper, creating stable domestic demand.
Germany is also a major player in the global copper scrap trade, exporting wire and specialty copper products while maintaining a reputation for high-grade secondary materials. The country’s recycling ecosystem is further strengthened by ongoing research in complex raw material processing and the recovery of valuable by-products. As Germany deepens its focus on green manufacturing and supply chain decarbonization, its leadership in sustainable copper recycling is poised to grow even stronger.
Japan’s copper scrap market is defined by world-class technological innovation and a national commitment to resource efficiency. With strict waste management regulations and a drive for circularity, Japan invests heavily in advanced sorting, e-waste processing, and urban mining recovering copper and other valuable metals from discarded electronic devices and industrial scrap. The electronics, automotive, and precision machinery sectors create substantial demand for high-purity recycled copper, supported by continuous R&D in refining and material separation.
Japanese recyclers are global pioneers in achieving exceptional purity and yield from complex waste streams, with ongoing investments in urban mining and the extraction of rare metals. The country also supplements its domestic recycling with strategic copper scrap imports. As Japan pushes the boundaries of sustainable resource management, its expertise in e-waste, refining, and alloy production will remain globally influential.
South Korea’s advanced manufacturing sector underpins a sophisticated copper scrap market, with strong emphasis on recycling for electronics and automotive applications. The country’s focus on waste management and resource recovery is reflected in rising collection rates, enhanced by investments in automated sorting and processing equipment. South Korea is a leading importer of copper scrap, integrating secondary copper into high-value product chains and specialty alloy production.
Government policies encourage efficient scrap utilization, while major industrial players focus on innovation in refining and alloy applications. The country’s forward-looking approach, commitment to circular economy principles, and technological acumen make it a standout in the Asia-Pacific copper recycling landscape.
Brazil is experiencing robust growth in copper scrap demand, fueled by expanding automotive manufacturing, infrastructure, and industrial sectors. As government incentives and circular economy awareness increase, copper recycling is gaining prominence across construction, transportation, and consumer goods value chains. The adoption of modern collection, sorting, and processing technologies is improving recovery rates and supporting the development of a more formalized recycling industry.
Efforts to professionalize the informal sector, invest in new plants, and leverage domestic scrap resources are helping Brazil reduce reliance on primary copper imports. As industrial output and recycling infrastructure grow in tandem, Brazil is positioned to become a major regional hub for sustainable copper scrap processing.
The United Kingdom’s copper scrap market is distinguished by strong policy support for recycling, sustainability, and decarbonization. Initiatives such as the "Green Industrial Revolution" and new mandates for metal scrap recovery are boosting investments in advanced recycling facilities and sorting technologies. The UK is increasingly focused on resource efficiency, with growing demand for recycled copper in construction, electronics, and automotive manufacturing.
Research into innovative recovery methods for end-of-life products and the drive toward a circular economy underpin the sector’s ongoing transformation. As the UK strengthens its infrastructure for resource recovery and maximizes the value of domestic scrap, it is setting a benchmark for efficient, sustainable copper recycling in Europe and beyond.
|
Parameter |
Details |
|
Market Size (2025) |
$62.5 Billion |
|
Market Size (2034) |
$110.8 Billion |
|
Market Growth Rate |
6.57% |
|
Segments |
By Grade (No. 1 Copper Scrap, No. 2 Copper Scrap, Bare Bright Copper Scrap, Insulated Copper Wire Scrap, Copper Bearing Scrap, Brass Scrap, Bronze Scrap, Mixed Copper Scrap) |
|
Study Period |
2019- 2024 and 2025-2034 |
|
Units |
Revenue (USD) |
|
Qualitative Analysis |
Porter’s Five Forces, SWOT Profile, Market Share, Scenario Forecasts, Market Ecosystem, Company Ranking, Market Dynamics, Industry Benchmarking |
|
Companies |
Aurubis AG, Sims Limited, Jain Metal Group, Hindalco Industries Limited, Commercial Metals Company (CMC), Schnitzer Steel Industries, Inc., European Metal Recycling (EMR), Kuusakoski Recycling, OmniSource Corporation (a subsidiary of Steel Dynamics, Inc.), Nucor Corporation (through its recycling operations), Nupur Recyclers, Gravita India Ltd., Umicore N.V., Glencore PLC (in its recycling and trading activities), Boliden AB |
|
Countries |
US, Canada, Mexico, Germany, France, Spain, Italy, UK, Russia, China, India, Japan, South Korea, Australia, South East Asia, Brazil, Argentina, Middle East, Africa |
* List Not Exhaustive
This report investigates the rapidly evolving global copper scrap market, presenting in-depth analysis reviews, breakthrough trends in secondary copper processing, and expert insights into the future of circular economy metals. USDAnalytics’ rigorous research highlights market drivers, technological innovations, and regulatory frameworks, making this report an essential resource for metal recyclers, copper producers, policy makers, manufacturers, and investors seeking to understand, benchmark, and capitalize on shifts in copper scrap sourcing, processing, and end-use applications worldwide.
USDAnalytics ensures that this copper scrap market report delivers the actionable intelligence, granular segmentation, and future-focused analysis needed to navigate complex supply chains, regulatory transitions, and the growing importance of circular economy metals. The report empowers stakeholders to anticipate market trends, benchmark global competitors, and formulate data-driven growth strategies for sustainable copper resource management.
Table of Contents: Copper Scrap Market
1. Executive Summary
2. Copper Scrap Industry Landscape & Outlook (2025–2034)
3. Market Analysis: Technology Investments, Industry Consolidation, and Sustainability Drive Momentum
4. Trends and Opportunities: Green Energy and Advanced Sorting Set New Standards
5. Competitive Landscape: Leading Players in the Global Copper Scrap Industry
6. Copper Scrap Market Share Analysis: Key Segment Insights for 2025
7. Country Analysis and Outlook of Copper Scrap Market
8. Copper Scrap Market Size Outlook by Region (2025-2034)
9. Company Profiles: Leading Players in the Copper Scrap Market
10. Methodology
11. Appendix
The copper scrap market is projected to surge from $62.5 billion in 2025 to $110.8 billion by 2034 (CAGR 6.57%), fueled by the relentless demand for copper in electrification, renewable energy, and digital infrastructure. As primary copper supplies tighten, copper scrap recycling has become an indispensable pillar of global supply—significantly reducing energy use and emissions compared to primary mining. The industry’s role in the circular economy is underscored by its ability to recover, refine, and return high-quality copper to manufacturing, supporting sustainability targets and ensuring supply chain resilience in sectors ranging from automotive to electronics and renewable energy.
Key trends include surging demand for recycled copper from electric vehicles (EVs) and renewable energy systems, which require significantly more copper than traditional technologies. The exponential rise in e-waste, government carbon-neutrality targets, and ambitious global infrastructure projects are propelling the need for efficient copper recycling. Technological innovations in sorting, shredding, and refining—like sensor-based separation and advanced metallurgy—are boosting yield, purity, and profitability. The evolution of urban mining, regulatory tightening (such as China’s National Sword policy), and increased investments in automated recycling are opening new opportunities for advanced recyclers and expanding the accessible scrap base.
No. 1 copper scrap and Bare Bright copper scrap (high-purity grades) lead by grade, securing a combined 22%+ market share due to their suitability for direct remelting and high recovery rates. Insulated wire and e-waste grades are growing rapidly with the electronics boom. By source, industrial (new) scrap accounts for 35% of global supply, prized for its predictable quality and high copper content. E-waste now makes up 25% of market share and is the fastest-growing segment, reflecting global mandates for electronics recycling and the increasing copper content in digital devices and renewable energy systems.
Global leaders include Aurubis AG (Germany), the world’s largest copper recycler investing in advanced facilities; Sims Limited (Australia), with a global footprint and cutting-edge sorting technology; Jain Metal Group and Hindalco (India), pioneers in e-waste and cable recycling; and CMC (USA), integrating end-to-end metal recycling with green manufacturing. At the country level, China remains the largest consumer and importer, driving global flows and standards with its regulatory policies. India is rapidly scaling up with formalization and infrastructure investments. The U.S. leads in technology and e-waste processing, Germany in circular economy policy and export, and Japan in urban mining and high-tech recovery.
Rising environmental regulations—such as China’s import quality standards, India’s EPR and battery waste management rules, and the EU’s circular economy policies—are pushing the industry toward higher-purity scrap and formalized, traceable supply chains. Technological adoption is accelerating: sensor-based sorting, robotic automation, and advanced refining are unlocking higher yield from complex, contaminated, or mixed scrap. These trends are reducing landfill, maximizing recovery, and ensuring that recycled copper meets the increasingly stringent standards demanded by high-tech and green manufacturing sectors worldwide.