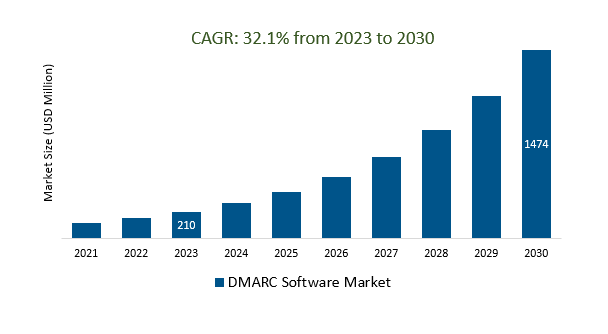
The Global DMARC Software Market Size is estimated to be US 210 Million in 2023 and is poised to register 32.1% growth over the forecast period from 2023 to 2030 to reach US $ 1474 Million in 2030.
The market growth is driven by the increasing DMARC software providers are enhancing their offerings with incident response and threat intelligence capabilities to help organizations respond effectively to email-based threats. Leading companies that are focused on Increased Adoption, Regulatory Mandates, Expanded Use Cases, AI and Automation, Managed Services, Education and Training, Cross-Industry Collaboration, and others to boost market shares in the industry.
Market Overview
The DMARC (Domain-based Message Authentication, Reporting, and Conformance) software market was witnessing significant growth driven by escalating cybersecurity threats, regulatory compliance requirements, and increasing demand for email authentication. Organizations were adopting DMARC to counter email-based threats, improve email deliverability, and achieve regulatory compliance. Key players included Agari, Valimail, Proofpoint, and others. Challenges included implementation complexity and a lack of awareness among some organizations. The market was dynamic, and developments may have occurred since then, making it important to consult recent industry sources for the latest information.
Market Dynamics
Market Trends - Benefits of using DMARC software
DMARC (Domain-based Message Authentication, Reporting, and Conformance) software in the DMARC Software Market offers enhanced email security by preventing email spoofing and phishing, thus reducing the risk of brand impersonation and improving email deliverability. It helps organizations achieve regulatory compliance, provides detailed reporting and visibility, and aids in phishing incident response. DMARC software builds customer trust, reduces business risks, and can be integrated with other security solutions. Customization options and open-source alternatives offer flexibility for organizations, making DMARC an essential tool for email authentication and security.
Market Driver- Globalization and Remote Work Demand DMARC Software Market
Globalization and the rise of remote work have spurred increased demand for DMARC (Domain-based Message Authentication, Reporting, and Conformance) software in the market. This demand is driven by the need to secure email communication in a globalized business landscape, where emails are sent from various locations, and remote work exposes organizations to cybersecurity threats. DMARC software ensures global email authentication, protects against international threats, maintains cross-border communication trust, and aids compliance with global regulations, all while safeguarding brand reputation and facilitating incident response in a remote work context.
Market Opportunity-Introduction of Cloud Adoption
The adoption of DMARC (Domain-based Message Authentication, Reporting, and Conformance) software in cloud-based email environments is on the rise. Organizations are shifting to cloud email platforms, and DMARC solutions have followed suit, offering seamless integration, scalability, centralized management, real-time updates, and cost-effective options for securing email communication in cloud-centric settings. These solutions are compatible with major cloud service providers, and provide global accessibility, scalable reporting, and API integration, making them essential for organizations adapting to the cloud and seeking robust email security.
Market Share Analysis- Cloud Based DMARC Software Market will register the fastest growth
The Global DMARC Software Market is analyzed across Cloud Based, Wed Based, and others. Cloud Based is poised to register the fastest growth. Cloud-based DMARC (Domain-based Message Authentication, Reporting, and Conformance) solutions are becoming increasingly popular in the DMARC Software Market due to their simplified deployment, scalability, centralized management, real-time updates, cost-effectiveness, compatibility with major cloud service providers, global accessibility, scalable reporting, and API integration capabilities. These solutions are well-suited for organizations migrating to cloud-based email platforms, offering efficient and flexible email security management in a cloud-centric environment.
Market Share Analysis- Large Enterprises held a significant market share in 2023
The Global DMARC Software Market is analyzed across various applications including Large Enterprises, SMEs, and others. Of these, Large Enterprises held a significant market share in 2023. In the DMARC Software Market, large enterprises are prominent users of DMARC solutions due to their complex email ecosystems and high security requirements. DMARC helps them establish robust email security, meet strict regulatory compliance, manage intricate email infrastructures, and secure global operations. It offers efficient incident response capabilities, customization options, centralized management, scalability, and integration possibilities, addressing the specific needs of large organizations effectively.
DMARC Software Market Segmentation
By Type
By Application
By Region
- North America (United States, Canada, Mexico)
- Europe (Germany, France, United Kingdom, Spain, Italy, Others)
- Asia Pacific (China, India, Japan, South Korea, Australia, Others)
- Latin America (Brazil, Argentina, Others)
- Middle East and Africa (Saudi Arabia, UAE, Kuwait, Other Middle East, South Africa, Nigeria, Other Africa)
DMARC Software Market Companies
- Barracuda Sentinel
- MxToolbox
- EasyDMARC
- ValiMail
- OnDMARC
- Agari
- DMARC Analyzer
- 250ok DMARC
- Dmarcian
- GoDMARC
*List not exhaustive
DMARC Software Market Outlook 2023
1 Market Overview
1.1 Introduction to the DMARC Software Market
1.2 Scope of the Study
1.3 Research Objective
1.3.1 Key Market Scope and Segments
1.3.2 Players Covered
1.3.3 Years Considered
2 Executive Summary
2.1 2023 DMARC Software Industry- Market Statistics
3 Market Dynamics
3.1 Market Drivers
3.2 Market Challenges
3.3 Market Opportunities
3.4 Market Trends
4 Market Factor Analysis
4.1 Porter’s Five Forces
4.2 Market Entropy
4.2.1 Global DMARC Software Market Companies with Area Served
4.2.2 Products Offerings Global DMARC Software Market
5 COVID-19 Impact Analysis and Outlook Scenarios
5.1.1 Covid-19 Impact Analysis
5.1.2 Post-COVID-19 Scenario- Low Growth Case
5.1.3 Post-COVID-19 Scenario- Reference Growth Case
5.1.4 Post-COVID-19 Scenario- Low Growth Case
6 Global DMARC Software Market Trends
6.1 Global DMARC Software Revenue (USD Million) and CAGR (%) by Type (2018-2030)
6.2 Global DMARC Software Revenue (USD Million) and CAGR (%) by Applications (2018-2030)
6.3 Global DMARC Software Revenue (USD Million) and CAGR (%) by Regions (2018-2030)
7 Global DMARC Software Market Revenue (USD Million) by Type, and Applications (2018-2022)
7.1 Global DMARC Software Revenue (USD Million) by Type (2018-2022)
7.1.1 Global DMARC Software Revenue (USD Million), Market Share (%) by Type (2018-2022)
7.2 Global DMARC Software Revenue (USD Million) by Applications (2018-2022)
7.2.1 Global DMARC Software Revenue (USD Million), Market Share (%) by Applications (2018-2022)
8 Global DMARC Software Development Regional Status and Outlook
8.1 Global DMARC Software Revenue (USD Million) By Regions (2018-2022)
8.2 North America DMARC Software Revenue (USD Million) by Type, and Application (2018-2022)
8.2.1 North America DMARC Software Revenue (USD Million) by Country (2018-2022)
8.2.2 North America DMARC Software Revenue (USD Million) by Type (2018-2022)
8.2.3 North America DMARC Software Revenue (USD Million) by Applications (2018-2022)
8.3 Europe DMARC Software Revenue (USD Million), by Type, and Applications (USD Million) (2018-2022)
8.3.1 Europe DMARC Software Revenue (USD Million), by Country (2018-2022)
8.3.2 Europe DMARC Software Revenue (USD Million) by Type (2018-2022)
8.3.3 Europe DMARC Software Revenue (USD Million) by Applications (2018-2022)
8.4 Asia Pacific DMARC Software Revenue (USD Million), and Revenue (USD Million) by Type, and Applications (2018-2022)
8.4.1 Asia Pacific DMARC Software Revenue (USD Million) by Country (2018-2022)
8.4.2 Asia Pacific DMARC Software Revenue (USD Million) by Type (2018-2022)
8.4.3 Asia Pacific DMARC Software Revenue (USD Million) by Applications (2018-2022)
8.5 South America DMARC Software Revenue (USD Million), by Type, and Applications (2018-2022)
8.5.1 South America DMARC Software Revenue (USD Million), by Country (2018-2022)
8.5.2 South America DMARC Software Revenue (USD Million) by Type (2018-2022)
8.5.3 South America DMARC Software Revenue (USD Million) by Applications (2018-2022)
8.6 Middle East and Africa DMARC Software Revenue (USD Million), by Type, Technology, Application, Thickness (2018-2022)
8.6.1 Middle East and Africa DMARC Software Revenue (USD Million) by Country (2018-2022)
8.6.2 Middle East and Africa DMARC Software Revenue (USD Million) by Type (2018-2022)
8.6.3 Middle East and Africa DMARC Software Revenue (USD Million) by Applications (2018-2022)
9 Company Profiles
10 Global DMARC Software Market Revenue (USD Million), by Type, and Applications (2023-2030)
10.1 Global DMARC Software Revenue (USD Million) and Market Share (%) by Type (2023-2030)
10.1.1 Global DMARC Software Revenue (USD Million), and Market Share (%) by Type (2023-2030)
10.2 Global DMARC Software Revenue (USD Million) and Market Share (%) by Applications (2023-2030)
10.2.1 Global DMARC Software Revenue (USD Million), and Market Share (%) by Applications (2023-2030)
11 Global DMARC Software Development Regional Status and Outlook Forecast
11.1 Global DMARC Software Revenue (USD Million) By Regions (2023-2030)
11.2 North America DMARC Software Revenue (USD Million) by Type, and Applications (2023-2030)
11.2.1 North America DMARC Software Revenue (USD) Million by Country (2023-2030)
11.2.2 North America DMARC Software Revenue (USD Million), by Type (2023-2030)
11.2.3 North America DMARC Software Revenue (USD Million), Market Share (%) by Applications (2023-2030)
11.3 Europe DMARC Software Revenue (USD Million), by Type, and Applications (2023-2030)
11.3.1 Europe DMARC Software Revenue (USD Million), by Country (2023-2030)
11.3.2 Europe DMARC Software Revenue (USD Million), by Type (2023-2030)
11.3.3 Europe DMARC Software Revenue (USD Million), by Applications (2023-2030)
11.4 Asia Pacific DMARC Software Revenue (USD Million) by Type, and Applications (2023-2030)
11.4.1 Asia Pacific DMARC Software Revenue (USD Million), by Country (2023-2030)
11.4.2 Asia Pacific DMARC Software Revenue (USD Million), by Type (2023-2030)
11.4.3 Asia Pacific DMARC Software Revenue (USD Million), by Applications (2023-2030)
11.5 South America DMARC Software Revenue (USD Million), by Type, and Applications (2023-2030)
11.5.1 South America DMARC Software Revenue (USD Million), by Country (2023-2030)
11.5.2 South America DMARC Software Revenue (USD Million), by Type (2023-2030)
11.5.3 South America DMARC Software Revenue (USD Million), by Applications (2023-2030)
11.6 Middle East and Africa DMARC Software Revenue (USD Million), by Type, and Applications (2023-2030)
11.6.1 Middle East and Africa DMARC Software Revenue (USD Million), by Region (2023-2030)
11.6.2 Middle East and Africa DMARC Software Revenue (USD Million), by Type (2023-2030)
11.6.3 Middle East and Africa DMARC Software Revenue (USD Million), by Applications (2023-2030)
12 Methodology and Data Sources
12.1 Methodology/Research Approach
12.1.1 Research Programs/Design
12.1.2 Market Size Estimation
12.1.3 Market Breakdown and Data Triangulation
12.2 Data Sources
12.2.1 Secondary Sources
12.2.2 Primary Sources
12.3 Disclaimer
List of Tables
Table 1 Market Segmentation Analysis
Table 2 Global DMARC Software Market Companies with Areas Served
Table 3 Products Offerings Global DMARC Software Market
Table 4 Low Growth Scenario Forecasts
Table 5 Reference Case Growth Scenario
Table 6 High Growth Case Scenario
Table 7 Global DMARC Software Revenue (USD Million) And CAGR (%) By Type (2018-2030)
Table 8 Global DMARC Software Revenue (USD Million) And CAGR (%) By Applications (2018-2030)
Table 9 Global DMARC Software Revenue (USD Million) And CAGR (%) By Regions (2018-2030)
Table 10 Global DMARC Software Revenue (USD Million) By Type (2018-2022)
Table 11 Global DMARC Software Revenue Market Share (%) By Type (2018-2022)
Table 12 Global DMARC Software Revenue (USD Million) By Applications (2018-2022)
Table 13 Global DMARC Software Revenue Market Share (%) By Applications (2018-2022)
Table 14 Global DMARC Software Market Revenue (USD Million) By Regions (2018-2022)
Table 15 Global DMARC Software Market Share (%) By Regions (2018-2022)
Table 16 North America DMARC Software Revenue (USD Million) By Country (2018-2022)
Table 17 North America DMARC Software Revenue (USD Million) By Type (2018-2022)
Table 18 North America DMARC Software Revenue (USD Million) By Applications (2018-2022)
Table 19 Europe DMARC Software Revenue (USD Million) By Country (2018-2022)
Table 20 Europe DMARC Software Revenue (USD Million) By Type (2018-2022)
Table 21 Europe DMARC Software Revenue (USD Million) By Applications (2018-2022)
Table 22 Asia Pacific DMARC Software Revenue (USD Million) By Country (2018-2022)
Table 23 Asia Pacific DMARC Software Revenue (USD Million) By Type (2018-2022)
Table 24 Asia Pacific DMARC Software Revenue (USD Million) By Applications (2018-2022)
Table 25 South America DMARC Software Revenue (USD Million) By Country (2018-2022)
Table 26 South America DMARC Software Revenue (USD Million) By Type (2018-2022)
Table 27 South America DMARC Software Revenue (USD Million) By Applications (2018-2022)
Table 28 Middle East and Africa DMARC Software Revenue (USD Million) By Region (2018-2022)
Table 29 Middle East and Africa DMARC Software Revenue (USD Million) By Type (2018-2022)
Table 30 Middle East and Africa DMARC Software Revenue (USD Million) By Applications (2018-2022)
Table 31 Financial Analysis
Table 32 Global DMARC Software Revenue (USD Million) By Type (2023-2030)
Table 33 Global DMARC Software Revenue Market Share (%) By Type (2023-2030)
Table 34 Global DMARC Software Revenue (USD Million) By Applications (2023-2030)
Table 35 Global DMARC Software Revenue Market Share (%) By Applications (2023-2030)
Table 36 Global DMARC Software Market Revenue (USD Million), And Revenue (USD Million) By Regions (2023-2030)
Table 37 North America DMARC Software Revenue (USD)By Country (2023-2030)
Table 38 North America DMARC Software Revenue (USD Million) By Type (2023-2030)
Table 39 North America DMARC Software Revenue (USD Million) By Applications (2023-2030)
Table 40 Europe DMARC Software Revenue (USD Million) By Country (2023-2030)
Table 41 Europe DMARC Software Revenue (USD Million) By Type (2023-2030)
Table 42 Europe DMARC Software Revenue (USD Million) By Applications (2023-2030)
Table 43 Asia Pacific DMARC Software Revenue (USD Million) By Country (2023-2030)
Table 44 Asia Pacific DMARC Software Revenue (USD Million) By Type (2023-2030)
Table 45 Asia Pacific DMARC Software Revenue (USD Million) By Applications (2023-2030)
Table 46 South America DMARC Software Revenue (USD Million) By Country (2023-2030)
Table 47 South America DMARC Software Revenue (USD Million) By Type (2023-2030)
Table 48 South America DMARC Software Revenue (USD Million) By Applications (2023-2030)
Table 49 Middle East and Africa DMARC Software Revenue (USD Million) By Region (2023-2030)
Table 50 Middle East and Africa DMARC Software Revenue (USD Million) By Region (2023-2030)
Table 51 Middle East and Africa DMARC Software Revenue (USD Million) By Type (2023-2030)
Table 52 Middle East and Africa DMARC Software Revenue (USD Million) By Applications (2023-2030)
Table 53 Research Programs/Design for This Report
Table 54 Key Data Information from Secondary Sources
Table 55 Key Data Information from Primary Sources
List of Figures
Figure 1 Market Scope
Figure 2 Porter’s Five Forces
Figure 3 Global DMARC Software Revenue (USD Million) By Type (2018-2022)
Figure 4 Global DMARC Software Revenue Market Share (%) By Type (2022)
Figure 5 Global DMARC Software Revenue (USD Million) By Applications (2018-2022)
Figure 6 Global DMARC Software Revenue Market Share (%) By Applications (2022)
Figure 7 Global DMARC Software Market Revenue (USD Million) By Regions (2018-2022)
Figure 8 Global DMARC Software Market Share (%) By Regions (2022)
Figure 9 North America DMARC Software Revenue (USD Million) By Country (2018-2022)
Figure 10 North America DMARC Software Revenue (USD Million) By Type (2018-2022)
Figure 11 North America DMARC Software Revenue (USD Million) By Applications (2018-2022)
Figure 12 Europe DMARC Software Revenue (USD Million) By Country (2018-2022)
Figure 13 Europe DMARC Software Revenue (USD Million) By Type (2018-2022)
Figure 14 Europe DMARC Software Revenue (USD Million) By Applications (2018-2022)
Figure 15 Asia Pacific DMARC Software Revenue (USD Million) By Country (2018-2022)
Figure 16 Asia Pacific DMARC Software Revenue (USD Million) By Type (2018-2022)
Figure 17 Asia Pacific DMARC Software Revenue (USD Million) By Applications (2018-2022)
Figure 18 South America DMARC Software Revenue (USD Million) By Country (2018-2022)
Figure 19 South America DMARC Software Revenue (USD Million) By Type (2018-2022)
Figure 20 South America DMARC Software Revenue (USD Million) By Applications (2018-2022)
Figure 21 Middle East and Africa DMARC Software Revenue (USD Million) By Region (2018-2022)
Figure 22 Middle East and Africa DMARC Software Revenue (USD Million) By Type (2018-2022)
Figure 23 Middle East and Africa DMARC Software Revenue (USD Million) By Applications (2018-2022)
Figure 24 Global DMARC Software Revenue (USD Million) By Type (2023-2030)
Figure 25 Global DMARC Software Revenue Market Share (%) By Type (2030)
Figure 26 Global DMARC Software Revenue (USD Million) By Applications (2023-2030)
Figure 27 Global DMARC Software Revenue Market Share (%) By Applications (2030)
Figure 28 Global DMARC Software Market Revenue (USD Million) By Regions (2023-2030)
Figure 29 North America DMARC Software Revenue (USD Million) By Country (2023-2030)
Figure 30 North America DMARC Software Revenue (USD Million) By Type (2023-2030)
Figure 31 North America DMARC Software Revenue (USD Million) By Applications (2023-2030)
Figure 32 Europe DMARC Software Revenue (USD Million) By Country (2023-2030)
Figure 33 Europe DMARC Software Revenue (USD Million) By Type (2023-2030)
Figure 34 Europe DMARC Software Revenue (USD Million) By Applications (2023-2030)
Figure 35 Asia Pacific DMARC Software Revenue (USD Million) By Country (2023-2030)
Figure 36 Asia Pacific DMARC Software Revenue (USD Million) By Type (2023-2030)
Figure 37 Asia Pacific DMARC Software Revenue (USD Million) By Applications (2023-2030)
Figure 38 South America DMARC Software Revenue (USD Million) By Country (2023-2030)
Figure 39 South America DMARC Software Revenue (USD Million) By Type (2023-2030)
Figure 40 South America DMARC Software Revenue (USD Million) By Applications (2023-2030)
Figure 41 Middle East and Africa DMARC Software Revenue (USD Million) By Region (2023-2030)
Figure 42 Middle East and Africa DMARC Software Revenue (USD Million) By Region (2023-2030)
Figure 43 Middle East and Africa DMARC Software Revenue (USD Million) By Type (2023-2030)
Figure 44 Middle East and Africa DMARC Software Revenue (USD Million) By Applications (2023-2030)
Figure 45 Bottom-Up and Top-Down Approaches For This Report
Figure 46 Data Triangulation
