
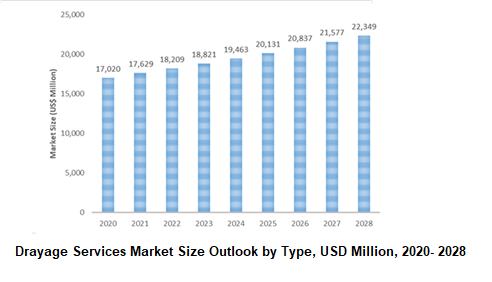
The global Drayage Services Market Size stood at US$18.2 Billion in 2022 and is poised to register 3.45% growth over the forecast period from 2024 to 2032. Key market driving forces include strong demand from end-user industries, rapid industrialization in emerging markets, growing adoption of e-Commerce business, the rise of global trade volumes, potential investments in technology upgrade of Drayage Services, market recovery from COVID-19 conditions, and consumer preference for expedited delivery services are identified among main market dynamics
Drayage Services Market Analysis
The drayage services market is quickly gaining prominence in the shipping and logistics industry. Different drayage services such as expedited services, movement of goods between different carriers, intra-carrier drayage, pier drayage, shuttle, and door-to-door drayage services continue to gain wide acceptance among consumers, driving the market outlook. The strong growth potential of the services industry is encouraging the foray of a large number of small-scale players focusing on lowering costs, expediting the process, and offering world-class customer support.
The market growth is driven by the positive influence of e-commerce industry growth, technological advancements, continued trade and economic development, business expansion in developing countries, and wide applications adopting drayage services. On the other hand, challenges associated with the negative impact of COVID-19 conditions led to the bankruptcy of several small carriers, fluctuating drayage service costs, and operational challenges restricted market growth.
The global Drayage Services market is valued at around USD 17 billion and is characterized by a large number of small- and large-scale players operating in the market. Further, the demand for Drayage Services continues to remain strong over the forecast period.
Global Drayage Services Market Size Outlook, 2022-2028
Market Dynamics
Market Trend- Strong growth in e-commerce business fuels the demand for drayage services
E-commerce is one of the rapidly growing segments worldwide, with an estimated 15% to 18% growth being registered every year. As customers increasingly get habituated to procure from online marketplaces, aggressive promotion activities of online retailers, and offering supportive services, the industry is gaining wide attraction. In particular, the COVID-19 conditions led to increased sales through e-commerce channels, with most regions registering growth rates almost double that of previous years. Non-store retailing, electronics, clothing, textiles, footwear, department stores, food, and other segments remain leading products procured through e-commerce channels.
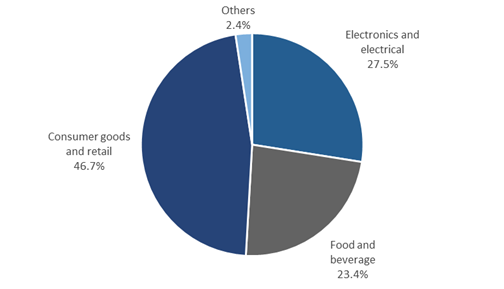
In particular, cross-border trade is increasing rapidly worldwide. For instance, the online cross-border market value in Europe is valued at over 150 billion Euros. The UK, Germany, France, Spain, the Netherlands, and other countries are registering rapid growth in the region. Similarly, cross-border e-commerce has gained a large momentum in the Americas, Asia/Oceania, and other regions. The US, China, India, Russia, and other countries are rapidly witnessing momentum in cross-border e-commerce business. The high population coupled with increasing affordability, use of the internet, and rapid penetration of smartphones support the market growth. With growing e-commerce services, we anticipate the market for drayage services will increase rapidly. Among different products marketed worldwide, electronics and consumer goods are largely witnessing demand for drayage services.
Market Driver- Technology advancements in the drayage services market
Ongoing investments in the drayage services market are encouraging technological advancements in the drayage services industry. Technological developments in areas of visibility, execution, on-demand facilities and solutions, pickup efficiency, and use of advanced software services such as software-as-a-service (SaaS) drayage platforms are identified.
Further, improved connectivity, efficient management of blocking-and-tackling drayage services, better data management, promote transparency in operations for trucking companies, freight forwarders, brokers, consumers, and others through advanced platforms and other developments are being focused.
New technologies such as the Internet of Things (IoT), cloud computing, automation, and data analytics are being incorporated into the industry. In addition, the use of artificial intelligence to forecast demand conditions, optimization of supply chains, inventory management, shipping accuracy, customer management, efficient transport management system, and others is being observed.
Venture capitalists, small investors, and others are largely investing in the drayage services industry. Embracing the digital revolution, and switching to automation remains the main focus of most start-up companies and investors. Shipping line bookings, optimization, and tracking loads, with intelligent transport management and port management, are also identified as key investment areas.
Market Segmentation
The global Drayage Services Market is segmented into Types, Applications, and Countries.
Inter-carrier drayage services are the largest type of Drayage Services in 2022
Trucks transfer cargo from carrier to carrier. Intercarrier drayage involves trucks, railways, and others for the movement of containers between locations. However, this requires efficient communications and planning as the container movement from rail to sea, rail to rail, or sea to rail or between carriers is involved. Delivery to long-haul trucking companies is also involved. With a growing e-commerce business, inter-carrier drayage is witnessing strong demand. We expect the market segment to register 3.6% growth over the forecast period.
The consumer goods and retail segment is growing at the highest CAGR during the forecast period
Day-to-day products with regular restoration and widely used across locations, which is encouraging large e-Commerce companies to set up regional warehouses for quick delivery of consumer goods and retail products to consumers. An increasing volume of cargo is directly shipped to these regional warehouses to ensure uninterrupted and efficient supply to consumers. These improvements will significantly support drayage services. Further, drayage carriers from ports to the regional hubs are also witnessing significant demand growth. Door-to-Door drayage services are also widely observed in the industry, as manufacturers promote delivery to end users to stay ahead of the competition.
Seasonality also plays an important role in the transport of consumer goods and accordingly, efficient delivery plays a vital role in overall sales. The cost of transportation and logistics varies from region to region, which can result in varying costs for consumers.
Offering an excellent level of customer service on flexible budgets is one of the key strategies opted for by drayage service providers. Further, companies with expedited shipping capabilities, track and trace options, and transparency are likely to gain more business in the industry segment.
Asia Pacific accounts for the highest market size for the period 2023 to 2030
Driven by large trade volume and growth in e-Commerce, Asia Pacific dominates the global Drayage Services market. China dominates the Asia Pacific Drayage Services Market. Manufacturing companies are constantly expanding their production capacity. Low cost of production and proximity to major consuming countries are encouraging global majors to set up their manufacturing units in China.
Cross-border e-commerce business growth is one of the largest market drivers coupled with rapid economic growth and globalization trends. Most small and medium-scale companies are setting up their operations at the ports driven by huge market potential.
During the pandemic, most of the transportation activities halted in China. Problems associated with a shortage of drivers, drayage costs increased by around 30%, labor availability, and other challenges were observed in the industry. Airfreight, ocean freight & ports also suffered significant business decline due to the restricted movement of freight into and out of China during the pandemic.
Segmentation
By Type
By Application
By Region
Key Players
Leading companies profiled in the study include-
Drayage Services Market Outlook 2023
1 Market Overview
1.1 Introduction to Drayage Services Market
1.2 Scope of the Study
1.3 Research Objective
1.3.1 Key Market Scope and Segments
1.3.2 Players Covered
1.3.3 Years Considered
2 Executive Summary
2.1 2023 Drayage Services Industry- Market Statistics
3 Market Dynamics
3.1 Market Drivers
3.2 Market Challenges
3.3 Market Opportunities
3.4 Market Trends
4 Market Factor Analysis
4.1 Porter’s Five Forces
4.2 Market Entropy
4.2.1 Global Drayage Services Market Companies with Area Served
4.2.2 Products Offerings Global Drayage Services Market
5 COVID-19 Impact Analysis and Outlook Scenarios
5.1.1 Covid-19 Impact Analysis
5.1.2 Post-COVID-19 Scenario- Low Growth Case
5.1.3 Post-COVID-19 Scenario- Reference Growth Case
5.1.4 Post-COVID-19 Scenario- Low Growth Case
6 Global Drayage Services Market Trends
6.1 Global Drayage Services Revenue (USD Million) and CAGR (%) by Type (2018-2028)
6.2 Global Drayage Services Revenue (USD Million) and CAGR (%) by Applications (2018-2028)
6.3 Global Drayage Services Revenue (USD Million) and CAGR (%) by Regions (2018-2028)
7 Global Drayage Services Market Revenue (USD Million) by Type, and Applications (2018-2022)
7.1 Global Drayage Services Revenue (USD Million) by Type (2018-2022)
7.1.1 Global Drayage Services Revenue (USD Million), Market Share (%) by Type (2018-2022)
7.2 Global Drayage Services Revenue (USD Million) by Applications (2018-2022)
7.2.1 Global Drayage Services Revenue (USD Million), Market Share (%) by Applications (2018-2022)
8 Global Drayage Services Development Regional Status and Outlook
8.1 Global Drayage Services Revenue (USD Million) By Regions (2018-2022)
8.2 North America Drayage Services Revenue (USD Million) by Type, and Application (2018-2022)
8.2.1 North America Drayage Services Revenue (USD Million) by Country (2018-2022)
8.2.2 North America Drayage Services Revenue (USD Million) by Type (2018-2022)
8.2.3 North America Drayage Services Revenue (USD Million) by Applications (2018-2022)
8.3 Europe Drayage Services Revenue (USD Million), by Type, and Applications (USD Million) (2018-2022)
8.3.1 Europe Drayage Services Revenue (USD Million), by Country (2018-2022)
8.3.2 Europe Drayage Services Revenue (USD Million) by Type (2018-2022)
8.3.3 Europe Drayage Services Revenue (USD Million) by Applications (2018-2022)
8.4 Asia Pacific Drayage Services Revenue (USD Million), and Revenue (USD Million) by Type, and Applications (2018-2022)
8.4.1 Asia Pacific Drayage Services Revenue (USD Million) by Country (2018-2022)
8.4.2 Asia Pacific Drayage Services Revenue (USD Million) by Type (2018-2022)
8.4.3 Asia Pacific Drayage Services Revenue (USD Million) by Applications (2018-2022)
8.5 South America Drayage Services Revenue (USD Million), by Type, and Applications (2018-2022)
8.5.1 South America Drayage Services Revenue (USD Million), by Country (2018-2022)
8.5.2 South America Drayage Services Revenue (USD Million) by Type (2018-2022)
8.5.3 South America Drayage Services Revenue (USD Million) by Applications (2018-2022)
8.6 Middle East and Africa Drayage Services Revenue (USD Million), by Type, Technology, Application, Thickness (2018-2022)
8.6.1 Middle East and Africa Drayage Services Revenue (USD Million) by Country (2018-2022)
8.6.2 Middle East and Africa Drayage Services Revenue (USD Million) by Type (2018-2022)
8.6.3 Middle East and Africa Drayage Services Revenue (USD Million) by Applications (2018-2022)
9 Company Profiles
10 Global Drayage Services Market Revenue (USD Million), by Type, and Applications (2023-2028)
10.1 Global Drayage Services Revenue (USD Million) and Market Share (%) by Type (2023-2028)
10.1.1 Global Drayage Services Revenue (USD Million), and Market Share (%) by Type (2023-2028)
10.2 Global Drayage Services Revenue (USD Million) and Market Share (%) by Applications (2023-2028)
10.2.1 Global Drayage Services Revenue (USD Million), and Market Share (%) by Applications (2023-2028)
11 Global Drayage Services Development Regional Status and Outlook Forecast
11.1 Global Drayage Services Revenue (USD Million) By Regions (2023-2028)
11.2 North America Drayage Services Revenue (USD Million) by Type, and Applications (2023-2028)
11.2.1 North America Drayage Services Revenue (USD) Million by Country (2023-2028)
11.2.2 North America Drayage Services Revenue (USD Million), by Type (2023-2028)
11.2.3 North America Drayage Services Revenue (USD Million), Market Share (%) by Applications (2023-2028)
11.3 Europe Drayage Services Revenue (USD Million), by Type, and Applications (2023-2028)
11.3.1 Europe Drayage Services Revenue (USD Million), by Country (2023-2028)
11.3.2 Europe Drayage Services Revenue (USD Million), by Type (2023-2028)
11.3.3 Europe Drayage Services Revenue (USD Million), by Applications (2023-2028)
11.4 Asia Pacific Drayage Services Revenue (USD Million) by Type, and Applications (2023-2028)
11.4.1 Asia Pacific Drayage Services Revenue (USD Million), by Country (2023-2028)
11.4.2 Asia Pacific Drayage Services Revenue (USD Million), by Type (2023-2028)
11.4.3 Asia Pacific Drayage Services Revenue (USD Million), by Applications (2023-2028)
11.5 South America Drayage Services Revenue (USD Million), by Type, and Applications (2023-2028)
11.5.1 South America Drayage Services Revenue (USD Million), by Country (2023-2028)
11.5.2 South America Drayage Services Revenue (USD Million), by Type (2023-2028)
11.5.3 South America Drayage Services Revenue (USD Million), by Applications (2023-2028)
11.6 Middle East and Africa Drayage Services Revenue (USD Million), by Type, and Applications (2023-2028)
11.6.1 Middle East and Africa Drayage Services Revenue (USD Million), by Region (2023-2028)
11.6.2 Middle East and Africa Drayage Services Revenue (USD Million), by Type (2023-2028)
11.6.3 Middle East and Africa Drayage Services Revenue (USD Million), by Applications (2023-2028)
12 Methodology and Data Sources
12.1 Methodology/Research Approach
12.1.1 Research Programs/Design
12.1.2 Market Size Estimation
12.1.3 Market Breakdown and Data Triangulation
12.2 Data Sources
12.2.1 Secondary Sources
12.2.2 Primary Sources
12.3 Disclaimer
List Of Tables
Table 1 Market Segmentation Analysis
Table 2 Global Drayage Services Market Companies with Areas Served
Table 3 Products Offerings Global Drayage Services Market
Table 4 Low Growth Scenario Forecasts
Table 5 Reference Case Growth Scenario
Table 6 High Growth Case Scenario
Table 7 Global Drayage Services Revenue (USD Million) And CAGR (%) By Type (2018-2028)
Table 8 Global Drayage Services Revenue (USD Million) And CAGR (%) By Applications (2018-2028)
Table 9 Global Drayage Services Revenue (USD Million) And CAGR (%) By Regions (2018-2028)
Table 10 Global Drayage Services Revenue (USD Million) By Type (2018-2022)
Table 11 Global Drayage Services Revenue Market Share (%) By Type (2018-2022)
Table 12 Global Drayage Services Revenue (USD Million) By Applications (2018-2022)
Table 13 Global Drayage Services Revenue Market Share (%) By Applications (2018-2022)
Table 14 Global Drayage Services Market Revenue (USD Million) By Regions (2018-2022)
Table 15 Global Drayage Services Market Share (%) By Regions (2018-2022)
Table 16 North America Drayage Services Revenue (USD Million) By Country (2018-2022)
Table 17 North America Drayage Services Revenue (USD Million) By Type (2018-2022)
Table 18 North America Drayage Services Revenue (USD Million) By Applications (2018-2022)
Table 19 Europe Drayage Services Revenue (USD Million) By Country (2018-2022)
Table 20 Europe Drayage Services Revenue (USD Million) By Type (2018-2022)
Table 21 Europe Drayage Services Revenue (USD Million) By Applications (2018-2022)
Table 22 Asia Pacific Drayage Services Revenue (USD Million) By Country (2018-2022)
Table 23 Asia Pacific Drayage Services Revenue (USD Million) By Type (2018-2022)
Table 24 Asia Pacific Drayage Services Revenue (USD Million) By Applications (2018-2022)
Table 25 South America Drayage Services Revenue (USD Million) By Country (2018-2022)
Table 26 South America Drayage Services Revenue (USD Million) By Type (2018-2022)
Table 27 South America Drayage Services Revenue (USD Million) By Applications (2018-2022)
Table 28 Middle East and Africa Drayage Services Revenue (USD Million) By Region (2018-2022)
Table 29 Middle East and Africa Drayage Services Revenue (USD Million) By Type (2018-2022)
Table 30 Middle East and Africa Drayage Services Revenue (USD Million) By Applications (2018-2022)
Table 31 Financial Analysis
Table 32 Global Drayage Services Revenue (USD Million) By Type (2023-2028)
Table 33 Global Drayage Services Revenue Market Share (%) By Type (2023-2028)
Table 34 Global Drayage Services Revenue (USD Million) By Applications (2023-2028)
Table 35 Global Drayage Services Revenue Market Share (%) By Applications (2023-2028)
Table 36 Global Drayage Services Market Revenue (USD Million), And Revenue (USD Million) By Regions (2023-2028)
Table 37 North America Drayage Services Revenue (USD)By Country (2023-2028)
Table 38 North America Drayage Services Revenue (USD Million) By Type (2023-2028)
Table 39 North America Drayage Services Revenue (USD Million) By Applications (2023-2028)
Table 40 Europe Drayage Services Revenue (USD Million) By Country (2023-2028)
Table 41 Europe Drayage Services Revenue (USD Million) By Type (2023-2028)
Table 42 Europe Drayage Services Revenue (USD Million) By Applications (2023-2028)
Table 43 Asia Pacific Drayage Services Revenue (USD Million) By Country (2023-2028)
Table 44 Asia Pacific Drayage Services Revenue (USD Million) By Type (2023-2028)
Table 45 Asia Pacific Drayage Services Revenue (USD Million) By Applications (2023-2028)
Table 46 South America Drayage Services Revenue (USD Million) By Country (2023-2028)
Table 47 South America Drayage Services Revenue (USD Million) By Type (2023-2028)
Table 48 South America Drayage Services Revenue (USD Million) By Applications (2023-2028)
Table 49 Middle East and Africa Drayage Services Revenue (USD Million) By Region (2023-2028)
Table 50 Middle East and Africa Drayage Services Revenue (USD Million) By Region (2023-2028)
Table 51 Middle East and Africa Drayage Services Revenue (USD Million) By Type (2023-2028)
Table 52 Middle East and Africa Drayage Services Revenue (USD Million) By Applications (2023-2028)
Table 53 Research Programs/Design for This Report
Table 54 Key Data Information from Secondary Sources
Table 55 Key Data Information from Primary Sources
List Of Figures
Figure 1 Market Scope
Figure 2 Porter’s Five Forces
Figure 3 Global Drayage Services Revenue (USD Million) By Type (2018-2022)
Figure 4 Global Drayage Services Revenue Market Share (%) By Type (2022)
Figure 5 Global Drayage Services Revenue (USD Million) By Applications (2018-2022)
Figure 6 Global Drayage Services Revenue Market Share (%) By Applications (2022)
Figure 7 Global Drayage Services Market Revenue (USD Million) By Regions (2018-2022)
Figure 8 Global Drayage Services Market Share (%) By Regions (2022)
Figure 9 North America Drayage Services Revenue (USD Million) By Country (2018-2022)
Figure 10 North America Drayage Services Revenue (USD Million) By Type (2018-2022)
Figure 11 North America Drayage Services Revenue (USD Million) By Applications (2018-2022)
Figure 12 Europe Drayage Services Revenue (USD Million) By Country (2018-2022)
Figure 13 Europe Drayage Services Revenue (USD Million) By Type (2018-2022)
Figure 14 Europe Drayage Services Revenue (USD Million) By Applications (2018-2022)
Figure 15 Asia Pacific Drayage Services Revenue (USD Million) By Country (2018-2022)
Figure 16 Asia Pacific Drayage Services Revenue (USD Million) By Type (2018-2022)
Figure 17 Asia Pacific Drayage Services Revenue (USD Million) By Applications (2018-2022)
Figure 18 South America Drayage Services Revenue (USD Million) By Country (2018-2022)
Figure 19 South America Drayage Services Revenue (USD Million) By Type (2018-2022)
Figure 20 South America Drayage Services Revenue (USD Million) By Applications (2018-2022)
Figure 21 Middle East and Africa Drayage Services Revenue (USD Million) By Region (2018-2022)
Figure 22 Middle East and Africa Drayage Services Revenue (USD Million) By Type (2018-2022)
Figure 23 Middle East and Africa Drayage Services Revenue (USD Million) By Applications (2018-2022)
Figure 24 Global Drayage Services Revenue (USD Million) By Type (2023-2028)
Figure 25 Global Drayage Services Revenue Market Share (%) By Type (2028)
Figure 26 Global Drayage Services Revenue (USD Million) By Applications (2023-2028)
Figure 27 Global Drayage Services Revenue Market Share (%) By Applications (2028)
Figure 28 Global Drayage Services Market Revenue (USD Million) By Regions (2023-2028)
Figure 29 North America Drayage Services Revenue (USD Million) By Country (2023-2028)
Figure 30 North America Drayage Services Revenue (USD Million) By Type (2023-2028)
Figure 31 North America Drayage Services Revenue (USD Million) By Applications (2023-2028)
Figure 32 Europe Drayage Services Revenue (USD Million) By Country (2023-2028)
Figure 33 Europe Drayage Services Revenue (USD Million) By Type (2023-2028)
Figure 34 Europe Drayage Services Revenue (USD Million) By Applications (2023-2028)
Figure 35 Asia Pacific Drayage Services Revenue (USD Million) By Country (2023-2028)
Figure 36 Asia Pacific Drayage Services Revenue (USD Million) By Type (2023-2028)
Figure 37 Asia Pacific Drayage Services Revenue (USD Million) By Applications (2023-2028)
Figure 38 South America Drayage Services Revenue (USD Million) By Country (2023-2028)
Figure 39 South America Drayage Services Revenue (USD Million) By Type (2023-2028)
Figure 40 South America Drayage Services Revenue (USD Million) By Applications (2023-2028)
Figure 41 Middle East and Africa Drayage Services Revenue (USD Million) By Region (2023-2028)
Figure 42 Middle East and Africa Drayage Services Revenue (USD Million) By Region (2023-2028)
Figure 43 Middle East and Africa Drayage Services Revenue (USD Million) By Type (2023-2028)
Figure 44 Middle East and Africa Drayage Services Revenue (USD Million) By Applications (2023-2028)
Figure 45 Bottom-Up and Top-Down Approaches For This Report
Figure 46 Data Triangulation
By Type
By Application
By Region
The global Drayage Services Market Size stood at US$18.2 Billion in 2022.
The market is poised to register 3.45% growth over the forecast period from 2023 to 2030
J.B. Hunt Transport Services, Inc., Hub Group, Inc., Schneider National, Inc., XPO Logistics, Inc., Knight-Swift Transportation Holdings, Inc., RoadOne IntermodaLogistics Inc., PLS Logistics, Boa Logistics LLC, Evans Delivery Co. Inc., ITS Technologies and Logistics LLC
Inter-carrier drayage, Consumer goods and retail, and Asia Pacific are the fastest-growing segments in the market.