Market Expansion and Value Proposition: Engineered Wood Industry Drives Sustainable Construction Growth
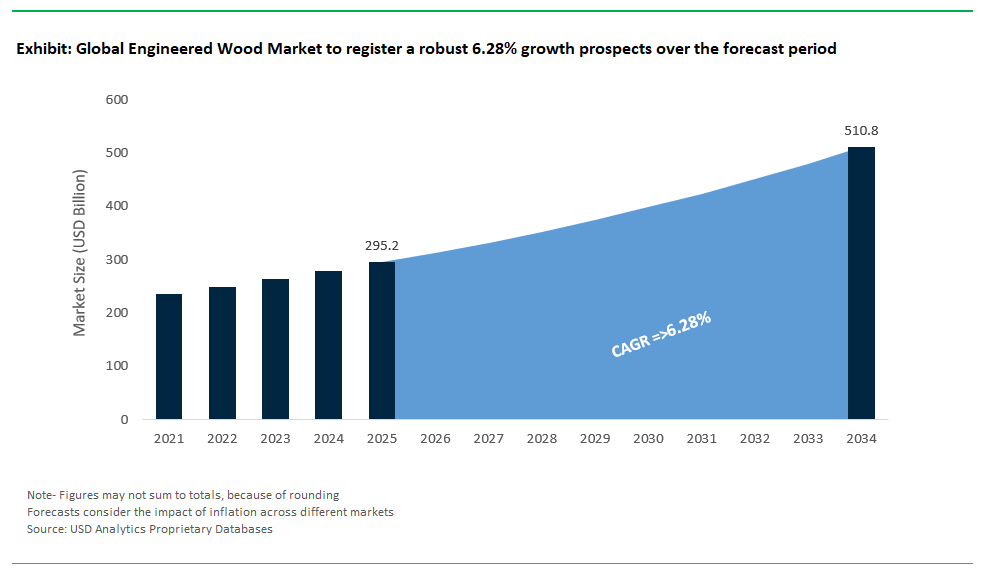
The global engineered wood market is on a transformative growth path, with market value projected to rise from $295.2 billion in 2025 to $510.7 billion by 2034, representing a strong CAGR of 6.28%. This dynamic expansion reflects the sector’s pivotal role in reshaping the construction industry through advanced, high-performance, and sustainable alternatives to traditional lumber. As worldwide demand for efficient, cost-effective, and eco-friendly building materials accelerates, engineered wood products (EWPs) ranging from plywood and OSB to cross-laminated timber (CLT) and glulam are at the forefront of innovation and sustainability in modern construction.
Engineered wood products are manufactured by bonding wood fibers, veneers, or strands with adhesives under heat and pressure, yielding materials that outperform solid wood in strength, dimensional stability, and resource efficiency. The spectrum of EWPs includes plywood, oriented strand board (OSB), laminated veneer lumber (LVL), glulam, and cross-laminated timber (CLT), as well as particleboard and medium-density fiberboard (MDF) for interior applications. These materials have become essential across construction, furniture, flooring, and packaging industries. Their inherent advantages higher strength-to-weight ratios, consistent quality, efficient use of timber, and reduced waste position engineered wood as the material of choice for a new era of sustainable building, green architecture, and industrial design.
Strategic Developments and Technological Advancements Accelerate Engineered Wood Market Momentum
The engineered wood industry is undergoing rapid transformation, propelled by strategic investments, breakthrough innovations, and an intensified focus on sustainability and automation. In July 2025, EcoSynthetix secured a second purchase order for SurfLock™, a bio-based strength aid for pulp and packaging, illustrating the industry’s broader transition toward sustainable, formaldehyde-free binders for wood composites. This shift is crucial for reducing reliance on hazardous chemicals and aligning products with green building mandates.
Meanwhile, West Fraser Timber’s July 2025 quarterly results reflect the cyclical nature of the North American EWP sector, with Q2-25 showing softer demand amid a slowdown in U.S. new home construction. However, the company’s commitment to ongoing reliability and capital improvement highlights the industry’s focus on operational optimization and resilience during market fluctuations.
Sustainability remains a powerful growth driver, as the July 2025 market outlook forecasts the global engineered wood market reaching $427.3 billion by 2033, led by robust demand for green building, affordable homes, and reconstruction projects. In May 2025, adhesive manufacturers announced new generations of formaldehyde-free and low-VOC adhesives specifically for EWPs addressing stricter environmental regulations and the growing consumer demand for healthier indoor air quality in both residential and commercial buildings.
Investment in mass timber production is also accelerating. April 2025 saw significant European expansion of CLT production facilities, reflecting soaring demand for mid-rise and high-rise timber construction in Austria, Germany, and the Nordics. The digitalization of manufacturing (March 2025) is also reshaping the sector, with AI-driven optimization and robotic automation enhancing efficiency, reducing waste, and ensuring precise, consistent product quality. Innovative hybrid wood products and offsite manufacturing techniques (January–February 2025) further expand the application scope of engineered wood, offering new solutions for modular, prefabricated, and mass timber construction. Increased certification and responsible sourcing (October 2024) round out the strategic focus, with major producers prioritizing sustainable timber and adhering to FSC and PEFC standards.
Trends and Opportunities: Mass Timber, Modular Construction, and the Evolution of Engineered Wood Applications
Rapid Growth of Mass Timber in Mid- and High-Rise Construction
A transformative trend in the engineered wood market is the rapid adoption of mass timber especially cross-laminated timber (CLT) and glulam for mid-rise and high-rise buildings. This shift is driven by the urgent need for sustainable construction materials, mass timber’s unique structural and environmental benefits, and evolving building codes that now permit taller timber buildings. Mass timber structures offer lower embodied carbon, excellent strength-to-weight ratios, and align with net-zero and biophilic design principles. Advances in fire resistance, seismic performance, and connection technologies now enable CLT and glulam to compete directly with concrete and steel in demanding urban projects.
Recent examples include the completion of mass timber high-rises such as Brock Commons in Vancouver, HoHo Wien in Vienna, and Ascent in Milwaukee. Government-backed programs in Canada, Europe, and the Nordics supported by research, regulatory reviews, and sustainability initiatives are further accelerating mass timber adoption. The long-term market impact will be a surge in investment in CLT and glulam production capacity, expanded architectural collaboration, and a fundamental shift toward sustainable, timber-rich skylines worldwide.
Surging Demand for Engineered Wood in Prefabricated and Modular Construction
The rise of prefabricated and modular construction presents a game-changing opportunity for engineered wood manufacturers. These offsite building techniques where components are fabricated in controlled factory environments dramatically reduce project timelines, optimize resource use, and improve quality control. Engineered wood products such as LVL, OSB, and CLT are ideally suited for modular construction, thanks to their dimensional stability, consistency, and compatibility with robotic assembly lines and BIM modeling.
In countries like Sweden and Finland, modular timber construction has a rich legacy, with government programs facilitating rapid housing deployment (e.g., Sweden’s Million Homes Programme). Today, global prefab housing, modular hotels, and student accommodation increasingly rely on engineered wood panels and framing. The result is less waste, higher quality, improved labor efficiency, and cost-effective solutions for affordable and remote-area housing. This trend will drive deeper partnerships between EWP producers and modular builders, foster innovation in design-for-assembly, and position engineered wood at the heart of the next generation of efficient, sustainable construction.
Competitive Landscape: Key Players Shaping the Future of the Engineered Wood Industry
The global engineered wood market is defined by the leadership and innovation of major integrated forest product companies and specialized manufacturers.
Weyerhaeuser Company: Integrated Timberland Management and Engineered Wood Leadership
Weyerhaeuser leverages vast timberland assets and a vertically integrated business model to produce a comprehensive array of EWPs, including TimberStrand® LVL and Trus Joist® TJI® joists. The company’s ongoing mill investments and optimization strategies ensure supply reliability and product innovation, underpinning its position as a cornerstone of sustainable wood construction in North America.
Boise Cascade Company: Advanced Manufacturing and Robust Distribution
Boise Cascade stands out for its extensive range of EWPs including BCTM LVL, I-joists, and Versa-Lam® and strong distribution network, serving both residential and commercial markets. Strategic investments in new technologies and performance-driven solutions keep the company at the forefront of high-strength, sustainable framing systems.
Louisiana-Pacific Corporation (LP): Innovation in OSB, Siding, and Sustainable Practices
LP is recognized for high-performance OSB, engineered wood siding, and LVL solutions, with a robust focus on innovation, sustainability, and ease of installation. The company’s LP® SmartSide® products are renowned for their durability and environmental credentials, aligning with the shift toward smart, green building materials.
West Fraser Timber Co. Ltd.: Diversified Wood Products and Operational Excellence
West Fraser is a global leader in plywood, OSB, and LVL, backed by extensive timberland and a diversified product portfolio. Despite market fluctuations, the company is dedicated to continuous improvement and capital investment, ensuring operational efficiency and a strong commitment to sustainable forest management.
Celulosa Arauco y Constitución S.A. (Arauco): Global Expansion and Mass Timber Solutions
Arauco’s integrated operations from forest plantations to finished products position it as a key supplier of plywood, MDF, particleboard, and emerging mass timber solutions across the Americas and beyond. Ongoing investments in manufacturing capacity and sustainable product development underpin its global growth strategy.
Georgia-Pacific LLC: Building Product Innovation and Supply Chain Resilience
Georgia-Pacific is a major supplier of plywood and OSB panels, leveraging advanced manufacturing and a robust logistics network to deliver high-quality wood-based materials to diverse construction markets. The company’s focus on continuous product innovation and supply chain optimization supports its strong industry presence.
Binderholz GmbH: Mass Timber and Sustainable Processing Excellence
Binderholz is a European leader in CLT and glulam, renowned for its commitment to sustainable forestry and precision manufacturing. The company’s integrated timber processing capabilities and turnkey timber construction systems support the growing adoption of mass timber in large-scale projects across Europe and globally.
Stora Enso Oyj: Circular Bioeconomy and Renewable Mass Timber Products
Stora Enso is at the vanguard of the renewable materials sector, with a significant portfolio of mass timber products (CLT, LVL) and a strategic focus on circular bioeconomy principles. The company’s R&D investments drive the evolution of high-performance, low-carbon building materials for multi-story construction, underpinned by stringent environmental and sourcing standards.
Engineered Wood Market Share Analysis: Key Segment Insights for 2025
By Product Type: Plywood and OSB Lead the Engineered Wood Industry in 2025
Plywood maintains its lead in the global engineered wood market, capturing 30% of total market share in 2025. This dominance is owed to plywood’s unrivaled versatility, structural strength, and adaptability across construction, furniture, and flooring segments. Plywood’s multilayered veneer composition provides reliable performance for both load-bearing and decorative applications, ensuring high demand in markets emphasizing durability and quality. In parallel, Oriented Strand Board (OSB) secures a fast-rising 25% share especially strong in North America where it’s become the preferred, cost-effective alternative to plywood for sheathing and roofing. OSB’s engineered strand layers offer uniformity, moisture resistance, and scalable production for residential and commercial buildings.
Other engineered wood products continue to show sectoral strength. Medium Density Fiberboard (MDF) and particleboard have emerged as mainstays in the global furniture industry, prized for their smooth surfaces, machining properties, and affordability enabling the rise of modular, ready-to-assemble furniture across Asia-Pacific and beyond. Laminated Veneer Lumber (LVL), Cross-Laminated Timber (CLT), and Glued Laminated Timber (Glulam) represent the mass timber segment, gaining ground in sustainable, mid- and high-rise construction. Though currently niche due to higher material and engineering costs, these mass timber products are rapidly expanding their footprint as governments incentivize low-carbon building methods and architects seek advanced structural solutions.
By Application: Construction Dominates, Furniture Manufacturing Remains Critical
Construction is the dominant application, commanding 45% of the engineered wood market share in 2025. This reflects the global shift toward sustainable, prefabricated, and efficient building practices in both residential and commercial segments. Engineered wood is now central to the construction of single-family homes, multifamily units, commercial spaces, and even tall timber buildings driven by evolving building codes, green incentives, and urbanization across North America, Europe, and Asia Pacific. Key construction applications include framing (I-joists, LVL), sheathing (OSB, plywood), and exterior siding.
Furniture manufacturing is the second largest segment at 30%, propelled by rapid urbanization, rising disposable incomes, and the growing appetite for affordable, customizable furniture solutions worldwide. MDF and particleboard are foundational for this segment, enabling intricate designs, smooth finishes, and cost-effective manufacturing for global brands. Flooring, while a smaller share, is an emerging growth engine due to the rising popularity of engineered hardwoods that combine durability, aesthetic appeal, and environmental sustainability. Packaging (pallets, crates) and other industrial uses remain steady contributors, highlighting engineered wood’s value for supply chain logistics and manufacturing support worldwide.
.png)
United States: Mass Timber Momentum and Resilient Market Dynamics
The United States is a front-runner in mass timber adoption and engineered wood innovation. Recent years have seen a surge in CLT and Glulam projects for commercial and multi-family residential buildings, underpinned by supportive building codes and an industry-wide shift toward low-carbon construction. The nation’s extensive production network, anchored by companies like Weyerhaeuser, Boise Cascade, and LP, continues to expand into new mass timber facilities and R&D initiatives, such as AI-designed materials and advanced resins.
Despite recent softening in new home construction impacting demand for North American EWPs in early 2025, the overall market remains resilient. Investment in affordable housing, reconstruction, and renovation is buoying demand, while USDA-backed initiatives support innovation in sustainable wood products. The U.S. market remains strong in structural framing, sheathing, and siding, with robust demand in both private and public sector building projects.
China: Construction Boom and Manufacturing Scale Drive Global Demand
China stands at the epicenter of engineered wood demand and supply, propelled by massive urbanization, a thriving construction sector, and targeted government support for timber-based building. National policies promoting timber use to reduce carbon emissions are accelerating EWP adoption across the country. At the same time, China’s significant investment in state-of-the-art manufacturing facilities has positioned it as both a major global producer and consumer of engineered wood products.
Chinese demand is fueled by the widespread use of engineered wood in residential high-rises, commercial complexes, and a booming furniture industry. The government’s push for sustainable development and rapid adoption of modern construction technologies is enhancing product quality and production efficiency. As a major importer of raw timber and exporter of finished engineered wood, China’s supply chain integration is setting new global standards in scalability and market responsiveness.
Canada: Sustainable Forestry and Mass Timber Innovation
Canada is globally recognized for its sustainable forestry practices, providing a certified and reliable source of timber for EWP production. The country is at the cutting edge of mass timber construction, with provinces like British Columbia and Quebec pioneering landmark mid- and high-rise buildings made from CLT and glulam. Government programs since 2006 have driven investment in wood innovation labs, updated building codes for taller timber structures, and incentivized wood use in public buildings.
Academic-industry collaboration continues to advance engineered wood science, with companies like West Fraser Timber and Tolko Industries leading product innovation and export. As global demand for green building materials rises, Canada’s strong regulatory framework and continuous R&D investment ensure it remains a leader in both technology and sustainable market growth.
Germany: Engineered Wood Technology and Green Building Leadership
Germany is a technological leader in engineered wood manufacturing, especially in precision production and product innovation for CLT and glulam. With strict environmental regulations and building codes, the market prioritizes energy-efficient and eco-friendly wood solutions for both residential and commercial construction. Germany’s R&D strength is evident in cutting-edge wood composites, adhesives, and construction systems that continually raise industry standards.
The market is well-diversified, with widespread adoption of engineered wood in prefabricated homes, multi-story timber buildings, and large-scale public projects. Germany’s robust manufacturing base and export focus reinforce its global influence, as local players set benchmarks for quality, safety, and sustainability in engineered wood.
Austria: Mass Timber Pioneer and Export Powerhouse
Austria is internationally renowned as a pioneer in mass timber and CLT, with a highly integrated timber industry spanning sustainable forestry through advanced EWP manufacturing. The country is home to several world-renowned manufacturers, architects, and academic institutions dedicated to wood science and continuous innovation. Austrian-engineered wood is extensively used in landmark high-rise timber structures for residential, commercial, and public applications.
Austria’s export-oriented industry supplies high-quality engineered wood products across Europe and beyond, benefiting from a strong ecosystem of research, education, and government support. The country’s leadership in timber design and prefabrication ensures it remains at the forefront of the mass timber revolution.
Japan: Seismic Expertise and Tradition Meet Modern Engineering
Japan leverages deep expertise in seismic design for timber structures, making engineered wood an increasingly attractive option in earthquake-prone regions. LVL, glulam, and OSB panels are tailored for high performance in both traditional and modern building systems. The fusion of Japan’s cultural affinity for wood with advanced engineering is resulting in innovative applications in residential, public, and internal fit-outs.
With growing interest in sustainable construction and carbon reduction, Japanese manufacturers are focusing on locally sourced, engineered wood products. Strong R&D and a robust domestic market for prefabricated timber structures further solidify Japan’s reputation as a leader in engineered wood technology for both domestic use and global influence.
Finland: Forestry, Bioeconomy, and Prefabrication Expertise
Finland boasts a forest-rich landscape and a bio-based economy, positioning itself as a leader in wood innovation and digitalized timber solutions. The country’s long-standing experience in prefabricated and modular wood construction enables highly efficient building processes using advanced EWP components. Finnish government policies actively promote wood in construction, and strong research links drive continuous product innovation.
Finland’s engineered wood products see significant use in residential, public, and industrial buildings, with a focus on energy efficiency and lifecycle performance. As demand for climate-smart construction rises, Finland’s expertise in sustainable forestry and product development is increasingly sought after in global markets.
Sweden: Modular Construction and Sustainable Growth
Sweden has a rich legacy in modular and large-scale timber construction, supported by government programs and partnerships between academia and industry. The nation’s deep commitment to carbon reduction and sustainable building practices drives high EWP usage in residential, educational, and public infrastructure. CLT, glulam, and LVL are central to multi-story projects and schools, reflecting Sweden’s leadership in both technical performance and environmental stewardship.
Exemplary sustainable forest management ensures a consistent supply of raw materials, while ongoing R&D and collaborative innovation keep Sweden at the cutting edge of engineered wood technology. Sweden’s forward-looking approach sets a model for scalable, sustainable growth in the global EWP market.
Engineered Wood Market Report Scope
Engineered Wood Market
|
Parameter
|
Details
|
|
Market Size (2025)
|
$295.2 Billion
|
|
Market Size (2034)
|
$510.7 Billion
|
|
Market Growth Rate
|
6.28%
|
|
Segments
|
By Product Type (Plywood, Oriented Strand Board (OSB), Glued Laminated Timber (Glulam), Laminated Veneer Lumber (LVL), Cross-Laminated Timber (CLT), Particleboard, Medium Density Fiberboard (MDF), I-Joists, Rim Board, Other Engineered Products)
By Application (Construction (Residential, Non-Residential), Furniture Manufacturing, Flooring, Packaging, Other Industrial Applications)
By End-User Industry (Residential Segment, Non-Residential Segment)
By Wood Source (Softwood Engineered Wood, Hardwood Engineered Wood)
By Adhesion Type (Formaldehyde-based Adhesives, Formaldehyde-free Adhesives
|
|
Study Period
|
2019- 2024 and 2025-2034
|
|
Units
|
Revenue (USD)
|
|
Qualitative Analysis
|
Porter’s Five Forces, SWOT Profile, Market Share, Scenario Forecasts, Market Ecosystem, Company Ranking, Market Dynamics, Industry Benchmarking
|
|
Companies
|
Weyerhaeuser Company, Boise Cascade Company, Louisiana-Pacific Corporation (LP), West Fraser Timber Co. Ltd., Celulosa Arauco y Constitución S.A. (Arauco), Georgia-Pacific LLC, Binderholz GmbH, Stora Enso Oyj, Tolko Industries Ltd., Roseburg Forest Products, Huber Engineered Woods LLC, Kronoplus Limited (Swiss Krono Group), Metsä Wood, Norbord Inc. (now part of West Fraser), Patrick Industries, Inc.
|
|
Countries
|
US, Canada, Mexico, Germany, France, Spain, Italy, UK, Russia, China, India, Japan, South Korea, Australia, South East Asia, Brazil, Argentina, Middle East, Africa
|
By Product Type
- Plywood
- Oriented Strand Board (OSB)
- Glued Laminated Timber (Glulam)
- Laminated Veneer Lumber (LVL)
- Cross-Laminated Timber (CLT)
- Particleboard
- Medium Density Fiberboard (MDF)
- I-Joists
- Rim Board
- Other Engineered Products
By Application
- Construction (Residential, Non-Residential)
- Furniture Manufacturing
- Flooring
- Packaging
- Other Industrial Applications
By End-User Industry
- Residential Segment
- Non-Residential Segment
By Wood Source
- Softwood Engineered Wood
- Hardwood Engineered Wood
By Adhesion Type
- Formaldehyde-based Adhesives
- Formaldehyde-free Adhesives
Countries Analyzed
- North America (US, Canada, Mexico)
- Europe (Germany, UK, France, Spain, Italy, Russia, Rest of Europe)
- Asia Pacific (China, India, Japan, South Korea, Australia, South East Asia, Rest of Asia)
- South America (Brazil, Argentina, Rest of South America)
- Middle East and Africa (Saudi Arabia, UAE, Rest of Middle East, South Africa, Egypt, Rest of Africa)
Top Companies in Engineered Wood Market
- Weyerhaeuser Company
- Boise Cascade Company
- Louisiana-Pacific Corporation (LP)
- West Fraser Timber Co. Ltd.
- Celulosa Arauco y Constitución S.A. (Arauco)
- Georgia-Pacific LLC
- Binderholz GmbH
- Stora Enso Oyj
- Tolko Industries Ltd.
- Roseburg Forest Products
- Huber Engineered Woods LLC
- Kronoplus Limited (Swiss Krono Group)
- Metsä Wood
- Norbord Inc. (now part of West Fraser)
- Patrick Industries, Inc.
* List Not Exhaustive
Research Coverage
This report investigates the global engineered wood market with a focus on analytical depth, emerging product breakthroughs, and market innovation reviews across all value chain segments. USDAnalytics delivers a comprehensive analysis highlighting the transformative trends, government policies, and technological advancements shaping the future of engineered wood in construction, furniture, flooring, and industrial applications. By providing actionable intelligence and strategic benchmarking, this report is an essential resource for manufacturers, investors, architects, policymakers, and supply chain leaders seeking to understand, compete, and innovate in the evolving engineered wood landscape worldwide.
- Segmentation Covered:
- By Product Type: Plywood, Oriented Strand Board (OSB), Glued Laminated Timber (Glulam), Laminated Veneer Lumber (LVL), Cross-Laminated Timber (CLT), Particleboard, Medium Density Fiberboard (MDF), I-Joists, Rim Board, Other Engineered Products (Structural Composite Lumber, Hybrid EWPs)
- By Application: Construction (Residential, Non-Residential – Commercial, Industrial, Institutional, Infrastructure), Furniture Manufacturing, Flooring, Packaging, Other Industrial Applications
- By End-User Industry: Residential Segment, Non-Residential Segment
- By Wood Source: Softwood Engineered Wood, Hardwood Engineered Wood
- By Adhesion Type: Formaldehyde-based Adhesives (Urea-Formaldehyde, Phenol-Formaldehyde), Formaldehyde-free Adhesives (Soy-based, MDI, Polyurethane)
- Geographic Scope: Analysis spans 25+ countries across North America, Europe, Asia Pacific, Latin America, and the Middle East & Africa.
- Historic data from 2021 to 2024 and detailed forecast data from 2025 to 2034.
- Key Companies Profiled: Weyerhaeuser Company, Boise Cascade Company, Louisiana-Pacific Corporation (LP), West Fraser Timber Co. Ltd., Celulosa Arauco y Constitución S.A. (Arauco), Georgia-Pacific LLC, Binderholz GmbH, Stora Enso Oyj, Tolko Industries Ltd., Roseburg Forest Products, Huber Engineered Woods LLC, Kronoplus Limited (Swiss Krono Group), Metsä Wood, Norbord Inc. (West Fraser), Patrick Industries, Inc.
Deliverables:
- Comprehensive Market Research Report (PDF and Excel) including detailed tables, segmentation analysis, charts, and interactive visualizations
- Country-Specific Forecasts & Strategic Analysis for all major and emerging markets
- Segment-Wise Revenue Forecasts (2025–2034) by product, application, end-user, region, and adhesion type
- Competitive Analysis, Market Benchmarking, and SWOT Profiles of leading engineered wood manufacturers
- Recent Developments & Innovation Tracker featuring new investments, product launches, regulatory shifts, and technology breakthroughs
- Executive Summary & Analyst Commentary synthesizing critical findings, trends, and actionable recommendations
- Post-Purchase Analyst Support for client-specific data requests, custom segmentation, and clarifications
USDAnalytics ensures that this engineered wood market report delivers the strategic clarity, robust segmentation, and forward-looking insights needed to stay ahead in an industry shaped by sustainability, digitalization, and disruptive construction technologies. This report empowers stakeholders to benchmark best practices, anticipate regulatory changes, and develop data-driven growth strategies in the competitive engineered wood market.
