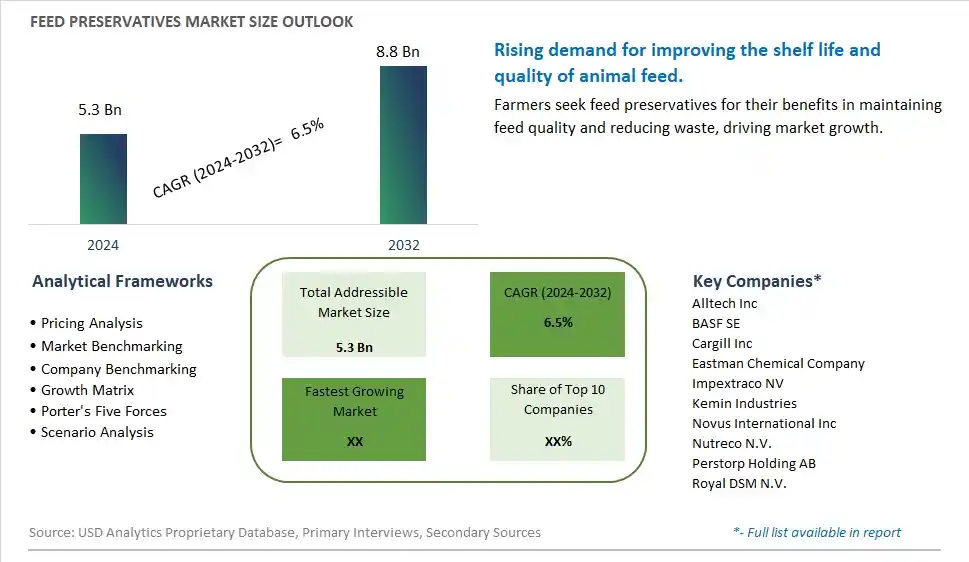
Global Feed Preservatives Market Size is valued at $5.3 Billion in 2024 and is forecast to register a growth rate (CAGR) of 6.5% to reach $8.8 Billion by 2032.
The global Feed Preservatives Market Comprehensive Study analyzes and forecasts the market size across 6 regions and 24 countries for diverse segments -By Type (Feed acidifiers, Mold inhibitors, Feed antioxidants, Anticaking agents), By livestock (Cattle, Poultry, Swine, Aquaculture, Others), By Feed type (Compound feed, Feed premix, Feed meal, Silage, Others)
An Introduction to Feed Preservatives Market
The feed preservatives market in 2024 is expanding rapidly, driven by the need to extend the shelf life and maintain the quality of animal feed. Feed preservatives, including organic acids, antioxidants, and antimicrobials, help prevent spoilage and nutrient degradation in feed. The market benefits from innovations in preservation technologies that enhance efficacy and safety. The trend towards clean label and natural ingredients is influencing product development. Increasing awareness of feed safety and the demand for high-quality livestock nutrition are further supporting market growth.
Feed Preservatives Competitive Landscape
The market report analyses the leading companies in the industry including Alltech Inc, BASF SE, Cargill Inc, Eastman Chemical Company, Impextraco NV, Kemin Industries, Novus International Inc, Nutreco N.V., Perstorp Holding AB, Royal DSM N.V., and Others.
Feed Preservatives Market Dynamics
Feed Preservatives Market Trend: Increasing Use of Natural and Organic Preservatives
The most prominent trend in the Feed Preservatives Market is the increasing use of natural and organic preservatives. Livestock producers are seeking safer and more sustainable options for feed preservation, driving the demand for natural preservatives. This trend is driven by the growing awareness of animal health and food safety.
Feed Preservatives Market Driver: Health Consciousness and Demand for Safe Animal Feed
A key driver in the Feed Preservatives Market is health consciousness and the demand for safe animal feed. As more livestock producers focus on improving the health and productivity of their animals, there is a rising demand for feed preservatives that ensure feed safety and quality without harmful additives. This demand supports market growth as producers seek reliable and health-focused preservation solutions.
Feed Preservatives Market Opportunity: Innovation in Multi-Functional Preservatives
One significant opportunity in the Feed Preservatives Market lies in innovation in multi-functional preservatives. Companies can develop new feed preservatives that offer additional benefits, such as enhanced nutrient retention and improved palatability, catering to the needs of livestock producers. By offering diverse and functional preservation options, manufacturers can attract a broader consumer base and drive market growth.
Feed Preservatives Market Share Analysis- Largest Segment by Type
In the Feed Preservatives Market, Feed Acidifiers are the largest segment. Feed acidifiers are widely used to improve the preservation and safety of animal feed by lowering pH levels and inhibiting microbial growth. Their effectiveness in extending the shelf life of feed and enhancing its nutritional quality makes them a preferred choice among feed manufacturers. The widespread adoption of feed acidifiers in the livestock and poultry industries, where feed stability and safety are critical, contributes to their dominance in the market. Additionally, their cost-effectiveness and proven benefits in improving feed efficiency drive their large market share.
Feed Preservatives Market Share Analysis- Poised to Grow Fastest Over the Next Five Years by Livestock
The Aquaculture segment in the Feed Preservatives Market is poised to grow the fastest over the next five years. The increasing global demand for seafood and the expansion of aquaculture operations drive the need for effective feed preservatives to ensure the quality and safety of feed used in aquatic farming. Aquaculture feed is susceptible to rapid degradation and microbial contamination, making feed preservatives essential for maintaining feed stability and preventing spoilage. Innovations in feed preservation technologies and growing investments in aquaculture research and development further support the rapid growth of the aquaculture segment in the feed preservatives market.
Feed Preservatives Market Share Analysis- Largest Segment by Feed Type
In the Feed Preservatives Market, Compound Feed is the largest segment. Compound feed, which includes a mixture of various ingredients formulated to meet the nutritional needs of livestock, is widely used in the animal feed industry. The complexity and diversity of compound feed require effective preservation methods to maintain feed quality and prevent spoilage. Feed preservatives are essential in extending the shelf life and ensuring the nutritional integrity of compound feed. The large volume of compound feed produced and consumed globally, combined with the need for reliable preservation solutions, contributes to its position as the largest segment in the feed preservatives market.
Feed Preservatives Market Segmentation
By Type
Feed acidifiers
Mold inhibitors
Feed antioxidants
Anticaking agents
By livestock
Cattle
Poultry
Swine
Aquaculture
Others
By Feed type
Compound feed
Feed premix
Feed meal
Silage
Others
Countries Analyzed
North America (US, Canada, Mexico)
Europe (Germany, UK, France, Spain, Italy, Russia, Rest of Europe)
Asia Pacific (China, India, Japan, South Korea, Australia, South East Asia, Rest of Asia)
South America (Brazil, Argentina, Rest of South America)
Middle East and Africa (Saudi Arabia, UAE, Rest of Middle East, South Africa, Egypt, Rest of Africa)
Feed Preservatives Companies Profiled in the Study
Alltech Inc
BASF SE
Cargill Inc
Eastman Chemical Company
Impextraco NV
Kemin Industries
Novus International Inc
Nutreco N.V.
Perstorp Holding AB
Royal DSM N.V.
*- List Not Exhaustive
Chapter 1. TABLE OF CONTENTS
Chapter 2. Introduction to Feed Preservatives Market
2.1. Market Overview
2.2. Key Statistics and Report Highlights
2.3. Scope of the Comprehensive Study
2.3.1. Market Definition
2.3.2 Countries and Regions Covered
2.3.3 Research Objective
2.3.4 Units, Currency, and Conversions
2.3.5 Industry Value Chain
2.4. Key Market Segments
2.5. Key Companies
2.6. Study Period
Chapter 3. Strategic Analysis Review
3.1. Feed Preservatives Pricing Analysis and Forecast
3.2. Porter’s Five Forces
3.3. Market Ecosystem
3.4. SWOT Analysis
3.5. Regulatory Scenario
3.3. Effects of Inflation, Russia-Ukraine War, moderating economic growth, and other macroeconomic factors
Chapter 4. Competitive Landscape
4.1. Market Share Analysis
4.1.1. Global Feed Preservatives Market Share by Company, 2023
4.1.2. Product Offerings of Leading Feed Preservatives Companies
4.2. Market Entropy
4.2.1. New Product Launches in the Industry
4.2.2. Mergers, Acquisitions, Joint ventures, and Partnerships
4.3. Key Strategies and Best Practices
Chapter 5. Global Market Projections: Best, Reference, and Low Case Scenarios
5.1. Growth Analysis- Case Scenario Definitions
5.2. Low Growth Case Scenario Forecasts
5.3. Reference Growth Case Scenario Forecasts
5.4. High Growth Case Scenario Forecasts
Chapter 6. Market Dynamics
6.1. Feed Preservatives Market Drivers
6.2. Feed Preservatives Market Challenges
6.6. Feed Preservatives Market Opportunities
6.4. Feed Preservatives Market Trends
Chapter 7. Global Feed Preservatives Market Outlook Trends
7.1. Global Feed Preservatives Revenue (USD Million) and CAGR (%) by Type (2021-2032)
7.2. Global Feed Preservatives Revenue (USD Million) and CAGR (%) by Application (2021-2032)
7.3. Global Feed Preservatives Revenue (USD Million) and CAGR (%) by Product (2021-2032)
By Type
Feed acidifiers
Mold inhibitors
Feed antioxidants
Anticaking agents
By livestock
Cattle
Poultry
Swine
Aquaculture
Others
By Feed type
Compound feed
Feed premix
Feed meal
Silage
Others
Chapter 8. Global Feed Preservatives Regional Analysis and Outlook
8.1. Global Feed Preservatives Revenue (USD Million) By Regions (2021- 2032)
8.2. North America Feed Preservatives Revenue (USD Million) by Country (2021-2032)
8.2.1. United States Feed Preservatives Regional Analysis and Outlook
8.2.2. Canada Feed Preservatives Regional Analysis and Outlook
8.2.3. Mexico Feed Preservatives Regional Analysis and Outlook
8.3. Europe Feed Preservatives Revenue (USD Million), by Country (2021-2032)
8.3.1. Germany Feed Preservatives Regional Analysis and Outlook
8.3.2. France Feed Preservatives Regional Analysis and Outlook
8.3.3. United Kingdom Feed Preservatives Regional Analysis and Outlook
8.3.4. Spain Feed Preservatives Regional Analysis and Outlook
8.3.5. Italy Feed Preservatives Regional Analysis and Outlook
8.3.6. Russia Feed Preservatives Regional Analysis and Outlook
8.3.7. Rest of Europe Feed Preservatives Regional Analysis and Outlook
8.4. Asia Pacific Feed Preservatives Revenue (USD Million) by Country (2021-2032)
8.4.1. China Feed Preservatives Regional Analysis and Outlook
8.4.2. Japan Feed Preservatives Regional Analysis and Outlook
8.4.3. India Feed Preservatives Regional Analysis and Outlook
8.4.4. South Korea Feed Preservatives Regional Analysis and Outlook
8.4.5. Australia Feed Preservatives Regional Analysis and Outlook
8.4.6. South East Asia Feed Preservatives Regional Analysis and Outlook
8.4.7. Rest of Asia Pacific Feed Preservatives Regional Analysis and Outlook
8.5. South America Feed Preservatives Revenue (USD Million), by Country (2021-2032)
8.5.1. Brazil Feed Preservatives Regional Analysis and Outlook
8.5.2. Argentina Feed Preservatives Regional Analysis and Outlook
8.5.3. Rest of South America Feed Preservatives Regional Analysis and Outlook
8.6. Middle East and Africa Feed Preservatives Revenue (USD Million) by Country (2021-2032)
8.6.1. Middle East Feed Preservatives Regional Analysis and Outlook
8.6.2. Africa Feed Preservatives Regional Analysis and Outlook
Chapter 9. North America Feed Preservatives Analysis and Outlook
9.1. North America Feed Preservatives Revenue (USD Million) by Segments (2021-2032)
9.1.1. North America Feed Preservatives Revenue (USD Million) by Type (2021-2032)
9.1.2. North America Feed Preservatives Revenue (USD Million) by Application (2021-2032)
9.1.3. North America Feed Preservatives Revenue (USD Million) by Product (2021-2032)
By Type
Feed acidifiers
Mold inhibitors
Feed antioxidants
Anticaking agents
By livestock
Cattle
Poultry
Swine
Aquaculture
Others
By Feed type
Compound feed
Feed premix
Feed meal
Silage
Others
Chapter 10. Europe Feed Preservatives Analysis and Outlook
10.1. Europe Feed Preservatives Revenue (USD Million), by Segments (USD Million) (2021-2032)
10.1.1. Europe Feed Preservatives Revenue (USD Million) by Type (2021-2032)
10.1.2. Europe Feed Preservatives Revenue (USD Million) by Application (2021-2032)
10.1.3. Europe Feed Preservatives Revenue (USD Million) by Product (2021-2032)
By Type
Feed acidifiers
Mold inhibitors
Feed antioxidants
Anticaking agents
By livestock
Cattle
Poultry
Swine
Aquaculture
Others
By Feed type
Compound feed
Feed premix
Feed meal
Silage
Others
Chapter 11. Asia Pacific Feed Preservatives Analysis and Outlook
11.1. Asia Pacific Feed Preservatives Revenue (USD Million), and Revenue (USD Million) by Segments (2021-2032)
11.1.1. Asia Pacific Feed Preservatives Revenue (USD Million) by Type (2021-2032)
11.1.2. Asia Pacific Feed Preservatives Revenue (USD Million) by Application (2021-2032)
11.1.3. Asia Pacific Feed Preservatives Revenue (USD Million) by Product (2021-2032)
By Type
Feed acidifiers
Mold inhibitors
Feed antioxidants
Anticaking agents
By livestock
Cattle
Poultry
Swine
Aquaculture
Others
By Feed type
Compound feed
Feed premix
Feed meal
Silage
Others
Chapter 12. South America Feed Preservatives Analysis and Outlook
12.1. South America Feed Preservatives Revenue (USD Million), by Segments (2021-2032)
12.1.1. South America Feed Preservatives Revenue (USD Million) by Type (2021-2032)
12.1.2. South America Feed Preservatives Revenue (USD Million) by Application (2021-2032)
12.1.3. South America Feed Preservatives Revenue (USD Million) by Product (2021-2032)
By Type
Feed acidifiers
Mold inhibitors
Feed antioxidants
Anticaking agents
By livestock
Cattle
Poultry
Swine
Aquaculture
Others
By Feed type
Compound feed
Feed premix
Feed meal
Silage
Others
Chapter 13. Middle East and Africa Feed Preservatives Analysis and Outlook
13.1. Middle East and Africa Feed Preservatives Revenue (USD Million), by Segments (2021-2032)
13.1.1. Middle East and Africa Feed Preservatives Revenue (USD Million) by Type (2021-2032)
13.1.2. Middle East and Africa Feed Preservatives Revenue (USD Million) by Application (2021-2032)
13.1.3. Middle East and Africa Feed Preservatives Revenue (USD Million) by Product (2021-2032)
By Type
Feed acidifiers
Mold inhibitors
Feed antioxidants
Anticaking agents
By livestock
Cattle
Poultry
Swine
Aquaculture
Others
By Feed type
Compound feed
Feed premix
Feed meal
Silage
Others
Chapter 14. Feed Preservatives Company Profiles
14.1 Business Overview
14.2 Product Profiles
14.3 SWOT Profiles
14.5 Recent Developments
14.6 Financial Profile
List of Companies
Alltech Inc
BASF SE
Cargill Inc
Eastman Chemical Company
Impextraco NV
Kemin Industries
Novus International Inc
Nutreco N.V.
Perstorp Holding AB
Royal DSM N.V.
15. Methodology and Data Sources
15.1 Customization Offerings
15.2 Subscription Services
15.3 Related Reports
15.4 Publisher Expertise
LIST OF TABLES
Table 1 Market Segmentation Analysis
Table 2 Global Feed Preservatives Market Share of Leading Companies, 2023
Table 3 Product Offerings of Leading Companies
Table 4 Low Growth Scenario Forecasts
Table 5 Reference Case Growth Scenario
Table 6 High Growth Case Scenario
Table 7 Global Feed Preservatives Revenue (USD Million) And CAGR (%) By Type (2021-2032)
Table 8 Global Feed Preservatives Revenue (USD Million) And CAGR (%) By Application (2021-2032)
Table 9 Global Feed Preservatives Revenue (USD Million) And CAGR (%) By Product (2021-2032)
Table 10 Global Feed Preservatives Market Revenue (USD Million) By Regions (2021-2032)
Table 11 Global Feed Preservatives Market Share (%) By Regions (2021-2032)
Table 12 North America Feed Preservatives Revenue (USD Million) By Country (2021-2032)
Table 13 Europe Feed Preservatives Revenue (USD Million) By Country (2021-2032)
Table 14 Asia Pacific Feed Preservatives Revenue (USD Million) By Country (2021-2032)
Table 15 South America Feed Preservatives Revenue (USD Million) By Country (2021-2032)
Table 16 Middle East and Africa Feed Preservatives Revenue (USD Million) By Region (2021-2032)
Table 17 North America Feed Preservatives Revenue (USD Million) By Type (2021-2032)
Table 18 North America Feed Preservatives Revenue (USD Million) By Application (2021-2032)
Table 19 North America Feed Preservatives Revenue (USD Million) By Product (2021-2032)
Table 20 Europe Feed Preservatives Revenue (USD Million) By Type (2021-2032)
Table 21 Europe Feed Preservatives Revenue (USD Million) By Application (2021-2032)
Table 22 Europe Feed Preservatives Revenue (USD Million) By Product (2021-2032)
Table 23 Asia Pacific Feed Preservatives Revenue (USD Million) By Type (2021-2032)
Table 24 Asia Pacific Feed Preservatives Revenue (USD Million) By Application (2021-2032)
Table 25 Asia Pacific Feed Preservatives Revenue (USD Million) By Product (2021-2032)
Table 26 South America Feed Preservatives Revenue (USD Million) By Type (2021-2032)
Table 27 South America Feed Preservatives Revenue (USD Million) By Application (2021-2032)
Table 28 South America Feed Preservatives Revenue (USD Million) By Product (2021-2032)
Table 29 Middle East and Africa Feed Preservatives Revenue (USD Million) By Type (2021-2032)
Table 30 Middle East and Africa Feed Preservatives Revenue (USD Million) By Application (2021-2032)
Table 31 Middle East and Africa Feed Preservatives Revenue (USD Million) By Product (2021-2032)
LIST OF FIGURES
Figure 1. Market Scope
Figure 2. Pricing Forecasts Per Unit, 2023- 2032
Figure 3. Porter’s Five Forces
Figure 4. Global Feed Preservatives Market Revenue (USD Million) By Regions (2021-2032)
Figure 5. Global Feed Preservatives Market Share (%) By Regions (2023)
Figure 6. North America Feed Preservatives Revenue (USD Million) By Country (2021-2032)
Figure 7. United States Feed Preservatives Revenue (USD Million) By Country (2021-2032)
Figure 8. Canada Feed Preservatives Revenue (USD Million) By Country (2021-2032)
Figure 9. Mexico Feed Preservatives Revenue (USD Million) By Country (2021-2032)
Figure 10. Europe Feed Preservatives Revenue (USD Million) By Country (2021-2032)
Figure 11. Germany Feed Preservatives Revenue (USD Million) By Country (2021-2032)
Figure 12. France Feed Preservatives Revenue (USD Million) By Country (2021-2032)
Figure 13. United Kingdom Feed Preservatives Revenue (USD Million) By Country (2021-2032)
Figure 14. Spain Feed Preservatives Revenue (USD Million) By Country (2021-2032)
Figure 15. Italy Feed Preservatives Revenue (USD Million) By Country (2021-2032)
Figure 16. Russia Feed Preservatives Revenue (USD Million) By Country (2021-2032)
Figure 17. Rest of Europe Feed Preservatives Revenue (USD Million) By Country (2021-2032)
Figure 11. Asia Pacific Feed Preservatives Revenue (USD Million) By Country (2021-2032)
Figure 12. China Feed Preservatives Revenue (USD Million) By Country (2021-2032)
Figure 13. Japan Feed Preservatives Revenue (USD Million) By Country (2021-2032)
Figure 14. India Feed Preservatives Revenue (USD Million) By Country (2021-2032)
Figure 15. South Korea Feed Preservatives Revenue (USD Million) By Country (2021-2032)
Figure 16. Australia Feed Preservatives Revenue (USD Million) By Country (2021-2032)
Figure 17. South East Asia Feed Preservatives Revenue (USD Million) By Country (2021-2032)
Figure 18. South America Feed Preservatives Revenue (USD Million) By Country (2021-2032)
Figure 19. Brazil Feed Preservatives Revenue (USD Million) By Country (2021-2032)
Figure 20. Argentina Feed Preservatives Revenue (USD Million) By Country (2021-2032)
Figure 21. Rest of Asia Pacific Feed Preservatives Revenue (USD Million) By Country (2021-2032)
Figure 22. Middle East and Africa Feed Preservatives Revenue (USD Million) By Region (2021-2032)
Figure 23. Saudi Arabia Feed Preservatives Revenue (USD Million) By Region (2021-2032)
Figure 24. The UAE Feed Preservatives Revenue (USD Million) By Region (2021-2032)
Figure 25. Rest of Middle East Feed Preservatives Revenue (USD Million) By Region (2021-2032)
Figure 26. South Africa Feed Preservatives Revenue (USD Million) By Region (2021-2032)
Figure 27. Africa Feed Preservatives Revenue (USD Million) By Region (2021-2032)
Figure 28. North America Feed Preservatives Revenue (USD Million) By Type (2021-2032)
Figure 29. North America Feed Preservatives Revenue (USD Million) By Application (2021-2032)
Figure 30. North America Feed Preservatives Revenue (USD Million) By Product (2021-2032)
Figure 31. Europe Feed Preservatives Revenue (USD Million) By Type (2021-2032)
Figure 32. Europe Feed Preservatives Revenue (USD Million) By Application (2021-2032)
Figure 33. Europe Feed Preservatives Revenue (USD Million) By Product (2021-2032)
Figure 34. Asia Pacific Feed Preservatives Revenue (USD Million) By Type (2021-2032)
Figure 35. Asia Pacific Feed Preservatives Revenue (USD Million) By Application (2021-2032)
Figure 36. Asia Pacific Feed Preservatives Revenue (USD Million) By Product (2021-2032)
Figure 37. South America Feed Preservatives Revenue (USD Million) By Type (2021-2032)
Figure 38. South America Feed Preservatives Revenue (USD Million) By Application (2021-2032)
Figure 39. South America Feed Preservatives Revenue (USD Million) By Product (2021-2032)
Figure 40. Middle East and Africa Feed Preservatives Revenue (USD Million) By Type (2021-2032)
Figure 41. Middle East and Africa Feed Preservatives Revenue (USD Million) By Application (2021-2032)
Figure 42. Middle East and Africa Feed Preservatives Revenue (USD Million) By Product (2021-2032)
By Type
Feed acidifiers
Mold inhibitors
Feed antioxidants
Anticaking agents
By livestock
Cattle
Poultry
Swine
Aquaculture
Others
By Feed type
Compound feed
Feed premix
Feed meal
Silage
Others
Countries Analyzed
North America (US, Canada, Mexico)
Europe (Germany, UK, France, Spain, Italy, Russia, Rest of Europe)
Asia Pacific (China, India, Japan, South Korea, Australia, South East Asia, Rest of Asia)
South America (Brazil, Argentina, Rest of South America)
Middle East and Africa (Saudi Arabia, UAE, Rest of Middle East, South Africa, Egypt, Rest of Africa)
