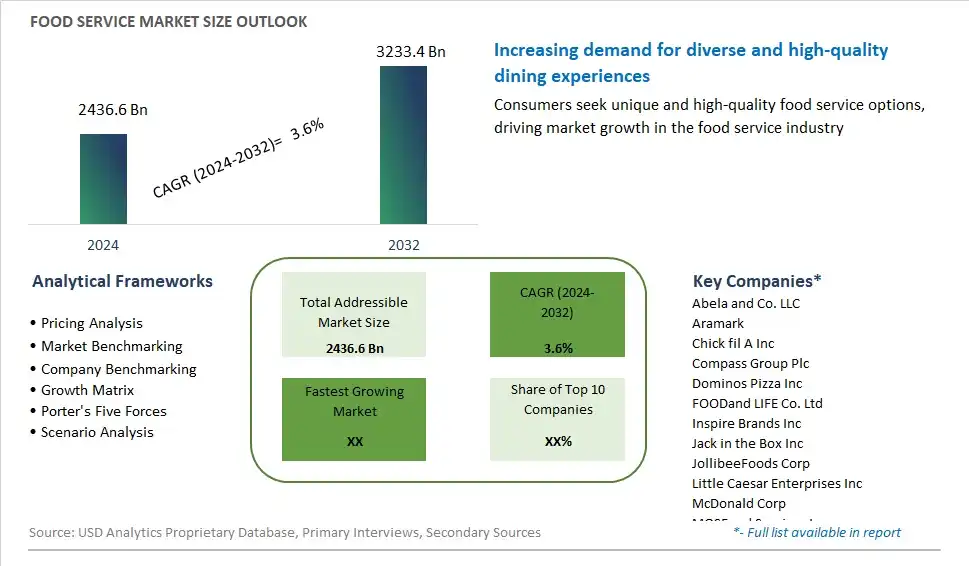
Global Food Service Market Size is valued at $2436.6 Billion in 2024 and is forecast to register a growth rate (CAGR) of 3.6% to reach $3233.4 Billion by 2032.
The global Food Service Market Comprehensive Study analyzes and forecasts the market size across 6 regions and 24 countries for diverse segments -By Service (Conventional, Centralized, Ready-prepared, Assembly-serve), By Sector (Commercial, Non-commercial)
An Introduction to Food Service Market
The food service market in 2024 is thriving, driven by evolving consumer dining preferences and the rise of digital technology. Food service encompasses a wide range of establishments, including restaurants, cafes, catering services, and institutional dining. The market benefits from the growing trend of eating out and the increasing demand for diverse and high-quality dining experiences. Digital innovations such as online ordering, delivery apps, and contactless payment systems have transformed the food service landscape, enhancing convenience and customer engagement. The market is also witnessing a shift towards sustainable practices, including the use of locally sourced ingredients, eco-friendly packaging, and waste reduction initiatives. As consumer preferences continue to evolve and digital transformation accelerates, the food service market is set for continued growth and innovation.
Food Service Competitive Landscape
The market report analyses the leading companies in the industry including Abela and Co. LLC, Aramark, Chick fil A Inc, Compass Group Plc, Dominos Pizza Inc, FOODand LIFE Co. Ltd, Inspire Brands Inc, Jack in the Box Inc, JollibeeFoods Corp, Little Caesar Enterprises Inc, McDonald Corp, MOSFood Services Inc, Papa Johns International Inc, PerformanceFood Group Co., Restaurant Brands International Inc, Sodexo SA, Starbucks Corp, Sysco Corp, The Wendys Co., YUM Brands Inc, and Others.
Food Service Market Dynamics
Food Service Market Trend: Rise of Food Delivery and Takeout Services
A prominent trend in the food service market is the rise of food delivery and takeout services. With changing consumer behaviors, busy lifestyles, and increased digitalization, there's a growing demand for convenient dining options that offer flexibility and accessibility. Food delivery platforms and mobile apps have revolutionized the way consumers access restaurant food, allowing them to order meals for delivery or pickup from a wide range of establishments. This trend is driven by factors such as urbanization, the proliferation of smartphones, and the convenience of online ordering, which have reshaped the food service landscape and created new opportunities for restaurants to reach customers beyond their physical locations. As the popularity of food delivery and takeout continues to grow, restaurants are adapting their business models and investing in technology to meet the evolving needs of consumers for on-demand dining experiences.
Market Driver: Changing Consumer Preferences and Dining Habits
An essential driver fueling the food service market is the changing consumer preferences and dining habits. With increasing diversity in tastes, dietary preferences, and cultural influences, consumers are seeking more personalized and experiential dining experiences. This driver is further amplified by shifting demographics, including the rise of millennials and Generation Z, who prioritize convenience, variety, and socialization in their dining choices. Restaurants are responding to these trends by offering innovative menus, customizable options, and immersive dining environments that cater to diverse palates and lifestyles. Additionally, the demand for healthier, ethically sourced, and sustainable food options is influencing menu development and driving changes in food service operations. As consumer preferences continue to evolve, restaurants that can adapt to changing tastes and embrace innovation will remain competitive and thrive in the dynamic food service market.
Market Opportunity: Expansion into Virtual Kitchen and Cloud Kitchen Concepts
A significant opportunity within the food service market lies in the expansion into virtual kitchen and cloud kitchen concepts. Also known as ghost kitchens or dark kitchens, these facilities are dedicated to preparing food for delivery and takeout orders without traditional dine-in services. Virtual kitchens leverage technology and data analytics to optimize operations, reduce overhead costs, and maximize efficiency in food production and delivery. This opportunity is driven by the growing demand for delivery-only dining options, the rise of third-party delivery platforms, and the need for restaurants to adapt to changing consumer behaviors and market dynamics. By investing in virtual kitchen infrastructure, restaurants can expand their reach, test new concepts, and enter new markets with lower capital investment and operational risks. Additionally, virtual kitchens offer opportunities for collaboration and co-branding, allowing multiple restaurant brands to share resources and leverage each other's strengths to meet the demands of today's on-demand food delivery market.
Food Service Market Share Analysis: Conventional held the dominant market share in 2024
In the Food Service Market, the Conventional segment is the largest, owing to its widespread adoption across various dining establishments, including restaurants, cafes, and hotels. Conventional food service involves freshly prepared meals cooked on-site and served directly to customers. This traditional approach allows for customization, flexibility in menu offerings, and a personalized dining experience tailored to individual preferences. Additionally, conventional food service aligns with consumer expectations for quality, freshness, and flavor, as meals are prepared from scratch using fresh ingredients. Furthermore, the conventional model caters to a diverse range of dining occasions, from casual dining to formal events, making it a versatile choice for food service providers. Further, the Conventional segment's dominance is sustained by its ability to adapt to changing consumer trends, such as the increasing demand for healthier options, ethnic cuisines, and sustainable practices, while maintaining the core principles of quality and hospitality. As a result, the Conventional segment remains the largest in the Food Service Market, catering to a broad spectrum of dining preferences and occasions.
Food Service Market Share Analysis: Non-commercial market is poised to register the fastest growth rae over the forecast period to 2032
In the Food Service Market, the Non-commercial segment is the fastest-growing, driven by the expanding demand for food services in institutional settings such as schools, hospitals, universities, and corporate offices. Non-commercial food service providers cater to a diverse clientele, including students, patients, employees, and visitors, offering meals as part of their broader service offerings. The growth of the non-commercial sector is fueled by various factors, including demographic shifts, changing dietary preferences, and the increasing focus on health and wellness. Institutions are increasingly prioritizing food quality, nutrition, and sustainability, driving the adoption of innovative food service solutions that meet these evolving needs. Further, regulatory mandates and industry standards for nutrition and food safety further propel the growth of the non-commercial segment, as institutions seek to comply with guidelines while delivering high-quality dining experiences. Additionally, the non-commercial sector benefits from economies of scale, centralized procurement, and operational efficiencies, enabling cost-effective and sustainable food service solutions. As a result, the Non-commercial segment in the Food Service Market is poised for rapid growth, catering to the diverse dining needs of institutional clients while embracing emerging trends in food service and hospitality.
Food Service Market Segmentation
By Service
Conventional
Centralized
Ready-prepared
Assembly-serve
By Sector
Commercial
Non-commercial
Countries Analyzed
North America (US, Canada, Mexico)
Europe (Germany, UK, France, Spain, Italy, Russia, Rest of Europe)
Asia Pacific (China, India, Japan, South Korea, Australia, South East Asia, Rest of Asia)
South America (Brazil, Argentina, Rest of South America)
Middle East and Africa (Saudi Arabia, UAE, Rest of Middle East, South Africa, Egypt, Rest of Africa)
Food Service Companies Profiled in the Study
Abela and Co. LLC
Aramark
Chick fil A Inc
Compass Group Plc
Dominos Pizza Inc
FOODand LIFE Co. Ltd
Inspire Brands Inc
Jack in the Box Inc
JollibeeFoods Corp
Little Caesar Enterprises Inc
McDonald Corp
MOSFood Services Inc
Papa Johns International Inc
PerformanceFood Group Co.
Restaurant Brands International Inc
Sodexo SA
Starbucks Corp
Sysco Corp
The Wendys Co.
YUM Brands Inc
*- List Not Exhaustive
Chapter 1. TABLE OF CONTENTS
Chapter 2. Introduction to Food Service Market
2.1. Market Overview
2.2. Key Statistics and Report Highlights
2.3. Scope of the Comprehensive Study
2.3.1. Market Definition
2.3.2 Countries and Regions Covered
2.3.3 Research Objective
2.3.4 Units, Currency, and Conversions
2.3.5 Industry Value Chain
2.4. Key Market Segments
2.5. Key Companies
2.6. Study Period
Chapter 3. Strategic Analysis Review
3.1. Food Service Pricing Analysis and Forecast
3.2. Porter’s Five Forces
3.3. Market Ecosystem
3.4. SWOT Analysis
3.5. Regulatory Scenario
3.3. Effects of Inflation, Russia-Ukraine War, moderating economic growth, and other macroeconomic factors
Chapter 4. Competitive Landscape
4.1. Market Share Analysis
4.1.1. Global Food Service Market Share by Company, 2023
4.1.2. Product Offerings of Leading Food Service Companies
4.2. Market Entropy
4.2.1. New Product Launches in the Industry
4.2.2. Mergers, Acquisitions, Joint ventures, and Partnerships
4.3. Key Strategies and Best Practices
Chapter 5. Global Market Projections: Best, Reference, and Low Case Scenarios
5.1. Growth Analysis- Case Scenario Definitions
5.2. Low Growth Case Scenario Forecasts
5.3. Reference Growth Case Scenario Forecasts
5.4. High Growth Case Scenario Forecasts
Chapter 6. Market Dynamics
6.1. Food Service Market Drivers
6.2. Food Service Market Challenges
6.6. Food Service Market Opportunities
6.4. Food Service Market Trends
Chapter 7. Global Food Service Market Outlook Trends
7.1. Global Food Service Revenue (USD Million) and CAGR (%) by Type (2021-2032)
7.2. Global Food Service Revenue (USD Million) and CAGR (%) by Application (2021-2032)
7.3. Global Food Service Revenue (USD Million) and CAGR (%) by Product (2021-2032)
By Service
Conventional
Centralized
Ready-prepared
Assembly-serve
By Sector
Commercial
Non-commercial
Chapter 8. Global Food Service Regional Analysis and Outlook
8.1. Global Food Service Revenue (USD Million) By Regions (2021- 2032)
8.2. North America Food Service Revenue (USD Million) by Country (2021-2032)
8.2.1. United States Food Service Regional Analysis and Outlook
8.2.2. Canada Food Service Regional Analysis and Outlook
8.2.3. Mexico Food Service Regional Analysis and Outlook
8.3. Europe Food Service Revenue (USD Million), by Country (2021-2032)
8.3.1. Germany Food Service Regional Analysis and Outlook
8.3.2. France Food Service Regional Analysis and Outlook
8.3.3. United Kingdom Food Service Regional Analysis and Outlook
8.3.4. Spain Food Service Regional Analysis and Outlook
8.3.5. Italy Food Service Regional Analysis and Outlook
8.3.6. Russia Food Service Regional Analysis and Outlook
8.3.7. Rest of Europe Food Service Regional Analysis and Outlook
8.4. Asia Pacific Food Service Revenue (USD Million) by Country (2021-2032)
8.4.1. China Food Service Regional Analysis and Outlook
8.4.2. Japan Food Service Regional Analysis and Outlook
8.4.3. India Food Service Regional Analysis and Outlook
8.4.4. South Korea Food Service Regional Analysis and Outlook
8.4.5. Australia Food Service Regional Analysis and Outlook
8.4.6. South East Asia Food Service Regional Analysis and Outlook
8.4.7. Rest of Asia Pacific Food Service Regional Analysis and Outlook
8.5. South America Food Service Revenue (USD Million), by Country (2021-2032)
8.5.1. Brazil Food Service Regional Analysis and Outlook
8.5.2. Argentina Food Service Regional Analysis and Outlook
8.5.3. Rest of South America Food Service Regional Analysis and Outlook
8.6. Middle East and Africa Food Service Revenue (USD Million) by Country (2021-2032)
8.6.1. Middle East Food Service Regional Analysis and Outlook
8.6.2. Africa Food Service Regional Analysis and Outlook
Chapter 9. North America Food Service Analysis and Outlook
9.1. North America Food Service Revenue (USD Million) by Segments (2021-2032)
9.1.1. North America Food Service Revenue (USD Million) by Type (2021-2032)
9.1.2. North America Food Service Revenue (USD Million) by Application (2021-2032)
9.1.3. North America Food Service Revenue (USD Million) by Product (2021-2032)
By Service
Conventional
Centralized
Ready-prepared
Assembly-serve
By Sector
Commercial
Non-commercial
Chapter 10. Europe Food Service Analysis and Outlook
10.1. Europe Food Service Revenue (USD Million), by Segments (USD Million) (2021-2032)
10.1.1. Europe Food Service Revenue (USD Million) by Type (2021-2032)
10.1.2. Europe Food Service Revenue (USD Million) by Application (2021-2032)
10.1.3. Europe Food Service Revenue (USD Million) by Product (2021-2032)
By Service
Conventional
Centralized
Ready-prepared
Assembly-serve
By Sector
Commercial
Non-commercial
Chapter 11. Asia Pacific Food Service Analysis and Outlook
11.1. Asia Pacific Food Service Revenue (USD Million), and Revenue (USD Million) by Segments (2021-2032)
11.1.1. Asia Pacific Food Service Revenue (USD Million) by Type (2021-2032)
11.1.2. Asia Pacific Food Service Revenue (USD Million) by Application (2021-2032)
11.1.3. Asia Pacific Food Service Revenue (USD Million) by Product (2021-2032)
By Service
Conventional
Centralized
Ready-prepared
Assembly-serve
By Sector
Commercial
Non-commercial
Chapter 12. South America Food Service Analysis and Outlook
12.1. South America Food Service Revenue (USD Million), by Segments (2021-2032)
12.1.1. South America Food Service Revenue (USD Million) by Type (2021-2032)
12.1.2. South America Food Service Revenue (USD Million) by Application (2021-2032)
12.1.3. South America Food Service Revenue (USD Million) by Product (2021-2032)
By Service
Conventional
Centralized
Ready-prepared
Assembly-serve
By Sector
Commercial
Non-commercial
Chapter 13. Middle East and Africa Food Service Analysis and Outlook
13.1. Middle East and Africa Food Service Revenue (USD Million), by Segments (2021-2032)
13.1.1. Middle East and Africa Food Service Revenue (USD Million) by Type (2021-2032)
13.1.2. Middle East and Africa Food Service Revenue (USD Million) by Application (2021-2032)
13.1.3. Middle East and Africa Food Service Revenue (USD Million) by Product (2021-2032)
By Service
Conventional
Centralized
Ready-prepared
Assembly-serve
By Sector
Commercial
Non-commercial
Chapter 14. Food Service Company Profiles
14.1 Business Overview
14.2 Product Profiles
14.3 SWOT Profiles
14.5 Recent Developments
14.6 Financial Profile
List of Companies
Abela and Co. LLC
Aramark
Chick fil A Inc
Compass Group Plc
Dominos Pizza Inc
FOODand LIFE Co. Ltd
Inspire Brands Inc
Jack in the Box Inc
JollibeeFoods Corp
Little Caesar Enterprises Inc
McDonald Corp
MOSFood Services Inc
Papa Johns International Inc
PerformanceFood Group Co.
Restaurant Brands International Inc
Sodexo SA
Starbucks Corp
Sysco Corp
The Wendys Co.
YUM Brands Inc
15. Methodology and Data Sources
15.1 Customization Offerings
15.2 Subscription Services
15.3 Related Reports
15.4 Publisher Expertise
LIST OF TABLES
Table 1 Market Segmentation Analysis
Table 2 Global Food Service Market Share of Leading Companies, 2023
Table 3 Product Offerings of Leading Companies
Table 4 Low Growth Scenario Forecasts
Table 5 Reference Case Growth Scenario
Table 6 High Growth Case Scenario
Table 7 Global Food Service Revenue (USD Million) And CAGR (%) By Type (2021-2032)
Table 8 Global Food Service Revenue (USD Million) And CAGR (%) By Application (2021-2032)
Table 9 Global Food Service Revenue (USD Million) And CAGR (%) By Product (2021-2032)
Table 10 Global Food Service Market Revenue (USD Million) By Regions (2021-2032)
Table 11 Global Food Service Market Share (%) By Regions (2021-2032)
Table 12 North America Food Service Revenue (USD Million) By Country (2021-2032)
Table 13 Europe Food Service Revenue (USD Million) By Country (2021-2032)
Table 14 Asia Pacific Food Service Revenue (USD Million) By Country (2021-2032)
Table 15 South America Food Service Revenue (USD Million) By Country (2021-2032)
Table 16 Middle East and Africa Food Service Revenue (USD Million) By Region (2021-2032)
Table 17 North America Food Service Revenue (USD Million) By Type (2021-2032)
Table 18 North America Food Service Revenue (USD Million) By Application (2021-2032)
Table 19 North America Food Service Revenue (USD Million) By Product (2021-2032)
Table 20 Europe Food Service Revenue (USD Million) By Type (2021-2032)
Table 21 Europe Food Service Revenue (USD Million) By Application (2021-2032)
Table 22 Europe Food Service Revenue (USD Million) By Product (2021-2032)
Table 23 Asia Pacific Food Service Revenue (USD Million) By Type (2021-2032)
Table 24 Asia Pacific Food Service Revenue (USD Million) By Application (2021-2032)
Table 25 Asia Pacific Food Service Revenue (USD Million) By Product (2021-2032)
Table 26 South America Food Service Revenue (USD Million) By Type (2021-2032)
Table 27 South America Food Service Revenue (USD Million) By Application (2021-2032)
Table 28 South America Food Service Revenue (USD Million) By Product (2021-2032)
Table 29 Middle East and Africa Food Service Revenue (USD Million) By Type (2021-2032)
Table 30 Middle East and Africa Food Service Revenue (USD Million) By Application (2021-2032)
Table 31 Middle East and Africa Food Service Revenue (USD Million) By Product (2021-2032)
LIST OF FIGURES
Figure 1. Market Scope
Figure 2. Pricing Forecasts Per Unit, 2023- 2032
Figure 3. Porter’s Five Forces
Figure 4. Global Food Service Market Revenue (USD Million) By Regions (2021-2032)
Figure 5. Global Food Service Market Share (%) By Regions (2023)
Figure 6. North America Food Service Revenue (USD Million) By Country (2021-2032)
Figure 7. United States Food Service Revenue (USD Million) By Country (2021-2032)
Figure 8. Canada Food Service Revenue (USD Million) By Country (2021-2032)
Figure 9. Mexico Food Service Revenue (USD Million) By Country (2021-2032)
Figure 10. Europe Food Service Revenue (USD Million) By Country (2021-2032)
Figure 11. Germany Food Service Revenue (USD Million) By Country (2021-2032)
Figure 12. France Food Service Revenue (USD Million) By Country (2021-2032)
Figure 13. United Kingdom Food Service Revenue (USD Million) By Country (2021-2032)
Figure 14. Spain Food Service Revenue (USD Million) By Country (2021-2032)
Figure 15. Italy Food Service Revenue (USD Million) By Country (2021-2032)
Figure 16. Russia Food Service Revenue (USD Million) By Country (2021-2032)
Figure 17. Rest of Europe Food Service Revenue (USD Million) By Country (2021-2032)
Figure 11. Asia Pacific Food Service Revenue (USD Million) By Country (2021-2032)
Figure 12. China Food Service Revenue (USD Million) By Country (2021-2032)
Figure 13. Japan Food Service Revenue (USD Million) By Country (2021-2032)
Figure 14. India Food Service Revenue (USD Million) By Country (2021-2032)
Figure 15. South Korea Food Service Revenue (USD Million) By Country (2021-2032)
Figure 16. Australia Food Service Revenue (USD Million) By Country (2021-2032)
Figure 17. South East Asia Food Service Revenue (USD Million) By Country (2021-2032)
Figure 18. South America Food Service Revenue (USD Million) By Country (2021-2032)
Figure 19. Brazil Food Service Revenue (USD Million) By Country (2021-2032)
Figure 20. Argentina Food Service Revenue (USD Million) By Country (2021-2032)
Figure 21. Rest of Asia Pacific Food Service Revenue (USD Million) By Country (2021-2032)
Figure 22. Middle East and Africa Food Service Revenue (USD Million) By Region (2021-2032)
Figure 23. Saudi Arabia Food Service Revenue (USD Million) By Region (2021-2032)
Figure 24. The UAE Food Service Revenue (USD Million) By Region (2021-2032)
Figure 25. Rest of Middle East Food Service Revenue (USD Million) By Region (2021-2032)
Figure 26. South Africa Food Service Revenue (USD Million) By Region (2021-2032)
Figure 27. Africa Food Service Revenue (USD Million) By Region (2021-2032)
Figure 28. North America Food Service Revenue (USD Million) By Type (2021-2032)
Figure 29. North America Food Service Revenue (USD Million) By Application (2021-2032)
Figure 30. North America Food Service Revenue (USD Million) By Product (2021-2032)
Figure 31. Europe Food Service Revenue (USD Million) By Type (2021-2032)
Figure 32. Europe Food Service Revenue (USD Million) By Application (2021-2032)
Figure 33. Europe Food Service Revenue (USD Million) By Product (2021-2032)
Figure 34. Asia Pacific Food Service Revenue (USD Million) By Type (2021-2032)
Figure 35. Asia Pacific Food Service Revenue (USD Million) By Application (2021-2032)
Figure 36. Asia Pacific Food Service Revenue (USD Million) By Product (2021-2032)
Figure 37. South America Food Service Revenue (USD Million) By Type (2021-2032)
Figure 38. South America Food Service Revenue (USD Million) By Application (2021-2032)
Figure 39. South America Food Service Revenue (USD Million) By Product (2021-2032)
Figure 40. Middle East and Africa Food Service Revenue (USD Million) By Type (2021-2032)
Figure 41. Middle East and Africa Food Service Revenue (USD Million) By Application (2021-2032)
Figure 42. Middle East and Africa Food Service Revenue (USD Million) By Product (2021-2032)
By Service
Conventional
Centralized
Ready-prepared
Assembly-serve
By Sector
Commercial
Non-commercial
Countries Analyzed
North America (US, Canada, Mexico)
Europe (Germany, UK, France, Spain, Italy, Russia, Rest of Europe)
Asia Pacific (China, India, Japan, South Korea, Australia, South East Asia, Rest of Asia)
South America (Brazil, Argentina, Rest of South America)
Middle East and Africa (Saudi Arabia, UAE, Rest of Middle East, South Africa, Egypt, Rest of Africa)
