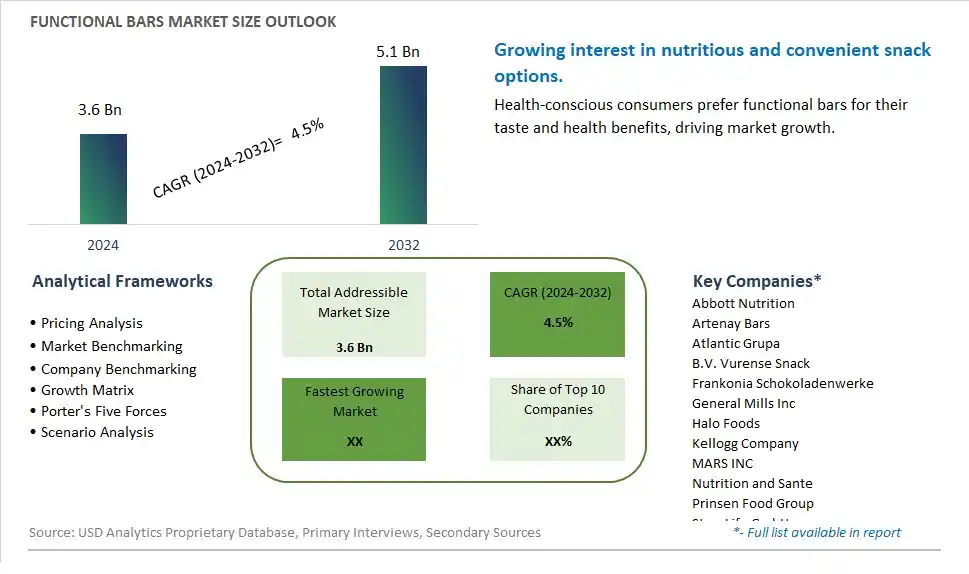
Global Functional Bars Market Size is valued at $3.6 Billion in 2024 and is forecast to register a growth rate (CAGR) of 4.5% to reach $5.1 Billion by 2032.
The global Functional Bars Market Comprehensive Study analyzes and forecasts the market size across 6 regions and 24 countries for diverse segments -By Type (Energy Bars, Protein-rich Bars, Meal Replacement Bars, Low Carbohydrate Bars, Others), By Application (Supermarkets, Independent Retailers, Specialty Stores, Online Stores, Others)
An Introduction to Functional Bars Market
The Functional Bar market in 2024 is experiencing significant growth, driven by the rising demand for convenient and nutritious snack options. Functional bars, enriched with proteins, vitamins, minerals, and other beneficial ingredients, are popular among health-conscious consumers, athletes, and busy professionals. The market benefits from advancements in bar formulation and processing technologies, the growing trend of health and wellness, and the expansion of the functional food sector. Additionally, the increasing awareness of the health benefits and variety of functional bars is driving market growth.
Functional Bars Competitive Landscape
The market report analyses the leading companies in the industry including Abbott Nutrition, Artenay Bars, Atlantic Grupa, B.V. Vurense Snack, Frankonia Schokoladenwerke, General Mills Inc, Halo Foods, Kellogg Company, MARS INC, Nutrition and Sante, Prinsen Food Group, SternLife GmbH, Viba Sweets, and Others.
Functional Bars Market Dynamics
Functional Bar Market Trend: Rising Demand for Nutrient-Dense and Convenient Snacks
The most prominent trend in the Functional Bar Market is the rising demand for nutrient-dense and convenient snacks. As consumers seek quick and healthy snack options, functional bars are gaining popularity for their ability to provide essential nutrients and energy in a portable format. This trend is driven by the growing interest in health and wellness and the need for snacks that support an active lifestyle.
Functional Bar Market Driver: Growth in Health and Wellness Products
The key driver of the Functional Bar Market is the growth in health and wellness products. As more consumers focus on maintaining a healthy lifestyle, there is a higher demand for functional bars that offer specific health benefits, such as protein bars, energy bars, and meal replacement bars. This driver is supported by the trend towards functional foods and beverages that provide targeted nutrition and support overall wellness, driving market growth for functional bars.
Functional Bar Market Opportunity: Innovation in Bar Formulations and Flavors
A significant opportunity in the Functional Bar Market lies in innovation in bar formulations and flavors. By developing new and unique functional bar blends, incorporating functional ingredients such as superfoods, probiotics, and adaptogens, and offering a variety of flavors, companies can attract a broader audience. Offering innovative and nutritious functional bars that cater to diverse dietary preferences and health needs can help expand market reach and increase consumer satisfaction, driving growth in the functional snack segment.
Functional Bars Market Share Analysis- Largest Segment by Type
The Protein-rich Bars segment is the largest in the Functional Bars Market by type. This dominance is driven by the high consumer demand for protein-rich bars as convenient and nutritious snack options. Protein bars are popular among athletes, fitness enthusiasts, and health-conscious consumers for their ability to provide a quick and effective source of protein to support muscle recovery and overall health. The continuous innovation in protein bar formulations, including the introduction of new flavors, plant-based proteins, and fortified options, enhances their appeal. Additionally, the growing trend of high-protein diets and the increasing awareness of the importance of protein in maintaining a healthy lifestyle support the significant market share of the protein-rich bars segment. The extensive availability of protein bars in supermarkets, health food stores, and online platforms further boosts their accessibility to a broad consumer base. The strong consumer preference for convenient and high-protein snacks reinforces the dominant position of the protein-rich bars segment in the market.
Functional Bars Market Share Analysis- Fastest Growing Segment by Application
The Online Stores segment is poised to grow the fastest in the Functional Bars Market by application over the next five years. This rapid growth is driven by the increasing consumer shift towards online shopping and the convenience it offers. E-commerce platforms provide a wide variety of functional bars, including niche and specialty products that may not be readily available in physical stores. The convenience of browsing and purchasing from home, coupled with the option of home delivery, appeals to a broad range of consumers. The COVID-19 pandemic has further accelerated the adoption of online shopping, and this trend continues as consumers appreciate the safety and convenience of having products delivered to their doorstep. Additionally, online retailers often offer competitive pricing, detailed product information, and customer reviews, which further drive consumer confidence and sales. The growth of digital marketing and targeted online advertisements also boosts the visibility and sales of functional bars through e-commerce channels.
Functional Bars Market Segmentation
By Type
Energy Bars
Protein-rich Bars
Meal Replacement Bars
Low Carbohydrate Bars
Others
By Application
Supermarkets
Independent Retailers
Specialty Stores
Online Stores
Others
Countries Analyzed
North America (US, Canada, Mexico)
Europe (Germany, UK, France, Spain, Italy, Russia, Rest of Europe)
Asia Pacific (China, India, Japan, South Korea, Australia, South East Asia, Rest of Asia)
South America (Brazil, Argentina, Rest of South America)
Middle East and Africa (Saudi Arabia, UAE, Rest of Middle East, South Africa, Egypt, Rest of Africa)
Functional Bars Companies Profiled in the Study
Abbott Nutrition
Artenay Bars
Atlantic Grupa
B.V. Vurense Snack
Frankonia Schokoladenwerke
General Mills Inc
Halo Foods
Kellogg Company
MARS INC
Nutrition and Sante
Prinsen Food Group
SternLife GmbH
Viba Sweets
*- List Not Exhaustive
Chapter 1. TABLE OF CONTENTS
Chapter 2. Introduction to Functional Bars Market
2.1. Market Overview
2.2. Key Statistics and Report Highlights
2.3. Scope of the Comprehensive Study
2.3.1. Market Definition
2.3.2 Countries and Regions Covered
2.3.3 Research Objective
2.3.4 Units, Currency, and Conversions
2.3.5 Industry Value Chain
2.4. Key Market Segments
2.5. Key Companies
2.6. Study Period
Chapter 3. Strategic Analysis Review
3.1. Functional Bars Pricing Analysis and Forecast
3.2. Porter’s Five Forces
3.3. Market Ecosystem
3.4. SWOT Analysis
3.5. Regulatory Scenario
3.3. Effects of Inflation, Russia-Ukraine War, moderating economic growth, and other macroeconomic factors
Chapter 4. Competitive Landscape
4.1. Market Share Analysis
4.1.1. Global Functional Bars Market Share by Company, 2023
4.1.2. Product Offerings of Leading Functional Bars Companies
4.2. Market Entropy
4.2.1. New Product Launches in the Industry
4.2.2. Mergers, Acquisitions, Joint ventures, and Partnerships
4.3. Key Strategies and Best Practices
Chapter 5. Global Market Projections: Best, Reference, and Low Case Scenarios
5.1. Growth Analysis- Case Scenario Definitions
5.2. Low Growth Case Scenario Forecasts
5.3. Reference Growth Case Scenario Forecasts
5.4. High Growth Case Scenario Forecasts
Chapter 6. Market Dynamics
6.1. Functional Bars Market Drivers
6.2. Functional Bars Market Challenges
6.6. Functional Bars Market Opportunities
6.4. Functional Bars Market Trends
Chapter 7. Global Functional Bars Market Outlook Trends
7.1. Global Functional Bars Revenue (USD Million) and CAGR (%) by Type (2021-2032)
7.2. Global Functional Bars Revenue (USD Million) and CAGR (%) by Application (2021-2032)
7.3. Global Functional Bars Revenue (USD Million) and CAGR (%) by Product (2021-2032)
By Type
Energy Bars
Protein-rich Bars
Meal Replacement Bars
Low Carbohydrate Bars
Others
By Application
Supermarkets
Independent Retailers
Specialty Stores
Online Stores
Others
Chapter 8. Global Functional Bars Regional Analysis and Outlook
8.1. Global Functional Bars Revenue (USD Million) By Regions (2021- 2032)
8.2. North America Functional Bars Revenue (USD Million) by Country (2021-2032)
8.2.1. United States Functional Bars Regional Analysis and Outlook
8.2.2. Canada Functional Bars Regional Analysis and Outlook
8.2.3. Mexico Functional Bars Regional Analysis and Outlook
8.3. Europe Functional Bars Revenue (USD Million), by Country (2021-2032)
8.3.1. Germany Functional Bars Regional Analysis and Outlook
8.3.2. France Functional Bars Regional Analysis and Outlook
8.3.3. United Kingdom Functional Bars Regional Analysis and Outlook
8.3.4. Spain Functional Bars Regional Analysis and Outlook
8.3.5. Italy Functional Bars Regional Analysis and Outlook
8.3.6. Russia Functional Bars Regional Analysis and Outlook
8.3.7. Rest of Europe Functional Bars Regional Analysis and Outlook
8.4. Asia Pacific Functional Bars Revenue (USD Million) by Country (2021-2032)
8.4.1. China Functional Bars Regional Analysis and Outlook
8.4.2. Japan Functional Bars Regional Analysis and Outlook
8.4.3. India Functional Bars Regional Analysis and Outlook
8.4.4. South Korea Functional Bars Regional Analysis and Outlook
8.4.5. Australia Functional Bars Regional Analysis and Outlook
8.4.6. South East Asia Functional Bars Regional Analysis and Outlook
8.4.7. Rest of Asia Pacific Functional Bars Regional Analysis and Outlook
8.5. South America Functional Bars Revenue (USD Million), by Country (2021-2032)
8.5.1. Brazil Functional Bars Regional Analysis and Outlook
8.5.2. Argentina Functional Bars Regional Analysis and Outlook
8.5.3. Rest of South America Functional Bars Regional Analysis and Outlook
8.6. Middle East and Africa Functional Bars Revenue (USD Million) by Country (2021-2032)
8.6.1. Middle East Functional Bars Regional Analysis and Outlook
8.6.2. Africa Functional Bars Regional Analysis and Outlook
Chapter 9. North America Functional Bars Analysis and Outlook
9.1. North America Functional Bars Revenue (USD Million) by Segments (2021-2032)
9.1.1. North America Functional Bars Revenue (USD Million) by Type (2021-2032)
9.1.2. North America Functional Bars Revenue (USD Million) by Application (2021-2032)
9.1.3. North America Functional Bars Revenue (USD Million) by Product (2021-2032)
By Type
Energy Bars
Protein-rich Bars
Meal Replacement Bars
Low Carbohydrate Bars
Others
By Application
Supermarkets
Independent Retailers
Specialty Stores
Online Stores
Others
Chapter 10. Europe Functional Bars Analysis and Outlook
10.1. Europe Functional Bars Revenue (USD Million), by Segments (USD Million) (2021-2032)
10.1.1. Europe Functional Bars Revenue (USD Million) by Type (2021-2032)
10.1.2. Europe Functional Bars Revenue (USD Million) by Application (2021-2032)
10.1.3. Europe Functional Bars Revenue (USD Million) by Product (2021-2032)
By Type
Energy Bars
Protein-rich Bars
Meal Replacement Bars
Low Carbohydrate Bars
Others
By Application
Supermarkets
Independent Retailers
Specialty Stores
Online Stores
Others
Chapter 11. Asia Pacific Functional Bars Analysis and Outlook
11.1. Asia Pacific Functional Bars Revenue (USD Million), and Revenue (USD Million) by Segments (2021-2032)
11.1.1. Asia Pacific Functional Bars Revenue (USD Million) by Type (2021-2032)
11.1.2. Asia Pacific Functional Bars Revenue (USD Million) by Application (2021-2032)
11.1.3. Asia Pacific Functional Bars Revenue (USD Million) by Product (2021-2032)
By Type
Energy Bars
Protein-rich Bars
Meal Replacement Bars
Low Carbohydrate Bars
Others
By Application
Supermarkets
Independent Retailers
Specialty Stores
Online Stores
Others
Chapter 12. South America Functional Bars Analysis and Outlook
12.1. South America Functional Bars Revenue (USD Million), by Segments (2021-2032)
12.1.1. South America Functional Bars Revenue (USD Million) by Type (2021-2032)
12.1.2. South America Functional Bars Revenue (USD Million) by Application (2021-2032)
12.1.3. South America Functional Bars Revenue (USD Million) by Product (2021-2032)
By Type
Energy Bars
Protein-rich Bars
Meal Replacement Bars
Low Carbohydrate Bars
Others
By Application
Supermarkets
Independent Retailers
Specialty Stores
Online Stores
Others
Chapter 13. Middle East and Africa Functional Bars Analysis and Outlook
13.1. Middle East and Africa Functional Bars Revenue (USD Million), by Segments (2021-2032)
13.1.1. Middle East and Africa Functional Bars Revenue (USD Million) by Type (2021-2032)
13.1.2. Middle East and Africa Functional Bars Revenue (USD Million) by Application (2021-2032)
13.1.3. Middle East and Africa Functional Bars Revenue (USD Million) by Product (2021-2032)
By Type
Energy Bars
Protein-rich Bars
Meal Replacement Bars
Low Carbohydrate Bars
Others
By Application
Supermarkets
Independent Retailers
Specialty Stores
Online Stores
Others
Chapter 14. Functional Bars Company Profiles
14.1 Business Overview
14.2 Product Profiles
14.3 SWOT Profiles
14.5 Recent Developments
14.6 Financial Profile
List of Companies
Abbott Nutrition
Artenay Bars
Atlantic Grupa
B.V. Vurense Snack
Frankonia Schokoladenwerke
General Mills Inc
Halo Foods
Kellogg Company
MARS INC
Nutrition and Sante
Prinsen Food Group
SternLife GmbH
Viba Sweets
15. Methodology and Data Sources
15.1 Customization Offerings
15.2 Subscription Services
15.3 Related Reports
15.4 Publisher Expertise
LIST OF TABLES
Table 1 Market Segmentation Analysis
Table 2 Global Functional Bars Market Share of Leading Companies, 2023
Table 3 Product Offerings of Leading Companies
Table 4 Low Growth Scenario Forecasts
Table 5 Reference Case Growth Scenario
Table 6 High Growth Case Scenario
Table 7 Global Functional Bars Revenue (USD Million) And CAGR (%) By Type (2021-2032)
Table 8 Global Functional Bars Revenue (USD Million) And CAGR (%) By Application (2021-2032)
Table 9 Global Functional Bars Revenue (USD Million) And CAGR (%) By Product (2021-2032)
Table 10 Global Functional Bars Market Revenue (USD Million) By Regions (2021-2032)
Table 11 Global Functional Bars Market Share (%) By Regions (2021-2032)
Table 12 North America Functional Bars Revenue (USD Million) By Country (2021-2032)
Table 13 Europe Functional Bars Revenue (USD Million) By Country (2021-2032)
Table 14 Asia Pacific Functional Bars Revenue (USD Million) By Country (2021-2032)
Table 15 South America Functional Bars Revenue (USD Million) By Country (2021-2032)
Table 16 Middle East and Africa Functional Bars Revenue (USD Million) By Region (2021-2032)
Table 17 North America Functional Bars Revenue (USD Million) By Type (2021-2032)
Table 18 North America Functional Bars Revenue (USD Million) By Application (2021-2032)
Table 19 North America Functional Bars Revenue (USD Million) By Product (2021-2032)
Table 20 Europe Functional Bars Revenue (USD Million) By Type (2021-2032)
Table 21 Europe Functional Bars Revenue (USD Million) By Application (2021-2032)
Table 22 Europe Functional Bars Revenue (USD Million) By Product (2021-2032)
Table 23 Asia Pacific Functional Bars Revenue (USD Million) By Type (2021-2032)
Table 24 Asia Pacific Functional Bars Revenue (USD Million) By Application (2021-2032)
Table 25 Asia Pacific Functional Bars Revenue (USD Million) By Product (2021-2032)
Table 26 South America Functional Bars Revenue (USD Million) By Type (2021-2032)
Table 27 South America Functional Bars Revenue (USD Million) By Application (2021-2032)
Table 28 South America Functional Bars Revenue (USD Million) By Product (2021-2032)
Table 29 Middle East and Africa Functional Bars Revenue (USD Million) By Type (2021-2032)
Table 30 Middle East and Africa Functional Bars Revenue (USD Million) By Application (2021-2032)
Table 31 Middle East and Africa Functional Bars Revenue (USD Million) By Product (2021-2032)
LIST OF FIGURES
Figure 1. Market Scope
Figure 2. Pricing Forecasts Per Unit, 2023- 2032
Figure 3. Porter’s Five Forces
Figure 4. Global Functional Bars Market Revenue (USD Million) By Regions (2021-2032)
Figure 5. Global Functional Bars Market Share (%) By Regions (2023)
Figure 6. North America Functional Bars Revenue (USD Million) By Country (2021-2032)
Figure 7. United States Functional Bars Revenue (USD Million) By Country (2021-2032)
Figure 8. Canada Functional Bars Revenue (USD Million) By Country (2021-2032)
Figure 9. Mexico Functional Bars Revenue (USD Million) By Country (2021-2032)
Figure 10. Europe Functional Bars Revenue (USD Million) By Country (2021-2032)
Figure 11. Germany Functional Bars Revenue (USD Million) By Country (2021-2032)
Figure 12. France Functional Bars Revenue (USD Million) By Country (2021-2032)
Figure 13. United Kingdom Functional Bars Revenue (USD Million) By Country (2021-2032)
Figure 14. Spain Functional Bars Revenue (USD Million) By Country (2021-2032)
Figure 15. Italy Functional Bars Revenue (USD Million) By Country (2021-2032)
Figure 16. Russia Functional Bars Revenue (USD Million) By Country (2021-2032)
Figure 17. Rest of Europe Functional Bars Revenue (USD Million) By Country (2021-2032)
Figure 11. Asia Pacific Functional Bars Revenue (USD Million) By Country (2021-2032)
Figure 12. China Functional Bars Revenue (USD Million) By Country (2021-2032)
Figure 13. Japan Functional Bars Revenue (USD Million) By Country (2021-2032)
Figure 14. India Functional Bars Revenue (USD Million) By Country (2021-2032)
Figure 15. South Korea Functional Bars Revenue (USD Million) By Country (2021-2032)
Figure 16. Australia Functional Bars Revenue (USD Million) By Country (2021-2032)
Figure 17. South East Asia Functional Bars Revenue (USD Million) By Country (2021-2032)
Figure 18. South America Functional Bars Revenue (USD Million) By Country (2021-2032)
Figure 19. Brazil Functional Bars Revenue (USD Million) By Country (2021-2032)
Figure 20. Argentina Functional Bars Revenue (USD Million) By Country (2021-2032)
Figure 21. Rest of Asia Pacific Functional Bars Revenue (USD Million) By Country (2021-2032)
Figure 22. Middle East and Africa Functional Bars Revenue (USD Million) By Region (2021-2032)
Figure 23. Saudi Arabia Functional Bars Revenue (USD Million) By Region (2021-2032)
Figure 24. The UAE Functional Bars Revenue (USD Million) By Region (2021-2032)
Figure 25. Rest of Middle East Functional Bars Revenue (USD Million) By Region (2021-2032)
Figure 26. South Africa Functional Bars Revenue (USD Million) By Region (2021-2032)
Figure 27. Africa Functional Bars Revenue (USD Million) By Region (2021-2032)
Figure 28. North America Functional Bars Revenue (USD Million) By Type (2021-2032)
Figure 29. North America Functional Bars Revenue (USD Million) By Application (2021-2032)
Figure 30. North America Functional Bars Revenue (USD Million) By Product (2021-2032)
Figure 31. Europe Functional Bars Revenue (USD Million) By Type (2021-2032)
Figure 32. Europe Functional Bars Revenue (USD Million) By Application (2021-2032)
Figure 33. Europe Functional Bars Revenue (USD Million) By Product (2021-2032)
Figure 34. Asia Pacific Functional Bars Revenue (USD Million) By Type (2021-2032)
Figure 35. Asia Pacific Functional Bars Revenue (USD Million) By Application (2021-2032)
Figure 36. Asia Pacific Functional Bars Revenue (USD Million) By Product (2021-2032)
Figure 37. South America Functional Bars Revenue (USD Million) By Type (2021-2032)
Figure 38. South America Functional Bars Revenue (USD Million) By Application (2021-2032)
Figure 39. South America Functional Bars Revenue (USD Million) By Product (2021-2032)
Figure 40. Middle East and Africa Functional Bars Revenue (USD Million) By Type (2021-2032)
Figure 41. Middle East and Africa Functional Bars Revenue (USD Million) By Application (2021-2032)
Figure 42. Middle East and Africa Functional Bars Revenue (USD Million) By Product (2021-2032)
By Type
Energy Bars
Protein-rich Bars
Meal Replacement Bars
Low Carbohydrate Bars
Others
By Application
Supermarkets
Independent Retailers
Specialty Stores
Online Stores
Others
Countries Analyzed
North America (US, Canada, Mexico)
Europe (Germany, UK, France, Spain, Italy, Russia, Rest of Europe)
Asia Pacific (China, India, Japan, South Korea, Australia, South East Asia, Rest of Asia)
South America (Brazil, Argentina, Rest of South America)
Middle East and Africa (Saudi Arabia, UAE, Rest of Middle East, South Africa, Egypt, Rest of Africa)
