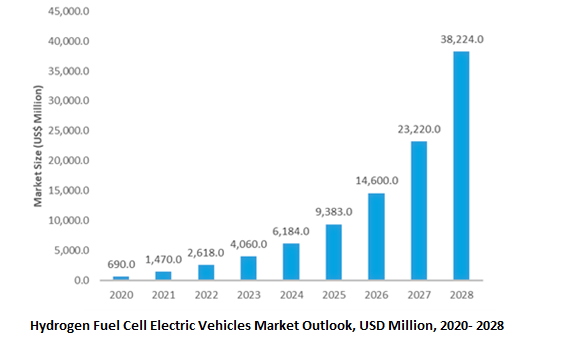
The global Hydrogen Fuel Cell Electric Vehicles Market Size stood at $2.31 billion in 2022 and is poised to register 59.27% growth over the forecast period from 2023 to 2030.
Key market driving forces including Hydrogen Fuel Cell Electric Vehicles provide a zero-emissions option, challenges associated with lithium-ion batteries, government incentives, and investments, leading automotive OEMs foray into the industry, technological advancements in the production of green hydrogen projected Hydrogen fuel cost declines, and others are identified among main market dynamics
Hydrogen Fuel Cell Electric Vehicles Market Analysis
The global Hydrogen Fuel Cell Electric Vehicles market is one of the rapidly growing automotive markets worldwide. The market is in the early growth stage and will be characterized by multiple factors over the forecast period from 2023 to 2030.
The industry is in the early stages of commercial deployment- but offers significant growth potential as an alternative to lithium-ion battery-based vehicles. Hydrogen Fuel Cell Electric Vehicles provide cost-effective and environment-friendly solutions to growing energy needs. The role of governments remains robust in determining the success of Hydrogen Fuel Cell Electric Vehicles, as well as investments in infrastructure, decarbonization policies, and incentives for private companies.
The scale of adoption plays a major role in long-term market success. Scaling up infrastructure deployment must bring hydrogen costs down further. To create a self-sustained market, governments across countries are improving investments in the segment. In particular, heavy-duty vehicles with long daily trips are likely to adopt hydrogen fuel cells, presenting significant long-term growth potential.
Driven by robust market potential and the launch of new models, low- or no-emission vehicles making inroads into Japan, South Korea, Germany, the US, and other countries. These countries extend strong support to Hydrogen Fuel Cell Electric Vehicles, fuelling stations, and supportive infrastructure.
Market Dynamics
Market Trend- Leading automotive OEMs foray into the HFCV industry
Currently, Toyota, Hyundai, and Honda remain the key players operating in the industry. Further, BMW, Audi, Mercedes Benz, General Motors, and others are focusing on developing hydrogen fuel cell models. These companies plan to build plants for fuel cell vehicles including fuel cell buses and storage containers.
Among global companies, Japanese automakers Toyota, Honda, and Nissan continue to invest in R&D in fuel cell vehicles. Further, Chinese automakers such as Foton AUV, Yutong, Yong Man, and Zhongtong, continue to invest in the development of fuel cell vehicles.
Ongoing partnerships between companies and support from regulatory authorities are set to boost the market outlook. For instance, in 2018, a consortium of 11 companies, including Toyota and Nissan, established Japan H2 Mobility, which plans to construct 80 hydrogen refueling stations.
Market Driver- Government incentives and investments
Governments and public transport authorities across countries are tightening emission norms. European countries aim to cut CO2 emissions in 2030 by 30% (compared to 2019 levels). Similarly, the US states target reduction of emissions by 46% lower in 2030 (compared to 2010 levels). China also plans to achieve net-zero emissions by 2060.
To achieve aggressive targets governments, green and blue Hydrogen Fuel Cell Electric Vehicles play a major role, which supports the market outlook. Further, the technology is more scalable compared to BEVs, and accordingly, governments are assessing investments in infrastructure.
Diverse uses of hydrogen fuel cells in the automotive and transportation industry including passenger vehicles, trucks, forklifts, buses, logistic vehicles, e-bikes, marine, and aviation industries encourage governments to invest significantly in the infrastructure.
Market Opportunity- Hydrogen Fuel Cell Electric Vehicles provide a zero-emissions option
HFCVs do not emit any harmful toxins, and thereby, eliminate the costs associated with handling and storing toxic materials like battery acid or diesel. Fuel cell electric vehicles powered by hydrogen are more efficient than conventional internal combustion engine vehicles. Further, the high-power density, better mileage, and superior efficiency of HFCVs compared to hybrid and electric vehicles present significant potential for long-term scalability.
However, Hydrogen Fuel Cell Electric Vehicles face intense competition from battery electric vehicles, hydrogen ICEs, and biofuel ICEs. High Capex requirements for fuel cells and batteries act as deterrents for the market outlook.
Market Segmentation
The global Hydrogen Fuel Cell Electric Vehicles Market is segmented into Types, Technologies, and Countries.
The passenger cars segment dominates the global industry, with a market share of 72.3% during 2022
The number of fuel cellâ€powered passenger cars for road transport is rapidly increasing around the world, in particular, in the Asia Pacific region. In addition to leading players- Toyota and Hyundai, investments from other OEMs are supporting the market growth outlook. Toyota, Grove Hydrogen Automotive, Honda, Hyundai-Kia, Hyundai, Microcab Industries, Mercedes-Benz, BMW, Audi, Riversimple, Nissan, and other companies continue to develop passenger cars.
The global passenger HFCV shipments, which include both retail sales and leases, accounted for 3 thousand units in 2022. High prices of the vehicles coupled with limited hydrogen infrastructure contribute to the low sales figures. However, the market outlook remains robust with strengthening infrastructure, scaling up across markets, and the launch of new models.
Leading models such as Mirai, Grove car, Honda Clarity Fuel Cell, Nexo FCEV, 2-seat sedan, Hyundai ix35 Tucson FCEV, Microcab H2EV, GLC F-CELL, BMW X7, Audi A7 H-Tron, Rasa, e-Bio Fuel Cell, and others are marketed across markets.
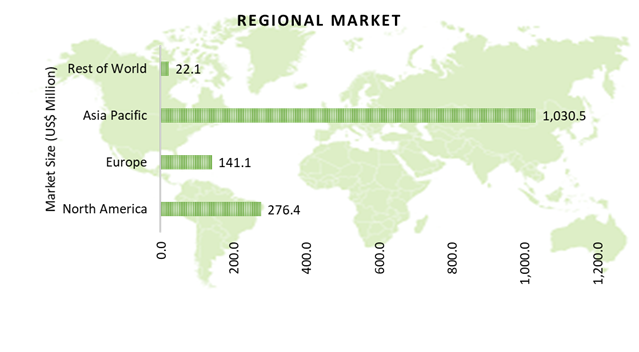
Asia Pacific dominates the global industry for Hydrogen Fuel Cell Electric Vehicles market during the forecast period
Asia Pacific is the largest market for Hydrogen Fuel Cell Electric Vehicles, predominantly driven by government support, new product launches, and large consumer bases. South Korea, China, Japan, and other countries are projected to be the key markets in the Asia Pacific Hydrogen Fuel Cell Electric Vehicles market.
South Korea- The government of South Korea announced large-scale plans for strengthening the refueling infrastructure and boosting the number of HFCVs on the road over the long-term future. The country plans to achieve 6.2 million vehicles by 2040 with 1,200 stations.
In October 2021, Hyundai announced plans to build two new fuel cell plants with $1.1 billion in South Korea to accelerate the hydrogen economy and secure broader global market dominance.
Ongoing partnerships coupled with significant government support to boost the hydrogen fuel cell vehicle market in the country and European regions, significant investment plans support the market. To foster new growth drivers, five of the leading conglomerates Hyundai Motor, SK, POSCO, Hanwha, and Hyosung, and other small to medium-scale companies will invest 43.4 trillion won ($37.3 billion) by 2030 to build supply chains and other infrastructure for hydrogen for a wide range of uses.
To achieve cost-competitiveness, government support remains crucial, and the South Korean government is extending significant support to speed up the country's hydrogen gas-powered vehicle industrial ecosystem in Korea.
Hydrogen Fuel Cell Electric Vehicles Market size outlook by Region
Segmentation
By Type
- Passenger Cars
- Commercial Vehicles
By Application
- Proton Exchange Membrane Fuel Cell
- Phosphoric Acid Fuel Cell
- Others
By Region
- North America (United States, Canada, Mexico)
- Europe (Germany, France, United Kingdom, Spain, Italy, Others)
- Asia Pacific (China, India, Japan, South Korea, Australia, Others)
- Latin America (Brazil, Argentina, Others)
- Middle East and Africa (Saudi Arabia, UAE, Kuwait, Other Middle East, South Africa, Nigeria, Other Africa)
Key Players
Leading companies profiled in the study include-
- Mercedes Benz Group AG
- Audi AG
- Honda Motor Co., Ltd
- General Motors Company
- Toyota Motor Corporation
- Hyundai Motor Group
- Daimler AG
- Ballard Power Systems
- MAN SE
- BMW Group
Hydrogen Fuel Cell Electric Vehicles Market Outlook 2023
1 Market Overview
1.1 Introduction to Hydrogen Fuel Cell Electric Vehicles Market
1.2 Scope of the Study
1.3 Research Objective
1.3.1 Key Market Scope and Segments
1.3.2 Players Covered
1.3.3 Years Considered
2 Executive Summary
2.1 2023 Hydrogen Fuel Cell Electric Vehicles Industry- Market Statistics
3 Market Dynamics
3.1 Market Drivers
3.2 Market Challenges
3.3 Market Opportunities
3.4 Market Trends
4 Market Factor Analysis
4.1 Porter’s Five Forces
4.2 Market Entropy
4.2.1 Global Hydrogen Fuel Cell Electric Vehicles Market Companies with Area Served
4.2.2 Products Offerings Global Hydrogen Fuel Cell Electric Vehicles Market
5 COVID-19 Impact Analysis and Outlook Scenarios
5.1.1 Covid-19 Impact Analysis
5.1.2 Post-COVID-19 Scenario- Low Growth Case
5.1.3 Post-COVID-19 Scenario- Reference Growth Case
5.1.4 Post-COVID-19 Scenario- Low Growth Case
6 Global Hydrogen Fuel Cell Electric Vehicles Market Trends
6.1 Global Hydrogen Fuel Cell Electric Vehicles Revenue (USD Million) and CAGR (%) by Type (2018-2028)
6.2 Global Hydrogen Fuel Cell Electric Vehicles Revenue (USD Million) and CAGR (%) by Applications (2018-2028)
6.3 Global Hydrogen Fuel Cell Electric Vehicles Revenue (USD Million) and CAGR (%) by Regions (2018-2028)
7 Global Hydrogen Fuel Cell Electric Vehicles Market Revenue (USD Million) by Type, and Applications (2018-2022)
7.1 Global Hydrogen Fuel Cell Electric Vehicles Revenue (USD Million) by Type (2018-2022)
7.1.1 Global Hydrogen Fuel Cell Electric Vehicles Revenue (USD Million), Market Share (%) by Type (2018-2022)
7.2 Global Hydrogen Fuel Cell Electric Vehicles Revenue (USD Million) by Applications (2018-2022)
7.2.1 Global Hydrogen Fuel Cell Electric Vehicles Revenue (USD Million), Market Share (%) by Applications (2018-2022)
8 Global Hydrogen Fuel Cell Electric Vehicles Development Regional Status and Outlook
8.1 Global Hydrogen Fuel Cell Electric Vehicles Revenue (USD Million) By Regions (2018-2022)
8.2 North America Hydrogen Fuel Cell Electric Vehicles Revenue (USD Million) by Type, and Application (2018-2022)
8.2.1 North America Hydrogen Fuel Cell Electric Vehicles Revenue (USD Million) by Country (2018-2022)
8.2.2 North America Hydrogen Fuel Cell Electric Vehicles Revenue (USD Million) by Type (2018-2022)
8.2.3 North America Hydrogen Fuel Cell Electric Vehicles Revenue (USD Million) by Applications (2018-2022)
8.3 Europe Hydrogen Fuel Cell Electric Vehicles Revenue (USD Million), by Type, and Applications (USD Million) (2018-2022)
8.3.1 Europe Hydrogen Fuel Cell Electric Vehicles Revenue (USD Million), by Country (2018-2022)
8.3.2 Europe Hydrogen Fuel Cell Electric Vehicles Revenue (USD Million) by Type (2018-2022)
8.3.3 Europe Hydrogen Fuel Cell Electric Vehicles Revenue (USD Million) by Applications (2018-2022)
8.4 Asia Pacific Hydrogen Fuel Cell Electric Vehicles Revenue (USD Million), and Revenue (USD Million) by Type, and Applications (2018-2022)
8.4.1 Asia Pacific Hydrogen Fuel Cell Electric Vehicles Revenue (USD Million) by Country (2018-2022)
8.4.2 Asia Pacific Hydrogen Fuel Cell Electric Vehicles Revenue (USD Million) by Type (2018-2022)
8.4.3 Asia Pacific Hydrogen Fuel Cell Electric Vehicles Revenue (USD Million) by Applications (2018-2022)
8.5 South America Hydrogen Fuel Cell Electric Vehicles Revenue (USD Million), by Type, and Applications (2018-2022)
8.5.1 South America Hydrogen Fuel Cell Electric Vehicles Revenue (USD Million), by Country (2018-2022)
8.5.2 South America Hydrogen Fuel Cell Electric Vehicles Revenue (USD Million) by Type (2018-2022)
8.5.3 South America Hydrogen Fuel Cell Electric Vehicles Revenue (USD Million) by Applications (2018-2022)
8.6 Middle East and Africa Hydrogen Fuel Cell Electric Vehicles Revenue (USD Million), by Type, Technology, Application, Thickness (2018-2022)
8.6.1 Middle East and Africa Hydrogen Fuel Cell Electric Vehicles Revenue (USD Million) by Country (2018-2022)
8.6.2 Middle East and Africa Hydrogen Fuel Cell Electric Vehicles Revenue (USD Million) by Type (2018-2022)
8.6.3 Middle East and Africa Hydrogen Fuel Cell Electric Vehicles Revenue (USD Million) by Applications (2018-2022)
9 Company Profiles
10 Global Hydrogen Fuel Cell Electric Vehicles Market Revenue (USD Million), by Type, and Applications (2023-2028)
10.1 Global Hydrogen Fuel Cell Electric Vehicles Revenue (USD Million) and Market Share (%) by Type (2023-2028)
10.1.1 Global Hydrogen Fuel Cell Electric Vehicles Revenue (USD Million), and Market Share (%) by Type (2023-2028)
10.2 Global Hydrogen Fuel Cell Electric Vehicles Revenue (USD Million) and Market Share (%) by Applications (2023-2028)
10.2.1 Global Hydrogen Fuel Cell Electric Vehicles Revenue (USD Million), and Market Share (%) by Applications (2023-2028)
11 Global Hydrogen Fuel Cell Electric Vehicles Development Regional Status and Outlook Forecast
11.1 Global Hydrogen Fuel Cell Electric Vehicles Revenue (USD Million) By Regions (2023-2028)
11.2 North America Hydrogen Fuel Cell Electric Vehicles Revenue (USD Million) by Type, and Applications (2023-2028)
11.2.1 North America Hydrogen Fuel Cell Electric Vehicles Revenue (USD) Million by Country (2023-2028)
11.2.2 North America Hydrogen Fuel Cell Electric Vehicles Revenue (USD Million), by Type (2023-2028)
11.2.3 North America Hydrogen Fuel Cell Electric Vehicles Revenue (USD Million), Market Share (%) by Applications (2023-2028)
11.3 Europe Hydrogen Fuel Cell Electric Vehicles Revenue (USD Million), by Type, and Applications (2023-2028)
11.3.1 Europe Hydrogen Fuel Cell Electric Vehicles Revenue (USD Million), by Country (2023-2028)
11.3.2 Europe Hydrogen Fuel Cell Electric Vehicles Revenue (USD Million), by Type (2023-2028)
11.3.3 Europe Hydrogen Fuel Cell Electric Vehicles Revenue (USD Million), by Applications (2023-2028)
11.4 Asia Pacific Hydrogen Fuel Cell Electric Vehicles Revenue (USD Million) by Type, and Applications (2023-2028)
11.4.1 Asia Pacific Hydrogen Fuel Cell Electric Vehicles Revenue (USD Million), by Country (2023-2028)
11.4.2 Asia Pacific Hydrogen Fuel Cell Electric Vehicles Revenue (USD Million), by Type (2023-2028)
11.4.3 Asia Pacific Hydrogen Fuel Cell Electric Vehicles Revenue (USD Million), by Applications (2023-2028)
11.5 South America Hydrogen Fuel Cell Electric Vehicles Revenue (USD Million), by Type, and Applications (2023-2028)
11.5.1 South America Hydrogen Fuel Cell Electric Vehicles Revenue (USD Million), by Country (2023-2028)
11.5.2 South America Hydrogen Fuel Cell Electric Vehicles Revenue (USD Million), by Type (2023-2028)
11.5.3 South America Hydrogen Fuel Cell Electric Vehicles Revenue (USD Million), by Applications (2023-2028)
11.6 Middle East and Africa Hydrogen Fuel Cell Electric Vehicles Revenue (USD Million), by Type, and Applications (2023-2028)
11.6.1 Middle East and Africa Hydrogen Fuel Cell Electric Vehicles Revenue (USD Million), by Region (2023-2028)
11.6.2 Middle East and Africa Hydrogen Fuel Cell Electric Vehicles Revenue (USD Million), by Type (2023-2028)
11.6.3 Middle East and Africa Hydrogen Fuel Cell Electric Vehicles Revenue (USD Million), by Applications (2023-2028)
12 Methodology and Data Sources
12.1 Methodology/Research Approach
12.1.1 Research Programs/Design
12.1.2 Market Size Estimation
12.1.3 Market Breakdown and Data Triangulation
12.2 Data Sources
12.2.1 Secondary Sources
12.2.2 Primary Sources
12.3 Disclaimer
List Of Tables
Table 1 Market Segmentation Analysis
Table 2 Global Hydrogen Fuel Cell Electric Vehicles Market Companies with Areas Served
Table 3 Products Offerings Global Hydrogen Fuel Cell Electric Vehicles Market
Table 4 Low Growth Scenario Forecasts
Table 5 Reference Case Growth Scenario
Table 6 High Growth Case Scenario
Table 7 Global Hydrogen Fuel Cell Electric Vehicles Revenue (USD Million) And CAGR (%) By Type (2018-2028)
Table 8 Global Hydrogen Fuel Cell Electric Vehicles Revenue (USD Million) And CAGR (%) By Applications (2018-2028)
Table 9 Global Hydrogen Fuel Cell Electric Vehicles Revenue (USD Million) And CAGR (%) By Regions (2018-2028)
Table 10 Global Hydrogen Fuel Cell Electric Vehicles Revenue (USD Million) By Type (2018-2022)
Table 11 Global Hydrogen Fuel Cell Electric Vehicles Revenue Market Share (%) By Type (2018-2022)
Table 12 Global Hydrogen Fuel Cell Electric Vehicles Revenue (USD Million) By Applications (2018-2022)
Table 13 Global Hydrogen Fuel Cell Electric Vehicles Revenue Market Share (%) By Applications (2018-2022)
Table 14 Global Hydrogen Fuel Cell Electric Vehicles Market Revenue (USD Million) By Regions (2018-2022)
Table 15 Global Hydrogen Fuel Cell Electric Vehicles Market Share (%) By Regions (2018-2022)
Table 16 North America Hydrogen Fuel Cell Electric Vehicles Revenue (USD Million) By Country (2018-2022)
Table 17 North America Hydrogen Fuel Cell Electric Vehicles Revenue (USD Million) By Type (2018-2022)
Table 18 North America Hydrogen Fuel Cell Electric Vehicles Revenue (USD Million) By Applications (2018-2022)
Table 19 Europe Hydrogen Fuel Cell Electric Vehicles Revenue (USD Million) By Country (2018-2022)
Table 20 Europe Hydrogen Fuel Cell Electric Vehicles Revenue (USD Million) By Type (2018-2022)
Table 21 Europe Hydrogen Fuel Cell Electric Vehicles Revenue (USD Million) By Applications (2018-2022)
Table 22 Asia Pacific Hydrogen Fuel Cell Electric Vehicles Revenue (USD Million) By Country (2018-2022)
Table 23 Asia Pacific Hydrogen Fuel Cell Electric Vehicles Revenue (USD Million) By Type (2018-2022)
Table 24 Asia Pacific Hydrogen Fuel Cell Electric Vehicles Revenue (USD Million) By Applications (2018-2022)
Table 25 South America Hydrogen Fuel Cell Electric Vehicles Revenue (USD Million) By Country (2018-2022)
Table 26 South America Hydrogen Fuel Cell Electric Vehicles Revenue (USD Million) By Type (2018-2022)
Table 27 South America Hydrogen Fuel Cell Electric Vehicles Revenue (USD Million) By Applications (2018-2022)
Table 28 Middle East and Africa Hydrogen Fuel Cell Electric Vehicles Revenue (USD Million) By Region (2018-2022)
Table 29 Middle East and Africa Hydrogen Fuel Cell Electric Vehicles Revenue (USD Million) By Type (2018-2022)
Table 30 Middle East and Africa Hydrogen Fuel Cell Electric Vehicles Revenue (USD Million) By Applications (2018-2022)
Table 31 Financial Analysis
Table 32 Global Hydrogen Fuel Cell Electric Vehicles Revenue (USD Million) By Type (2023-2028)
Table 33 Global Hydrogen Fuel Cell Electric Vehicles Revenue Market Share (%) By Type (2023-2028)
Table 34 Global Hydrogen Fuel Cell Electric Vehicles Revenue (USD Million) By Applications (2023-2028)
Table 35 Global Hydrogen Fuel Cell Electric Vehicles Revenue Market Share (%) By Applications (2023-2028)
Table 36 Global Hydrogen Fuel Cell Electric Vehicles Market Revenue (USD Million), And Revenue (USD Million) By Regions (2023-2028)
Table 37 North America Hydrogen Fuel Cell Electric Vehicles Revenue (USD)By Country (2023-2028)
Table 38 North America Hydrogen Fuel Cell Electric Vehicles Revenue (USD Million) By Type (2023-2028)
Table 39 North America Hydrogen Fuel Cell Electric Vehicles Revenue (USD Million) By Applications (2023-2028)
Table 40 Europe Hydrogen Fuel Cell Electric Vehicles Revenue (USD Million) By Country (2023-2028)
Table 41 Europe Hydrogen Fuel Cell Electric Vehicles Revenue (USD Million) By Type (2023-2028)
Table 42 Europe Hydrogen Fuel Cell Electric Vehicles Revenue (USD Million) By Applications (2023-2028)
Table 43 Asia Pacific Hydrogen Fuel Cell Electric Vehicles Revenue (USD Million) By Country (2023-2028)
Table 44 Asia Pacific Hydrogen Fuel Cell Electric Vehicles Revenue (USD Million) By Type (2023-2028)
Table 45 Asia Pacific Hydrogen Fuel Cell Electric Vehicles Revenue (USD Million) By Applications (2023-2028)
Table 46 South America Hydrogen Fuel Cell Electric Vehicles Revenue (USD Million) By Country (2023-2028)
Table 47 South America Hydrogen Fuel Cell Electric Vehicles Revenue (USD Million) By Type (2023-2028)
Table 48 South America Hydrogen Fuel Cell Electric Vehicles Revenue (USD Million) By Applications (2023-2028)
Table 49 Middle East and Africa Hydrogen Fuel Cell Electric Vehicles Revenue (USD Million) By Region (2023-2028)
Table 50 Middle East and Africa Hydrogen Fuel Cell Electric Vehicles Revenue (USD Million) By Region (2023-2028)
Table 51 Middle East and Africa Hydrogen Fuel Cell Electric Vehicles Revenue (USD Million) By Type (2023-2028)
Table 52 Middle East and Africa Hydrogen Fuel Cell Electric Vehicles Revenue (USD Million) By Applications (2023-2028)
Table 53 Research Programs/Design for This Report
Table 54 Key Data Information from Secondary Sources
Table 55 Key Data Information from Primary Sources
List Of Figures
Figure 1 Market Scope
Figure 2 Porter’s Five Forces
Figure 3 Global Hydrogen Fuel Cell Electric Vehicles Revenue (USD Million) By Type (2018-2022)
Figure 4 Global Hydrogen Fuel Cell Electric Vehicles Revenue Market Share (%) By Type (2022)
Figure 5 Global Hydrogen Fuel Cell Electric Vehicles Revenue (USD Million) By Applications (2018-2022)
Figure 6 Global Hydrogen Fuel Cell Electric Vehicles Revenue Market Share (%) By Applications (2022)
Figure 7 Global Hydrogen Fuel Cell Electric Vehicles Market Revenue (USD Million) By Regions (2018-2022)
Figure 8 Global Hydrogen Fuel Cell Electric Vehicles Market Share (%) By Regions (2022)
Figure 9 North America Hydrogen Fuel Cell Electric Vehicles Revenue (USD Million) By Country (2018-2022)
Figure 10 North America Hydrogen Fuel Cell Electric Vehicles Revenue (USD Million) By Type (2018-2022)
Figure 11 North America Hydrogen Fuel Cell Electric Vehicles Revenue (USD Million) By Applications (2018-2022)
Figure 12 Europe Hydrogen Fuel Cell Electric Vehicles Revenue (USD Million) By Country (2018-2022)
Figure 13 Europe Hydrogen Fuel Cell Electric Vehicles Revenue (USD Million) By Type (2018-2022)
Figure 14 Europe Hydrogen Fuel Cell Electric Vehicles Revenue (USD Million) By Applications (2018-2022)
Figure 15 Asia Pacific Hydrogen Fuel Cell Electric Vehicles Revenue (USD Million) By Country (2018-2022)
Figure 16 Asia Pacific Hydrogen Fuel Cell Electric Vehicles Revenue (USD Million) By Type (2018-2022)
Figure 17 Asia Pacific Hydrogen Fuel Cell Electric Vehicles Revenue (USD Million) By Applications (2018-2022)
Figure 18 South America Hydrogen Fuel Cell Electric Vehicles Revenue (USD Million) By Country (2018-2022)
Figure 19 South America Hydrogen Fuel Cell Electric Vehicles Revenue (USD Million) By Type (2018-2022)
Figure 20 South America Hydrogen Fuel Cell Electric Vehicles Revenue (USD Million) By Applications (2018-2022)
Figure 21 Middle East and Africa Hydrogen Fuel Cell Electric Vehicles Revenue (USD Million) By Region (2018-2022)
Figure 22 Middle East and Africa Hydrogen Fuel Cell Electric Vehicles Revenue (USD Million) By Type (2018-2022)
Figure 23 Middle East and Africa Hydrogen Fuel Cell Electric Vehicles Revenue (USD Million) By Applications (2018-2022)
Figure 24 Global Hydrogen Fuel Cell Electric Vehicles Revenue (USD Million) By Type (2023-2028)
Figure 25 Global Hydrogen Fuel Cell Electric Vehicles Revenue Market Share (%) By Type (2028)
Figure 26 Global Hydrogen Fuel Cell Electric Vehicles Revenue (USD Million) By Applications (2023-2028)
Figure 27 Global Hydrogen Fuel Cell Electric Vehicles Revenue Market Share (%) By Applications (2028)
Figure 28 Global Hydrogen Fuel Cell Electric Vehicles Market Revenue (USD Million) By Regions (2023-2028)
Figure 29 North America Hydrogen Fuel Cell Electric Vehicles Revenue (USD Million) By Country (2023-2028)
Figure 30 North America Hydrogen Fuel Cell Electric Vehicles Revenue (USD Million) By Type (2023-2028)
Figure 31 North America Hydrogen Fuel Cell Electric Vehicles Revenue (USD Million) By Applications (2023-2028)
Figure 32 Europe Hydrogen Fuel Cell Electric Vehicles Revenue (USD Million) By Country (2023-2028)
Figure 33 Europe Hydrogen Fuel Cell Electric Vehicles Revenue (USD Million) By Type (2023-2028)
Figure 34 Europe Hydrogen Fuel Cell Electric Vehicles Revenue (USD Million) By Applications (2023-2028)
Figure 35 Asia Pacific Hydrogen Fuel Cell Electric Vehicles Revenue (USD Million) By Country (2023-2028)
Figure 36 Asia Pacific Hydrogen Fuel Cell Electric Vehicles Revenue (USD Million) By Type (2023-2028)
Figure 37 Asia Pacific Hydrogen Fuel Cell Electric Vehicles Revenue (USD Million) By Applications (2023-2028)
Figure 38 South America Hydrogen Fuel Cell Electric Vehicles Revenue (USD Million) By Country (2023-2028)
Figure 39 South America Hydrogen Fuel Cell Electric Vehicles Revenue (USD Million) By Type (2023-2028)
Figure 40 South America Hydrogen Fuel Cell Electric Vehicles Revenue (USD Million) By Applications (2023-2028)
Figure 41 Middle East and Africa Hydrogen Fuel Cell Electric Vehicles Revenue (USD Million) By Region (2023-2028)
Figure 42 Middle East and Africa Hydrogen Fuel Cell Electric Vehicles Revenue (USD Million) By Region (2023-2028)
Figure 43 Middle East and Africa Hydrogen Fuel Cell Electric Vehicles Revenue (USD Million) By Type (2023-2028)
Figure 44 Middle East and Africa Hydrogen Fuel Cell Electric Vehicles Revenue (USD Million) By Applications (2023-2028)
Figure 45 Bottom-Up and Top-Down Approaches For This Report
Figure 46 Data Triangulation
