
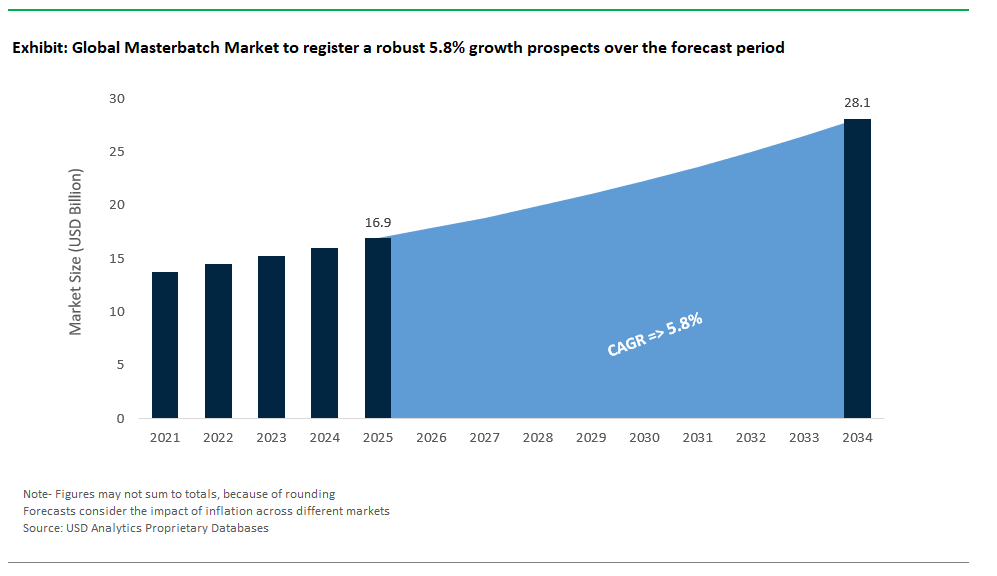
The world masterbatch market is set for a definite growth over 2019-2025, to hit $16.9 billion by 2025 and $28.1 billion in 2034, demonstrating a robust 5.8% CAGR. This strong growth confirms the pivotal role of the masterbatch business in the dynamic polymer value chain. With these advanced colors, compositions and compounds being increasingly sought after to provide bright colors, critical additives and functional properties to plastics, this market is poised to continue to be a vital part of markets such as packaging, automotive, electronics and consumer goods.
Masterbatches are essential formulation of concentrated pigments, additives, and a carrier polymer which enables perfect color matching, perfect dispersion of additives and easy processing in plastic products. The use of masterbatches instead direct powder blending processes provides important benefits, such as better dispersion, minimized dust, smooth processability and end product quality. Color masterbatches (white, black and custom colors), additive masterbatches (UV stabilizers, flame retardants, antimicrobials, antistatic agents and processing aids), and filler masterbatches collectively underpin a market that is benefiting from the long-term transition from metal to plastics in automotive, the surge in the packaging industry, consumer demands spurred by the world's urbanization, and environmental regulations that continue to ratchet up. New developments in bio-based, biodegradable and performance-enhancing additive masterbatches place this industry at the leading edge of the move towards a circular and sustainable plastics economy.
Innovations and strategic expansions continue to shape the global masterbatch industry landscape, along with a greater emphasis on sustainability initiatives. Clariant, Ampacet Corporation, and Cabot Corporation and other big players continue to play a major role in the development of additive masterbatches, upscaling the overall efficacy of each additive the likes of UV resistance, flame retardancy and antimicrobial properties. Recent investments highlight the industry’s endorsement for extended shelf life and superior product properties.- USD Analytics research analyst Mohan Kumar.
Ag productivity received a significant sales boost in April 2025 when Avient Corporation introduced a new range of UV stabilized additive masterbatches for greenhouse films that help enhance crop protection and film longevity. Clariant reinforced its position in the biodegradable additive masterbatch market in March 2025 by launching a range of biodegradable additive masterbatches in response to a rising demand for sustainable and environmentally friendly packaging solutions due to increased concerns for the environment and implementation of strict rules and regulations. Ampacet has been especially prolific; one of the first developments was in February of 2025 when the firm introduced an antimicrobial additive masterbatch that helped improve food packaging safety and prolong shelf life and this was followed later in the year by Ampacet’s introduction of the LIAD Smart color automation system that reflected an industry move towards precision and process automation.
Innovative movers with a forward-thinking approach to antimicrobial protection also include Copperprotek, a pioneer which has developed copper-infused masterbatches to ensure food safety in packaging. Cabot Corporation’s recent launch of REPLASBLAK universal circular black masterbatches carrying ISCC PLUS certification has established a new level of traceable circularity in polymer colorants. This announcement of the launch of graphene-enhanced masterbatches by Black Swan Graphene, and the collaboration with Hubron International, highlights the trend toward high-performance and advanced materials.
In addition, strategic capacity additions also remain critical in the industry: LyondellBasell’s new PP compounding line in China (June 2024) to serve Asia’s burgeoning automotive sector, and Modern Dispersions, Inc. expansion in Georgia (February 2024) expand North American production of masterbatches and compounds.
The global masterbatch market is undergoing a significant transformation, with sustainability emerging as the dominant force driving R&D, product launches, and business strategies. Regulatory frameworks such as plastic taxes and Extended Producer Responsibility (EPR) schemes are compelling the adoption of recycled-content and recyclable plastics. Over 80% of trade regulations in 2024 target plastic waste reduction through recycling, according to World Bank data, putting pressure on manufacturers to integrate circular solutions and minimize environmental impact.
Market leaders are investing heavily in bio-based, biodegradable, and recyclable masterbatches, ensuring that their offerings meet both the visual and functional needs of clients without impeding downstream recycling. Examples like Cabot Corporation’s REPLASBLAK masterbatches with ISCC PLUS certification and Clariant’s biodegradable additive solutions highlight industry commitment to traceable and renewable content. These efforts are sparking innovation across the value chain from raw material sourcing to energy-efficient manufacturing and end-of-life design helping to establish closed-loop systems in plastics manufacturing.
The automotive industry’s evolution, especially the surge in electric vehicle (EV) production, presents a major growth opportunity for the masterbatch market. With vehicle manufacturers aggressively replacing metals with plastics for lightweighting, fuel efficiency, and extended EV range, the demand for advanced masterbatches is soaring. Plastics now dominate in critical applications such as battery enclosures (requiring flame-retardant masterbatches), interior trims, and under-hood components.
High-performance masterbatches are increasingly necessary for precision in color matching, functional performance, and the unique needs of automotive wiring and cable insulation in EVs. BloombergNEF reports that the global EV share in new car sales is accelerating rapidly, driving further demand for specialty masterbatches in lightweight, thermally resistant, and high-strength polymers. This trend is supported by the adoption of new materials such as fluoropolymers and silicones and exacting standards for color, safety, and processability in automotive plastics.
The masterbatch market’s leadership is defined by global innovators and regional champions, each leveraging R&D, product differentiation, and sustainability-focused expansion to capture share.
Avient Corporation, a leader in material solutions, is expanding its color and additive masterbatch services and product portfolio to wire and cable applications. With a robust R&D pipeline and portfolio anchored in the popular OnColor™ and Impress™ colorants lines as well as a wide range of high-performance additives, Avient is especially concentrating on sustainability as part of its strategy — demonstrated by product launches like UV-resistant additives for agricultural films made possible by its April 2025 launch, investments in bio-based offerings. The company’s move has clear emphasis on application-focused high-performance polymer solutions for automotive and healthcare and packaging.
Technical service is all about meeting the needs of customers and as this market continues to grow and demands an increasing number of specialized masterbatches, we remain dedicated in providing expert guidance, Richard Garber, director of research & development/quality & technical service – Americas, says. Antimicrobial additive masterbatches for food-packaging that will launch in 2025 and the LIAD Smart color automation system highlight Ampacet’s twin strategy: product performance and process efficiency improvemnt. With its firm commitment to circularity and functional additives, Ampacet is growing its global business by building strong market positions in the packaging, automotive and consumer goods industries.
At the leading edge of sustainable masterbatch development stands Clariant AG, focusing on R&D and advanced additive chemistry. Its biodegradable additive masterbatches and PFAS-free products are in close connection with increasingly stricter regulations and people's expectations of sustainable plastics. As a committed supporter of the circular economy, Clariant is focusing their R&D efforts on developing sustainable, value chain paving glass and carbon fiber high-performance composites that will drive the lighter and more fuel-efficient mobility of the future.
LyondellBasell Industries is using its position as a leader in plastics and chemicals to provide a complete range of polypropylene and polyethylene masterbatches. The company’s recent investment and expansion in China and concentration in marine and automotive applications in collaboration with Polynt are an articulation of its commitment to low-carbon, circular business solutions and global market leadership.
Plastiblends India Ltd. expands its local and global presence with custom colour, additive, and filler masterbatches based on customers’ need for packaging, automotive and consumer goods. Its proprietary dispersion tech and compatibility with monomaterial recycling solutions make it a critical enabler in the drive to a more circular and environmentally friendly plastics economy, particularly in the fast-growing Indian manufacturing sector.
The strongest segment by type in 2025 is color masterbatch, claiming a major share of 42%. This segment’s growth is justified by the robust demand for vibrant, consistent, and easily customizable colors for a major part of plastic applications in packaging, consumer goods, and automotive manufacturing, enabling brand differentiation and meeting end-users’ aesthetic and quality expectations. Additive masterbatch follows with a 28% share, and its fast growth is driven by growing plastics users’ demand for performance enhancements, including UV stabilization, flame retardancy, and antioxidant properties, which ensure extended product life cycles and compliance with increasing sustainability requirements. Filler masterbatch maintains a significant share of the market, making it possible to reduce pricing and improve mechanical properties in CaCO3 applications in constructions and critical applications requiring low price points. Combination masterbatch occupies a rapidly increasing niche, integrating both color and performance additives into a single pellet to provide essential visual and functional benefits in one package.
The major end-user is packaging, claiming 38% of the market. Growth is driven by the rapid expansion in flexible and rigid food, beverage, personal care and industrial packaging applications which require accurate color and additive masterbatches for branding, shelf life and product integrity. Automotive & transportation is second biggest masterbatches user accounting to 18% share for lightweighting, UV protection, and aesthetics on dashboards, bumpers, and trims. Building & construction, consumer goods and agriculture are also high potential sectors which use the various types of masterbatch for various applications like pipes, profiles, toys, furniture, irrigation films etc. High-value, fast-growing niche applications including healthcare, textiles and electrical/electronics for specialty and high-purity masterbatches for medical devices, conductive polymers and advanced fibres, confirm the continued expansion of end-use markets for masterbatch solutions.
.png)
China continues to lead the global masterbatch market, propelled by vast investments in manufacturing, infrastructure, and rapid industrialization. The country’s demand for plastics and masterbatches is unmatched, with sectors like packaging, automotive, electronics, and construction driving high-volume consumption. Stringent environmental regulations are pushing Chinese manufacturers to adopt high-performance, eco-friendly, and compliant masterbatch solutions especially those suitable for recycled plastics. Strategic government support and foreign investment, such as LyondellBasell’s new PP compounding facility in Dalian, fuel local capacity and technology advancement, ensuring China remains at the forefront of both demand and innovation.
R&D in China is accelerating as companies work to create localized, application-specific formulations to serve diverse end-use industries. The domestic market’s sheer scale attracts foreign partnerships and joint ventures, while local firms increase self-reliance and export capacity. China’s emphasis on sustainable plastics, compliance with global standards, and investment in advanced processability further cement its leadership role in the masterbatch industry. These dynamics allow China to both set trends and supply the world with a full spectrum of color, additive, and filler masterbatches for every application.
The United States commands a significant presence in the global masterbatch market thanks to its robust innovation ecosystem and stringent regulatory environment. Leading producers such as Avient, Ampacet, Cabot, and Americhem drive continuous R&D to meet evolving needs in packaging, automotive, healthcare, and electronics. The push for sustainable solutions is evident in the adoption of bio-based, recyclable, and low-VOC masterbatches, catalyzed by EPA standards and consumer demand for greener plastics. Modern Dispersions' expansion in Georgia and Americhem’s innovations for medical devices showcase the sector’s strong domestic manufacturing base.
U.S. companies excel at tailoring masterbatch products to highly specialized applications, from flame-retardant compounds for automotive interiors to specialty solutions for regulated medical devices. End-users benefit from access to a wide range of multi-functional, high-performance masterbatches engineered for safety, longevity, and advanced processing. The focus on sustainable materials, regulatory compliance, and product performance ensures that the U.S. continues to set benchmarks for global masterbatch innovation and market leadership across all major industries.
Germany stands out as a center of excellence in masterbatch technology, blending precision engineering with strong commitments to sustainability and regulatory compliance. German firms such as Clariant and Evonik are global leaders in producing advanced color and additive masterbatches for high-value applications, particularly in premium automotive manufacturing, advanced packaging, and medical devices. Heavy R&D investment supports the creation of sustainable masterbatches, such as those compatible with circular economy initiatives and designed for recyclability.
Government incentives for industrial innovation and strict adherence to EU standards (including REACH) encourage manufacturers to continually develop safe, high-performance, and eco-friendly solutions. Germany’s automotive industry, renowned for luxury and technical prowess, relies on masterbatch technology for lightweighting, durability, and aesthetic appeal in vehicle interiors and exteriors. The country’s well-developed industrial ecosystem enables efficient scaling and integration of new masterbatch products into sectors demanding both functionality and strict compliance.
India is rapidly evolving into a key growth hub for masterbatch demand and production. The country’s accelerating industrialization, rising vehicle sales, and a booming packaging sector fuel strong consumption across both flexible and rigid plastics. The “Make in India” initiative, combined with significant FDI, is spurring local production of both masterbatches and their raw materials, fostering technology transfer, capacity building, and global competitiveness. Domestic manufacturers such as Plastiblends are expanding output, while international players invest to serve the region’s expanding needs.
India’s market is characterized by a diverse range of end-users from packaging and automotive to agriculture and consumer goods all requiring customized solutions for performance and cost-efficiency. As regulatory expectations evolve and environmental consciousness grows, there’s a clear shift toward advanced, high-performance, and sustainable masterbatches. Strategic focus on quality, reliability, and compliance is positioning India as not only a leading consumer but also a regional exporter of specialty and commodity masterbatch products.
Japan’s masterbatch market reflects the country’s renowned focus on reliability, technological sophistication, and strict quality standards. Japanese producers specialize in highly engineered masterbatches, supporting the automotive, consumer electronics, and high-tech sectors with specialty color, additive, and functional masterbatches. Significant investment in R&D ensures masterbatches deliver unique properties such as enhanced barrier performance, special optical effects, and advanced lightweighting for use in demanding OEM and electronics applications.
The healthcare and medical device sectors in Japan further drive the need for ultra-pure, high-performance masterbatches that comply with rigorous safety standards. Continuous improvement and attention to detail keep Japanese suppliers at the forefront of innovation. As a result, Japan remains a go-to market for masterbatch solutions that require the highest levels of reliability, technical performance, and product consistency particularly in high-value and export-oriented manufacturing.
South Korea’s masterbatch market is fueled by its advanced manufacturing economy, with particular strength in electronics, automotive, and chemicals. South Korean producers invest heavily in R&D to create cutting-edge masterbatch solutions for premium applications ranging from conductive plastics for electronics to high-temperature-resistant polymers for automotive and battery components. The government’s support for sustainable manufacturing and eco-friendly plastics further boosts development of innovative, recyclable, and high-value masterbatches.
With strong demand from consumer electronics (smartphones, display panels), automotive parts, and an expanding medical device sector, South Korea is a regional leader in precision-engineered plastics. Strategic focus on integrating the latest technology and global trends ensures that local manufacturers can supply highly specialized masterbatches for niche applications delivering both performance and visual excellence.
Brazil’s masterbatch market is growing quickly, propelled by increasing urbanization, a strengthening manufacturing base, and robust demand for plastics in packaging, construction, and agriculture. The country’s economic growth supports domestic consumption of flexible and rigid packaging, food and beverage containers, automotive parts, and films for farming and irrigation. As Brazilian manufacturers adopt modern processing techniques, the need for high-quality and cost-effective masterbatches has intensified.
International events, such as Plástico Brasil, showcase the latest masterbatch innovations from leading global and regional suppliers. While price sensitivity remains an important factor, Brazilian companies are also gradually shifting toward sustainable practices and advanced additive solutions. Focus on local production and adaptation to international quality standards are helping Brazil solidify its role as a major consumer and emerging supplier within Latin America’s masterbatch sector.
Turkey is establishing itself as a strategic manufacturing hub for masterbatch, serving both domestic and export markets across Europe, the Middle East, and Central Asia. Investments in packaging, automotive, and construction sectors are driving robust demand for a diverse array of plastic components necessitating a wide range of masterbatch products for color, UV protection, flame retardancy, and other functionalities. Turkish manufacturers are increasingly adopting advanced plastic processing technologies, resulting in improved product quality and compliance with international standards.
Turkey’s position as a key regional supplier is reinforced by modernization and expansion of the plastics industry, with companies responding to growing export opportunities and rising domestic consumption. The focus on high-quality, standards-compliant masterbatches is supported by both government initiatives and private investment. As the industry evolves, Turkey is poised to become a leading supplier of value-added, performance-enhancing masterbatch solutions for the broader region.
|
Parameter |
Details |
|
Market Size (2025) |
$16.9 Billion |
|
Market Size (2034) |
$28.1 Billion |
|
Market Growth Rate |
5.8% |
|
Segments |
By Type (Color Masterbatch (White, Black, Specific Colors, Special Effects), Additive Masterbatch, Filler Masterbatch (Calcium Carbonate, Talc, Barium Sulfate), Combination Masterbatch) |
|
Study Period |
2019- 2024 and 2025-2034 |
|
Units |
Revenue (USD) |
|
Qualitative Analysis |
Porter’s Five Forces, SWOT Profile, Market Share, Scenario Forecasts, Market Ecosystem, Company Ranking, Market Dynamics, Industry Benchmarking |
|
Companies |
Avient Corporation, Ampacet Corporation, Clariant AG, LyondellBasell Industries Holdings B.V., Cabot Corporation, Plastika Kritis S.A., Plastiblends India Ltd., Tosaf Group, Hubron International, Penn Color, Inc., Americhem Inc., ALOK Masterbatches Pvt. Ltd., Prayag Polytech Pvt. Ltd., Modern Dispersions, Inc., Chroma Color Corporation |
|
Countries |
US, Canada, Mexico, Germany, France, Spain, Italy, UK, Russia, China, India, Japan, South Korea, Australia, South East Asia, Brazil, Argentina, Middle East, Africa |
* List Not Exhaustive
This report from USDAnalytics dynamically investigates the global Masterbatch Market, capturing industry breakthroughs, reviewing critical applications, and highlighting transformative market dynamics. It presents a comprehensive analysis across masterbatch types, carrier polymers, and end-user industries delivering essential insights for manufacturers, investors, converters, and policymakers. The report rigorously examines market segmentation, regulatory trends, technological advances, and global value chains, drawing on historic data (2021–2024) and actionable forecasts (2025–2034). The study also reviews competitive positioning and best practices of leading suppliers, empowering stakeholders to seize emerging opportunities in sustainable plastics and value-added product development.
By Type: Color Masterbatch (White, Black, Special Colors), Additive Masterbatch (UV Stabilizers, Flame Retardants, Antioxidants, Anti-static, Anti-block, Processing Aids, etc.), Filler Masterbatch (CaCO3, Talc), Combination Masterbatch
By Polymer Type: Polyethylene (LDPE, LLDPE, HDPE), Polypropylene (PP), PVC, PS, PET, Engineering Plastics, Bio-based & Biodegradable Polymers, Other Carriers
By End-Use Industry: Packaging (Flexible/Rigid, Food & Beverage, Industrial), Automotive & Transportation, Building & Construction, Consumer Goods, Agriculture, Textile & Fibers, Electrical & Electronics, Healthcare & Medical Devices, Other Industries
Geographic Scope: 25+ countries across North America, Europe, Asia Pacific, South America, and Middle East & Africa
Historic Data: 2021–2024
Forecast Data: 2025–2034
Companies Covered: Avient, Ampacet, Clariant, LyondellBasell, Cabot, Plastika Kritis, Plastiblends India, Tosaf, Hubron, Penn Color, Americhem, ALOK, Prayag Polytech, Modern Dispersions, Chroma Color
Table of Contents: Masterbatch Market
1. Executive Summary
2. Masterbatch Market Landscape & Outlook (2025–2034)
3. Recent Masterbatch Market Developments: Product Innovations and Strategic Expansions Power Growth
4. Trends and Opportunities: Sustainability and Automotive Lightweighting Reshape Masterbatch Innovation
5. Competitive Landscape: Key Innovators Shaping the Masterbatch Market’s Future
6. Masterbatch Market Share Analysis: Segment Insights for 2025
7. Country Analysis and Outlook of Masterbatch Market
8. Masterbatch Market Size Outlook by Region (2025-2034)
9. Company Profiles: Leading Players in the Masterbatch Market
10. Methodology
11. Appendix
The masterbatch market is projected to grow from $16.9 billion in 2025 to $28.1 billion by 2034, delivering a strong CAGR of 5.8%. This expansion is driven by surging demand for colorants, additives, and functional masterbatches across packaging, automotive, electronics, and consumer goods. Increasing use of plastics, product customization, and stricter performance standards further accelerate market growth.
Sustainability is a central focus, with manufacturers investing in bio-based, biodegradable, and recyclable masterbatch solutions. Regulatory pressures and rising environmental awareness are driving the adoption of circular economy practices and eco-friendly materials. Industry leaders are developing products that balance performance with reduced environmental impact.
The packaging industry leads, accounting for 38% of global demand, followed by automotive, consumer goods, construction, and agriculture. Packaging requires precise color and additive solutions for branding and shelf life, while automotive uses masterbatches for lightweighting, safety, and aesthetics. Emerging applications in healthcare, electronics, and textiles also contribute to demand for high-performance masterbatches.
Key players include Avient Corporation, Ampacet, Clariant AG, LyondellBasell, and Plastiblends India, all known for their R&D strength and sustainability focus. These companies continually launch new products and expand capacity to address global and application-specific needs. Collaboration, automation, and material advancements keep them at the forefront of market innovation.
China remains the world’s largest producer and consumer, driven by rapid industrialization and high plastics demand. The United States, Germany, and India are hubs for high-performance, specialty, and sustainable masterbatch solutions. Growing markets in Brazil, Turkey, and South Korea are also contributing to global capacity and innovation.