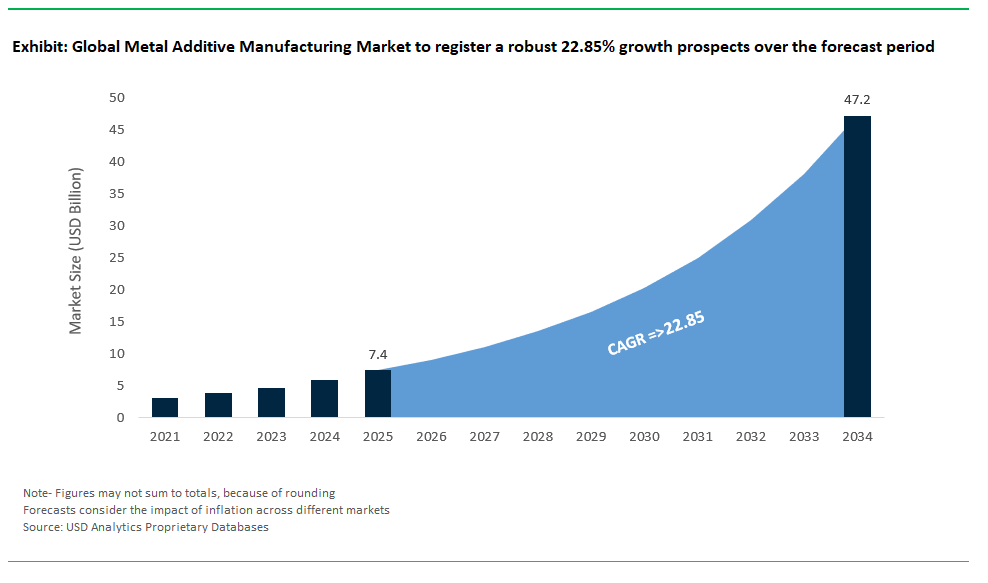
Exponential Growth Trajectory in Metal Additive Manufacturing Industry: Market Size and Strategic Outlook
The global Metal Additive Manufacturing (AM) industry is experiencing an unprecedented boom, with a projected market value of $7.4 billion in 2025 soaring to $47.2 billion by 2034, reflecting a staggering CAGR of 22.85%. This growth is powered by the technology’s evolution from prototyping to full-scale production, enabling industries to create complex, lightweight, and customized metal parts directly from digital models. As aerospace, medical, automotive, and energy sectors strive for advanced performance and supply chain agility, the adoption of metal 3D printing is reshaping manufacturing landscapes worldwide. Metal AM’s unique ability to produce intricate geometries, internal lattice structures, and single-piece assemblies with reduced waste and minimal tooling makes it indispensable for high-value, next-generation manufacturing.
At the heart of this transformation are advanced metal AM technologies: Powder Bed Fusion (PBF), including Selective Laser Melting (SLM) and Electron Beam Melting (EBM), which deliver dense, high-strength components vital for aerospace and healthcare; Directed Energy Deposition (DED), suited for large-format and repair applications; and Binder Jetting, enabling cost-effective, high-throughput production of metal parts. Industries leverage these technologies to consolidate assemblies, reduce material costs, and accelerate design-to-manufacture cycles. The shift toward mainstream production is further supported by innovations in metal powders, process monitoring, post-processing, and integrated AM software, pushing the boundaries of what’s possible in industrial 3D printing.
Breakthroughs and Strategic Alliances Accelerate Metal AM Industry Development
The Metal Additive Manufacturing market has recently witnessed a surge in innovation, industry collaborations, and capacity expansion, signaling the technology’s rapid industrialization. In July 2025, the EU’s InShaPe project achieved a transformative breakthrough in laser-based powder bed fusion by leveraging AI-based beam shaping and multispectral imaging, boosting productivity for Inconel 718 components by over 600% and halving production costs. This advancement is setting new benchmarks for industrial-scale AM in aerospace and energy applications. Meanwhile, AMES joined the HP Metal Jet Production Service network, expanding binder jetting’s footprint for high-volume metal part production, and Sirius Space Services enhanced its space and defense manufacturing capabilities by acquiring SERM and investing in AddUp FormUp 350 AM machines.
Material innovation continues to advance with Aeramine’s July 2025 demonstration of ultra-high-purity copper powder production, addressing the growing demand for high-quality AM materials in energy and electronics. Strategic moves in corporate leadership, such as Nikon AM Synergy appointing a new CEO, signal intensified focus on AM technology leadership and commercialization. In May 2025, MX3D raised €7 million to accelerate the global rollout of robotic WAAM systems, particularly targeting nuclear, oil & gas, and maritime sectors. Materials Solutions (Siemens Energy) announced the acquisition of the latest Nikon SLM Solutions NXG XII 600 multi-laser machines for high-productivity, large-format printing.
The market is also being shaped by the adoption of AM for advanced energy research, with the UK Atomic Energy Authority commissioning Freemelt and Nikon SLM machines for fusion component manufacturing in March 2025. In February, Ursa Major Technologies integrated Dyndrite’s LPBF Pro software to optimize complex rocket engine production, underscoring the critical role of advanced AM software. Notably, Velo3D’s October 2024 collaboration for Sapphire printers in aerospace propulsion highlights ongoing investment in high-performance AM hardware for mission-critical applications. These strategic moves collectively signal the metal AM industry’s transition into an era of high-volume, application-driven manufacturing.
Trends and Opportunities Reshaping the Metal Additive Manufacturing Sector
Multi-Material Metal Additive Manufacturing Ushers in a New Era of Design and Performance
A transformative trend in the metal AM market is the rapid advancement of multi-material additive manufacturing, enabling the seamless integration of different metals or alloys within a single component. Unlike traditional manufacturing, which struggles with joining dissimilar metals or creating graded properties, multi-material AM allows engineers to tailor performance such as localizing high strength, thermal conductivity, or corrosion resistance where it is most needed. This is fueling unprecedented design freedom and enabling functionally graded parts that optimize performance-to-weight ratios. Research initiatives, such as those supported by the NIH, have shown that multi-material AM can create parts with a spectrum of properties, making it a game-changer for aerospace, automotive, and energy applications. As machine capabilities (especially PBF-LB/MM) and AI-driven process controls mature, the potential to produce complex, voxel-wise graded structures is becoming more achievable, paving the way for future breakthroughs in smart, lightweight, and highly durable metal parts.
Energy Sector Emerges as a High-Value Growth Avenue for Metal AM
A significant opportunity for the metal additive manufacturing market lies in its expanding adoption across the global energy sector from renewables and oil & gas to advanced nuclear and fusion research. Energy applications require parts that endure extreme stress, temperatures, and corrosive environments. Metal AM’s ability to produce complex, optimized geometries from high-performance alloys (like Inconel or titanium), with features such as internal cooling channels, directly enhances turbine efficiency and operational lifespan. Major players like GE Aviation and Siemens Energy have already integrated metal AM for fuel nozzles and gas turbine parts, delivering efficiency gains and material savings. The use of AM for rapid spare part production and for next-gen energy materials (e.g., for batteries, fuel cells, and fusion reactors) is accelerating the sector’s digital transformation. The InShaPe project’s 2025 focus on energy and the UKAEA’s adoption of AM for fusion components underscore a global trend: AM is empowering energy companies to achieve design innovation, supply chain resilience, and sustainability targets at scale.
Competitive Landscape: Industry Leaders Transforming Metal Additive Manufacturing Globally
The global Metal Additive Manufacturing industry is highly dynamic, with key players advancing the field through machine innovation, material development, and software integration.
EOS GmbH: Pioneering Industrial 3D Printing for Aerospace, Medical, and Automotive
EOS GmbH (Germany) is a world leader in direct metal laser sintering (DMLS) and polymer 3D printing. Renowned for robust, scalable Powder Bed Fusion (PBF) systems like the EOS M series, EOS empowers industries to produce high-density, complex metal parts for critical aerospace, medical, and tooling applications. The company’s ongoing investment in multi-laser platforms, process monitoring, and material innovation positions it at the forefront of industrial AM, offering clients end-to-end support for serial production and advanced part development.
Nikon SLM Solutions: Multi-Laser Technology for High-Volume Industrial Applications
Nikon SLM Solutions Group AG (Germany) specializes in Selective Laser Melting (SLM) systems, delivering high-productivity, large-format 3D printers such as the NXG XII 600. Recent strategic partnerships, like those with Siemens Energy’s Materials Solutions, highlight SLM’s role in mass-producing mission-critical aerospace, automotive, and energy components. With open-architecture platforms and multi-laser options, Nikon SLM enables users to innovate with materials and processes, pushing metal AM into true industrial serial production.
3D Systems Corporation: Integrated AM Solutions Across Healthcare and Aerospace
3D Systems Corporation (United States) is an additive manufacturing pioneer, offering a comprehensive suite of metal AM technologies Direct Metal Printing (DMP), binder jetting, and more. Its DMP Flex and Factory 500 systems, combined with proprietary alloys and design software, serve clients in healthcare (notably dental and orthopedic implants), aerospace, and industrial sectors. 3D Systems’ integrated approach accelerates the path from concept to certified, end-use parts.
Velo3D: Redefining Complex Metal Part Production for Aerospace and Propulsion
Velo3D Inc. (United States) is at the vanguard of advanced metal 3D printing, with its Sapphire family enabling the production of complex, support-free geometries ideal for aerospace, defense, and energy applications. Notable for enabling low-angle printing and overhangs, Velo3D’s systems, paired with its Flow™ and Assure™ software, deliver consistent part quality and streamline process validation proven by partnerships with leading propulsion and aerospace companies, including SpaceX.
Desktop Metal: Binder Jetting for Scalable, Cost-Effective Mass Production
Desktop Metal, Inc. (United States) has carved a niche in scalable metal additive manufacturing, specializing in binder jetting and Bound Metal Deposition for high-volume production. Its Production System, Shop System, and Studio System lines enable cost-effective manufacturing for automotive, electronics, and general industry, democratizing metal AM for end-use parts and prototyping. Ongoing innovations in materials and automated workflows strengthen Desktop Metal’s position as a go-to solution for next-generation digital manufacturing.
Metal Additive Manufacturing (AM) Market Share Analysis: Technology and End-Use Industry Insights (2025)
Powder Bed Fusion Dominates, While DED and Binder Jetting Expand Reach
Powder Bed Fusion (PBF) stands as the leading technology in the global metal additive manufacturing (AM) market, holding a 48% share in 2025. Its precision and versatility make it indispensable for high-value sectors like aerospace where lightweight, complex parts such as fuel nozzles and brackets are required and for medical applications including patient-specific implants. PBF encompasses both laser-based (SLM, DMLS) and electron beam (EBM) processes, providing manufacturers with flexibility to address demanding performance criteria. Directed Energy Deposition (DED), capturing a 22% share, is favored for producing and repairing large-scale components in energy, defense, and heavy industry. Binder jetting is gaining momentum for its ability to facilitate high-volume, cost-effective production, particularly in the automotive sector where prototyping and custom parts are essential. Sheet lamination, metal extrusion, and material jetting remain niche but are expanding their roles especially with desktop metal printers driving SME adoption and high-resolution needs for precious metals. Key trends shaping the sector include integration with digital workflows, material innovations, and rising adoption of hybrid manufacturing solutions.
.png)
Aerospace & Defense and Automotive Lead End-Use Industry Adoption
Aerospace and defense remain the dominant end-use segment, accounting for 35% of the global metal AM market share. These industries depend heavily on PBF and DED for manufacturing lightweight, complex, and high-strength components catalyzing demand from major players like GE Aviation, Boeing, and SpaceX. Automotive is the next largest segment (25%), where binder jetting and metal extrusion support rapid prototyping, tooling, and growing adoption in custom parts for electric vehicles. Medical and dental applications are thriving, particularly with FDA-cleared PBF implants enabling mass customization of titanium and cobalt-chrome devices. Energy, industrial machinery, consumer goods, and tool & die sectors are all increasingly turning to metal AM for on-demand production, spare parts, and design flexibility, supported by a maturing ecosystem of service bureaus and advanced material suppliers. Ongoing R&D in new alloys, post-processing techniques, and part qualification standards further accelerates industry-wide adoption.
United States: Global Leader in Innovation and Application
The United States leads the world in metal AM through massive R&D investments, public-private partnerships, and a vibrant ecosystem of startups and established manufacturers. The America Makes initiative has catalyzed over $1.5 billion in funding since 2012, fueling advances in powder bed fusion, DED, and binder jetting. The U.S. is home to innovators like GE Additive, 3D Systems, and Velo3D, and is the go-to market for aerospace, defense, and medical implants. Regulatory bodies such as the FDA and FAA are defining qualification standards for 3D printed parts, while government-backed contracts support defense and space projects. Expansion of service bureaus, strong intellectual property generation, and integration with digital manufacturing are positioning the U.S. as the global benchmark in metal AM.
With aerospace and defense giants leveraging metal AM for lightweight components, the U.S. also sets the pace in medical and automotive adoption. Industry clusters across states like Ohio, Michigan, and California foster innovation, R&D, and manufacturing at scale. The nation’s emphasis on supply chain resilience, qualification of AM parts, and integration of AI-driven design ensures continued leadership in the field.
Germany: Hub of Industrial Scale and Advanced Engineering
Germany is synonymous with industrial-scale metal AM, boasting world-leading machine manufacturers like EOS, Nikon SLM Solutions, and a rich academic-industry network. Strong government and EU funding, including for the Fraunhofer Society and the InShaPe project, bolster advanced research and commercialization of laser-based PBF and hybrid solutions. Siemens Energy and automotive players lead adoption in energy, industrial machinery, and transportation. Germany’s focus on Industry 4.0 and digitalized manufacturing processes accelerates the adoption of additive solutions for complex metal components, while regulatory rigor ensures world-class standards in quality and repeatability.
Germany’s prowess extends to R&D for new alloys and post-processing, and its integrated production workflows set benchmarks for efficiency. The country’s industrial clusters drive synergy across aerospace, automotive, and tooling, making it a vital market for AM materials and software innovation.
China: Rapid Scaling and Government-Backed Expansion
China’s “Made in China 2025” strategy fuels massive investment in metal AM infrastructure, technology parks, and R&D. The nation has quickly become a key player, developing indigenous laser PBF and DED machines, and expanding production capacity for both metal powders and finished parts. Aerospace, defense, automotive, and medical sectors drive demand, with Chinese companies and research institutes closing the gap in process sophistication. Large-scale government support accelerates talent development and technology adoption, while expanding service bureaus enable both domestic and export growth.
China is not only a major adopter but also a rapidly rising innovator, aiming for self-sufficiency in high-end metal AM systems and materials. Regulatory policies are evolving to foster quality and application breadth, positioning China as a future global leader.
Japan: Precision Materials Science and Medical AM Growth
Japan’s metal AM market is distinguished by deep expertise in materials science, precision engineering, and high-performance alloys. The country invests heavily in R&D for EBM, laser-based processes, and novel post-processing techniques. Key applications are in automotive, electronics, and especially medical sectors customized implants and dental devices showcase Japan’s ability to deliver high-quality, patient-specific solutions. Collaboration between industry and academia, coupled with government funding, continues to push the envelope in new powder formulations and process control, while evolving regulatory standards are facilitating broader adoption. Japan’s technology-driven market is known for its commitment to reliability and innovation, making it a hub for next-gen AM materials, micro-manufacturing, and medical breakthroughs.
United Kingdom: Advanced Processes and Large-Scale Metal AM
The UK has established itself as a center for innovation in processes like Wire Arc Additive Manufacturing (WAAM) and powder metallurgy, supported by strong public funding (Innovate UK) and academic partnerships. Companies such as Renishaw and WAAM3D, along with organizations like UKAEA, drive the development and deployment of advanced metal AM solutions, including for fusion energy. The UK’s industrial focus includes aerospace, defense, and energy, and its ecosystem emphasizes the manufacture of high-integrity, safety-critical parts at scale. New service providers and robust R&D efforts in copper and specialty alloys support the market’s growth and global competitiveness. Strategic government support, focus on high-purity materials, and participation in multi-national R&D projects underpin the UK’s leadership in AM technology adoption and export.
Canada: Building Capacity for Aerospace and Advanced Manufacturing
Canada is scaling its metal AM capabilities through investments in R&D, partnerships with global leaders, and government support for domestic manufacturing. The focus on aerospace, automotive, and medical applications leverages strengths in DED and PBF, with growing expertise in materials and process qualification. Canadian manufacturers are increasingly using AM for low-volume production, prototyping, and spare parts, benefiting from new service bureaus and research initiatives. The country’s strategic vision includes fostering supply chain resilience and technology transfer with the U.S. and Europe. Ongoing investment in R&D and collaborative platforms ensures Canada remains a regional force in AM innovation and adoption.
France: Aerospace Focus and Collaborative Innovation
France is an active participant in EU-funded AM research and home to innovators like AddUp. The aerospace and defense sectors, including Airbus and Safran, are primary drivers of metal AM adoption, with emerging interest from the energy and automotive industries. The French government’s strategic industrial policies support advanced manufacturing, while collaborations between companies and research organizations foster a culture of technical excellence. Expansions in production capacity, including by Sirius Space and MX3D, underscore the market’s growth. France’s commitment to integrating AM into high-value applications and energy infrastructure demonstrates its pivotal role in European and global AM markets.
Sweden: Pioneering EBM and Medical Implants
Sweden’s reputation in metalworking and materials science is complemented by leadership in Electron Beam Melting (EBM), thanks to companies like Arcam (GE Additive) and Freemelt. The country excels in producing high-density, complex parts from reactive metals like titanium, serving medical (orthopedic implants) and aerospace industries. Ongoing R&D and government-backed innovation support the evolution of process control, machine robustness, and sustainable industrialization. Sweden’s role in international projects, such as the UKAEA’s fusion energy program, demonstrates its influence on global AM developments. With a focus on quality, repeatability, and new alloy systems, Sweden continues to set standards in high-value metal AM for critical applications.
Metal Additive Manufacturing Market Report Scope
Metal Additive Manufacturing Market
|
Parameter
|
Details
|
|
Market Size (2025)
|
$7.4 Billion
|
|
Market Size (2034)
|
$47.2 Billion
|
|
Market Growth Rate
|
22.85%
|
|
Segments
|
By Technology (Powder Bed Fusion (PBF), Selective Laser Melting (SLM) / Direct Metal Laser Sintering (DMLS), Electron Beam Melting (EBM), Directed Energy Deposition (DED), Laser Metal Depition (LMD), Wire Arc Additive Manufacturing (WAAM), Powder Blown Fusion, Binder Jetting, Sheet Lamination, Metal Extrusion, Material Jetting)
By Material (Titanium Alloys, Nickel Alloys, Stainless Steels, Aluminum Alloys, Cobalt-Chrome Alloys, Copper Alloys, Tool Steels, Precious Metals, Others)
By Application (Prototyping, Tooling, Functional Parts Manufacturing (End-Use Parts), Repair & Overhaul)
By End-Use Industry (Aerospace & Defense, Automotive, Medical & Dental, Energy (Oil & Gas, Power Generation, Nuclear, Renewables), Industrial Machinery & Heavy Equipment, Consumer Goods, Tool & Die, Research & Development, Other Industrial
|
|
Study Period
|
2019- 2024 and 2025-2034
|
|
Units
|
Revenue (USD)
|
|
Qualitative Analysis
|
Porter’s Five Forces, SWOT Profile, Market Share, Scenario Forecasts, Market Ecosystem, Company Ranking, Market Dynamics, Industry Benchmarking
|
|
Companies
|
EOS GmbH, Nikon SLM Solutions Group AG, 3D Systems Corporation, Velo3D Inc., Desktop Metal, Inc., GE Additive (includes Arcam EBM and Concept Laser), Renishaw plc, Stratasys Ltd. (with metal AM offerings), HP Inc. (Metal Jet), AddUp (Fives Michelin Additive Solutions), ExOne (now part of Desktop Metal), Markforged Holding Corporation, AML3D, WAAM3D Limited, Freemelt AB
|
|
Countries
|
US, Canada, Mexico, Germany, France, Spain, Italy, UK, Russia, China, India, Japan, South Korea, Australia, South East Asia, Brazil, Argentina, Middle East, Africa
|
Metal Additive Manufacturing Market Segmentation
By Technology
- Powder Bed Fusion (PBF)
- Selective Laser Melting (SLM) / Direct Metal Laser Sintering (DMLS)
- Electron Beam Melting (EBM)
- Directed Energy Deposition (DED)
- Laser Metal Depition (LMD)
- Wire Arc Additive Manufacturing (WAAM)
- Powder Blown Fusion
- Binder Jetting
- Sheet Lamination
- Metal Extrusion
- Material Jetting
By Material
- Titanium Alloys
- Nickel Alloys
- Stainless Steels
- Aluminum Alloys
- Cobalt-Chrome Alloys
- Copper Alloys
- Tool Steels
- Precious Metals
- Others
By Application
- Prototyping
- Tooling
- Functional Parts Manufacturing (End-Use Parts)
- Repair & Overhaul
By End-Use Industry
- Aerospace & Defense
- Automotive
- Medical & Dental
- Energy (Oil & Gas, Power Generation, Nuclear, Renewables)
- Industrial Machinery & Heavy Equipment
- Consumer Goods
- Tool & Die
- Research & Development
- Other Industrial
Countries Analyzed
- North America (US, Canada, Mexico)
- Europe (Germany, UK, France, Spain, Italy, Russia, Rest of Europe)
- Asia Pacific (China, India, Japan, South Korea, Australia, South East Asia, Rest of Asia)
- South America (Brazil, Argentina, Rest of South America)
- Middle East and Africa (Saudi Arabia, UAE, Rest of Middle East, South Africa, Egypt, Rest of Africa)
Top Companies in Metal Additive Manufacturing Market
- EOS GmbH
- Nikon SLM Solutions Group AG
- 3D Systems Corporation
- Velo3D Inc.
- Desktop Metal, Inc.
- GE Additive (includes Arcam EBM and Concept Laser)
- Renishaw plc
- Stratasys Ltd. (with metal AM offerings)
- HP Inc. (Metal Jet)
- AddUp (Fives Michelin Additive Solutions)
- ExOne (now part of Desktop Metal)
- Markforged Holding Corporation
- AML3D
- WAAM3D Limited
- Freemelt AB
* List Not Exhaustive
