
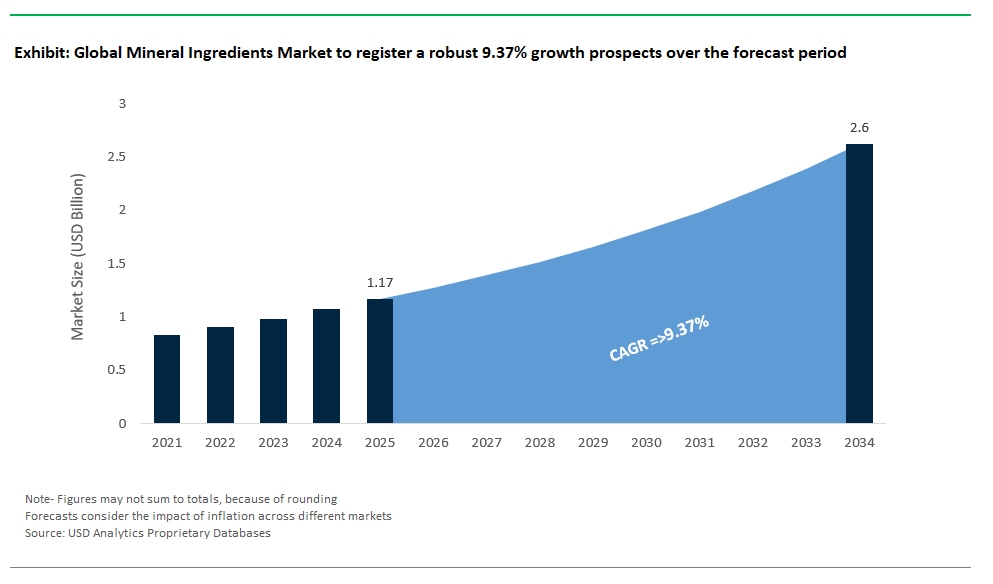
The global mineral ingredients market is set to achieve robust expansion, with market value projected to rise from $1.17 billion in 2025 to an estimated $2.6 billion by 2034, reflecting an impressive CAGR of 9.37%. This surge underscores the critical role mineral ingredients play across the food & beverage, pharmaceuticals, cosmetics, and animal feed industries. As the world intensifies its focus on preventive healthcare, addresses persistent mineral deficiencies, and responds to booming demand for functional foods and nutraceuticals, the mineral ingredients sector is poised to become a linchpin of modern nutritional and wellness solutions.
Mineral ingredients are indispensable in elevating the nutritional value and functionality of everyday products, ranging from macrominerals such as calcium, magnesium, and potassium to trace elements including iron, zinc, and selenium. Their applications span an impressive spectrum enriching staple foods, boosting the efficacy of dietary supplements, enhancing pharmaceutical formulations, improving the performance and sensory appeal of cosmetics and personal care products, and fortifying animal feed for optimal health. The industry’s rapid growth is also driven by advances in bioavailability, sustainable sourcing, and a surge in clean label and plant-based product formulations. As leading brands and ingredient suppliers respond to consumer demand for health, transparency, and traceability, mineral ingredients are increasingly featured in fortified plant-based milks, magnesium-enriched beverages, zinc-fortified nutritional bars, mineral-rich cosmetics, and bioavailable supplements for personalized nutrition. This evolving landscape marks a fundamental shift toward proactive wellness and high-value, scientifically substantiated solutions.
Innovation, strategic alliances, and evolving consumer expectations are reshaping the mineral ingredients market at a rapid pace. In July 2025, Jungbunzlauer launched TayaGel® LA at IFT First, expanding its texturants portfolio and underlining its commitment to plant-based, label-friendly ingredients a trend also reflected in its 2024 acquisition of AGI and increased biogum capacity. This aligns with the market’s trajectory toward natural, functional, and sustainable ingredients across food, beverage, and nutrition applications.
Nestlé’s July 2025 focus on premium VMS (Vitamins, Minerals, Supplements) brands such as Garden of Life and Solgar renowned for organic, clean-label mineral formulations highlights a strategic pivot to high-quality, scientifically supported mineral ingredients. This move responds directly to global consumer shifts toward transparency, authenticity, and wellness-driven brands.
The market for mineral enrichment is propelled by heightened awareness of widespread deficiencies in minerals like iron, calcium, and iodine, which in turn is fueling fortification initiatives and functional food innovation. Government mandates and voluntary industry action are accelerating the integration of mineral fortification into staple and convenience foods. Throughout 2024–2025, the clean label and plant-based movement has remained dominant, prompting suppliers to develop mineral forms that blend seamlessly into “free-from” and natural product claims, especially in fast-growing categories like plant-based dairy alternatives and vegan meat substitutes.
Another area of intense R&D is bioavailability enhancement. Companies are investing in chelated and highly soluble mineral forms such as magnesium citrate and zinc bisglycinate that deliver superior absorption and efficacy. This capability is crucial for supplement manufacturers and food producers striving to deliver health benefits backed by science. The industry’s focus on natural, efficacious, and consumer-trusted mineral solutions is a core driver for future growth and differentiation.
A defining trend in the mineral ingredients industry is the exponential rise in demand for mineral fortification within functional foods and beverages. Heightened health consciousness and a strong macro trend toward preventive wellness are pushing consumers to seek out products that offer benefits beyond basic nutrition. Widespread mineral deficiencies such as iron (anemia), calcium (osteoporosis), and zinc (immunity) are fueling public health initiatives and fortification programs, driving manufacturers to add minerals to staple and convenience foods.
The convenience of modern lifestyles, paired with the increasing adoption of plant-based diets, is generating new nutritional gaps that fortification helps fill. Food producers are leveraging mineral fortification to make specific, consumer-facing health claims such as “supports bone health,” “boosts immunity,” and “aids energy metabolism.” This trend is evident in new calcium-fortified yogurts, magnesium-enriched beverages, and zinc-boosted nutritional bars. In July 2025, Jungbunzlauer’s focus on “label-friendly ingredient solutions” is just one example of the industry’s pivot toward functional, transparent products. Regulatory mandates in many countries (such as iodine in salt) further anchor this trend. The impact is a food system where mineral fortification is standard, with manufacturers and suppliers investing in R&D to develop highly bioavailable, taste-neutral mineral forms and collaborating to launch new fortified lines, thus strengthening public health and driving market growth.
The intersection of the clean label movement and the rise of personalized health is unlocking lucrative opportunities for mineral ingredients in cosmetics and custom nutrition. Consumers are scrutinizing beauty and personal care products, demanding “free-from” claims and natural, safe, and skin-friendly ingredients. Mineral-based cosmetics naturally fit these demands, providing hypoallergenic, UV-protective, and anti-inflammatory benefits. The global surge in mineral-rich foundations, SPF-infused BB creams, and skin-soothing masks illustrates this alignment, supported by new launches such as vegan mineral lipsticks and multi-functional, skincare-infused makeup (Jane Iredale, bareMinerals).
Personalized nutrition is another high-growth segment, driven by innovations in genetic testing, wearable tech, and nutrigenomics. Custom mineral blends based on blood, DNA, or biometric data are moving the supplement space beyond generic products to precision health solutions. Companies now offer mineral-fortified meal kits and smart supplements tailored to individual needs. These shifts are especially evident in the premium supplements space, as seen in Nestlé’s focus on scientifically backed, organic, and clean-label VMS brands. Globally, these movements are fueling R&D for ultra-pure, multi-functional mineral ingredients suitable for sensitive cosmetic applications and personalized health platforms propelling the industry from commodity supply to high-value, specialized solutions with robust growth potential.
The global mineral ingredients industry is dominated by a dynamic mix of multinational chemical leaders, specialized ingredient manufacturers, and nutrition powerhouses, each advancing market innovation and supply security.
BASF SE leverages its global scale and R&D might to deliver a vast portfolio of mineral ingredients for human and animal nutrition, pharmaceuticals, and personal care. With a strategic focus on sustainability and advanced bioavailability, BASF is continuously innovating to support health and functionality in end products ensuring reliable supply and high quality for global brands.
DSM is a science-focused leader offering a comprehensive portfolio of minerals and premixes tailored for human and animal nutrition. The company’s relentless investment in research and strategic partnerships enables the development of highly absorbable, stable mineral forms. DSM’s mission to address global malnutrition and promote sustainable food systems positions it at the forefront of nutrition innovation.
Cargill’s strength lies in its vast agricultural base, advanced processing, and integrated supply chain. The company supplies mineral salts and blends for food and feed, prioritizing sustainable sourcing and robust traceability making it a key supplier for manufacturers seeking nutritional and functional enhancement.
As a global specialist in minerals and performance materials, Minerals Technologies focuses on high-value solutions such as precipitated calcium carbonate (PCC) for diverse applications from food and pharma to industrial uses. The company is also at the cutting edge of sustainability, integrating CO2 sequestration into its product lines.
Balchem is renowned for its innovation in chelated and highly bioavailable mineral forms, particularly through its Albion Minerals® range. Its solutions cater to both human and animal health markets, with a clear emphasis on science-driven efficacy, absorption, and performance.
Jungbunzlauer’s commitment to natural, fermentation-based mineral salts like calcium, magnesium, and potassium citrates meets growing demand for clean label and highly bioavailable solutions. Its expansion in 2025, along with the AGI acquisition, underscores its leadership in functional, plant-based, and label-friendly ingredients.
Gadot Biochemical is recognized for its expertise in high-purity citrate minerals, supplying advanced solutions for food, beverage, pharmaceutical, and nutraceutical markets. Its focus on quality and functional benefits positions it as a preferred partner for fortified and health-oriented brands.
Arla Foods leverages its dairy heritage to offer calcium-rich milk minerals and other nutritional ingredients, playing a pivotal role in infant nutrition, bone health, and functional foods. Its approach emphasizes natural, high-quality solutions that address life-stage nutrition needs.
Corbion’s expertise in lactic acid and derivatives extends to highly functional mineral lactates, supporting food fortification, preservation, and clean label goals. The company’s strategic focus on food quality, safety, and health trends ensures its ongoing relevance in global nutrition.
In 2025, macrominerals such as calcium, magnesium, and phosphorus dominate the global mineral ingredients market, capturing approximately 65% market share. This dominance is attributed to their fundamental roles in both human and animal nutrition, where they support critical functions including bone health, muscle contraction, and cellular metabolism. Macrominerals are widely incorporated in fortified foods, functional beverages, dietary supplements, and agricultural products underscoring their ubiquity across health, food, and feed industries. The prevalence of macrominerals is further boosted by the expansion of food fortification programs and growing health consciousness among consumers, particularly in North America and Europe.
Meanwhile, trace minerals (microminerals) such as iron, zinc, and selenium are exhibiting faster growth, driven by rising awareness of global micronutrient deficiencies and the increasing popularity of functional foods and nutraceuticals. Recent advancements in bioavailability especially the development of chelated and organic-bound mineral forms are making trace minerals more effective, spurring their adoption in premium supplement and animal feed markets. This segment is also benefitting from intensified research linking trace minerals to immunity, cognitive health, and metabolic function, expanding their appeal among consumers seeking targeted nutrition solutions.
Food & Beverages represent the largest application segment in the mineral ingredients market, accounting for around 30% share in 2025. The sector is propelled by widespread mineral fortification of dairy products, cereals, plant-based beverages, and functional drinks measures that address deficiencies in populations and support wellness trends. Iron fortification to combat anemia and iodine enrichment for thyroid health are prominent strategies in both developed and emerging economies. Clean-label trends and consumer demand for natural nutrition are further fueling the use of bio-based and organic mineral sources in foods and drinks.
Pharmaceuticals maintain a substantial market share owing to the integral use of mineral-based supplements (e.g., calcium tablets for bone health, magnesium for cardiovascular function) and their role as active pharmaceutical ingredients (APIs) or excipients. The demand is supported by aging populations, rising chronic disease rates, and growing interest in preventive healthcare. Animal feed is another crucial segment, accounting for about 20% share, as minerals like zinc and phosphorus are vital for livestock immunity and growth. Meanwhile, the cosmetics and personal care segment is gaining momentum with minerals such as zinc oxide and magnesium incorporated into sunscreens and skincare products. The agricultural sector utilizes minerals for soil enrichment and crop yield improvement, while industrial applications benefit from mineral ingredients in ceramics, construction, and coatings.
.png)
The United States leads the global mineral ingredients market, underpinned by high consumer health awareness and robust demand for dietary supplements, functional foods, and mineral-based cosmetics. The U.S. Food and Drug Administration (FDA) plays a central role in regulating the safety, efficacy, and quality of mineral ingredients used across food, drug, and personal care products. This regulatory rigor is complemented by strong research and development activity, particularly in creating highly bioavailable and clean-label mineral solutions for personalized nutrition.
The U.S. market is witnessing surging demand for mineral-fortified plant-based foods, sports nutrition, and mineral-rich makeup, all supported by evolving consumer preferences for natural and science-backed ingredients. Companies such as Balchem and Minerals Technologies are at the forefront of innovation, focusing on bioavailability, product safety, and sustainability. Trends like “clean beauty” and increased interest in natural minerals are also elevating the cosmetics and personal care segments, making the U.S. a model for regulatory excellence and product development.
China’s mineral ingredients market is expanding rapidly, driven by a massive consumer base, growing disposable incomes, and heightened health consciousness. The country is both a global producer and a significant consumer of raw minerals and processed ingredients. Recent government initiatives are focused on improving food safety and public health, leading to an increased emphasis on mineral fortification, especially in dairy, infant nutrition, and functional beverages.
China’s evolving regulatory landscape is aimed at tightening controls over food additives and health supplements to ensure safety and quality. This has led to growth in traditional Chinese medicine incorporating minerals, as well as rising demand for mineral-enriched cosmetics. Domestic manufacturers are scaling up to meet global quality standards, while the rapid adoption of fortified foods and supplements positions China as a critical engine for growth in the global mineral ingredients industry.
Germany stands as a European powerhouse in the mineral ingredients market, characterized by advanced manufacturing, rigorous regulatory standards, and a strong emphasis on sustainability. As a key player within the European Union, Germany complies with some of the world’s strictest food, supplement, and cosmetic ingredient regulations, ensuring products are both safe and high quality. German innovation is focused on sustainable sourcing and process optimization, developing pure, functional mineral ingredients for food, pharma, and personal care applications.
Key industries in Germany, such as pharmaceuticals and high-value foods, demand precision and purity, driving R&D in ingredient formulation and bioavailability. The organic and natural cosmetics market is also thriving, with consumers showing a strong preference for eco-friendly, traceable mineral sources. Global ingredient manufacturers like BASF are headquartered here, further reinforcing Germany’s reputation as a technological and regulatory leader.
India’s mineral ingredients market is undergoing robust growth, propelled by an expanding middle class, increasing health awareness, and government-led nutrition initiatives. Programs to combat malnutrition and promote dietary fortification are raising demand for both macro and trace minerals in food, beverages, and supplements. The country is also ramping up its manufacturing capabilities, producing a wide variety of mineral salts and specialty ingredients for domestic and export markets.
Mineral ingredients are widely used in dietary supplements, functional foods, and a growing array of ayurvedic and herbal products. The adoption of fortified foods and health supplements is particularly pronounced among urban populations, who are increasingly seeking convenient, nutrition-rich solutions to modern lifestyle diseases. The cosmetics sector is also gaining traction, incorporating minerals for both functional and aesthetic benefits.
Japan’s mineral ingredients market is renowned for its focus on high-quality, scientifically validated, and innovative products. The country’s strict regulatory environment ensures safety and purity in food additives and supplements, fostering consumer trust and encouraging R&D in functional nutrition. Japanese companies lead in the development of mineral-fortified foods and beverages targeting bone health, stress relief, and age-related wellness key concerns in an aging society.
Japanese consumers are among the world’s most health-conscious, seeking products that combine efficacy with natural, clean-label positioning. The cosmetics industry is similarly advanced, with mineral ingredients favored for their safety, functionality, and skin-friendly benefits. Japan’s reputation for innovation and high standards makes it a reference market for global ingredient trends.
The Netherlands acts as a strategic hub for the European mineral ingredients market, leveraging its strength in nutrition, bio-based innovation, and sustainable production. Home to global leaders such as DSM and Corbion, the Dutch industry emphasizes research in ingredient science, bioavailability, and circular economy solutions. Government support for sustainable production and strict adherence to EU regulations create a favorable environment for innovation.
The Netherlands is a major supplier of mineral ingredients to the global food & beverage, animal feed, and pharmaceutical industries. The country’s commitment to the bio-based and circular economy is pushing ingredient companies to develop safe, effective, and environmentally responsible mineral solutions. As a result, the Netherlands has established itself as a pioneer in sustainable ingredient production and export.
|
Parameter |
Details |
|
Market Size (2025) |
$1.17 Billion |
|
Market Size (2034) |
$2.6 Billion |
|
Market Growth Rate |
9.37% |
|
Segments |
By Type (Nutritional Classification), Macrominerals, Trace Minerals / Microminerals) |
|
Study Period |
2019- 2024 and 2025-2034 |
|
Units |
Revenue (USD) |
|
Qualitative Analysis |
Porter’s Five Forces, SWOT Profile, Market Share, Scenario Forecasts, Market Ecosystem, Company Ranking, Market Dynamics, Industry Benchmarking |
|
Companies |
BASF SE, Koninklijke DSM N.V. (now DSM-Firmenich), Cargill, Incorporated, Minerals Technologies Inc. (MTI), Balchem Corporation (Albion Minerals), Jungbunzlauer Suisse AG, Gadot Biochemical Industries Ltd., Arla Foods Ingredients, Corbion N.V., Archer Daniels Midland Company (ADM), Tate & Lyle PLC, Kerry Group plc, DuPont (now IFF's Health & Biosciences division includes some relevant mineral products), Omya AG, K+S AG |
|
Countries |
US, Canada, Mexico, Germany, France, Spain, Italy, UK, Russia, China, India, Japan, South Korea, Australia, South East Asia, Brazil, Argentina, Middle East, Africa |
* List Not Exhaustive
Table of Contents: Mineral Ingredients Market
1. Executive Summary
2. Mineral Ingredients Market Landscape & Outlook (2025–2034)
3. Strategic Industry Moves and Innovation Define Mineral Ingredients Market Dynamics
4. Transformative Trends and Emerging Opportunities in the Mineral Ingredients Industry
5. Competitive Landscape: Leading Innovators and Strategic Players in the Mineral Ingredients Market
6. Market Share Analysis: Nutritional Classification and Application Segmentation Drive Growth
7. Country Analysis: Global Hotspots Transforming the Mineral Ingredients Market
8. Mineral Ingredients Market Size Outlook by Region (2025-2034)
9. Company Profiles: Leading Players in the Mineral Ingredients Market
10. Methodology
11. Appendix
The mineral ingredients market is driven by heightened awareness of mineral deficiencies, consumer demand for functional and fortified foods, and the rapid expansion of clean label and plant-based diets. Government fortification mandates, innovation in bioavailability, and trends toward personalized nutrition and sustainable sourcing further propel market growth.
Macrominerals such as calcium, magnesium, and phosphorus dominate, accounting for about 65% of the market share in 2025 due to their critical role in nutrition and widespread use in food fortification. Trace minerals (e.g., iron, zinc, selenium) are exhibiting faster growth rates, benefiting from advancements in bioavailable forms and increasing focus on immunity, cognitive health, and metabolic support.
Key players include BASF SE (science-based mineral solutions), DSM (nutrition and science-driven minerals), Cargill (functional and sustainable ingredients), Minerals Technologies Inc. (specialty minerals), Balchem (bioavailable chelated minerals), Jungbunzlauer (clean-label mineral salts), Gadot Biochemical (high-purity citrate minerals), Arla Foods Ingredients (dairy-derived minerals), and Corbion (sustainable mineral lactates).
Major trends include fortification of functional foods and beverages, expansion into clean label cosmetics, and the rise of personalized nutrition. Mineral-based ingredients are increasingly used in sports nutrition, plant-based foods, and cosmetics, responding to consumer demands for health, transparency, and sustainability.
The United States leads with high consumer awareness and strong regulatory standards, China excels in manufacturing power and public health initiatives, Germany is known for technological leadership and strict regulation, India is expanding rapidly with public health programs, Japan focuses on high-quality, science-driven innovation, and the Netherlands acts as a strategic hub for sustainable ingredient production and export.