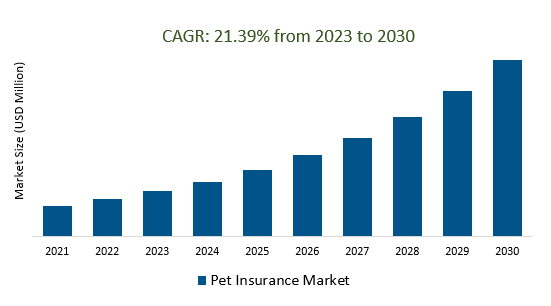
The global pet insurance market size is estimated to be $9.1 billion in 2023, growing at a CAGR of 21.39% during the forecast period 2023 to 2030.
The global pet insurance market is witnessing significant growth in most of the developing countries. The rise in pet ownership and the humanization of pets has paved the way for the development of the market in recent years
Pet Insurance Market Analysis
The relationship between humans and animals spans thousands of years leading to the concept of animal companionship. The association with pets is considered a rewarding relationship with love and affection. Accordingly, companion animals have become a part of the family in most households; they are no more animals and people refer to them as furry babies and children. With an increase in the number of pets across the globe, pet humanizing has grown, leading to the development of many pet and pet-related industries. The growth of human-animal bonding has made pets to be a part of families where they even share the living space with them. Rapid urbanization and change in preference lifestyles have also led to a rise in pet adoption. It is estimated that more than 75% of pet owners call their pets family, and more than 60% of the owners let their pets sleep in the bedroom.
Since the 1970s, women are surpassing men in terms of pet preference. People around the world, especially millennial pet owners, spend more money on providing sophisticated and modern products and services to their pets. Along with the expenses in the case of grooming, clothes and accessories, travel, food, and other services, a significant amount of money is spent on expensive treatments and surgeries every year, irrespective of the type of pet. When there is a pet, healthcare should be treated as an important component since animals are equally prone to diseases as human beings. The unexpected vet care poses a threat to pet owners. Also, an average dog-owning household spends $378 a year, horse owners $373, and cat owners only $191 per year on veterinary bills. This also depends on other factors like the type of treatment and medication. To prevent financial burdens, most pet owners are opting for pet insurance, which is common in countries like the US, the UK, and Sweden.
Pet insurance is more of an emotional relationship unlike most of the other property insurance schemes. It also provides peace of mind along with the coverage policies. The first pet insurance policy was introduced in Sweden in 1890 and focussed on horses and livestock. The first dog policy was issued in Sweden in 1924. Similarly, the first pet insurance in the US was provided by Veterinary Pet Insurance in 1982. Most of the companies offer accident & illness as well as accident-only policies, and the premium rate depends on the scheme and type of pet. They do not cover pre-existing conditions, breeding costs, and cosmetic surgeries. They include chemotherapy, hydrotherapy, acupuncture, and other treatments. The premiums also depend on the pet’s age, sex, breed, and location.
Market Dynamics
Market Trend- Rise in Online Claims Presents New Opportunities
With the introduction of new pet insurance policies and schemes, the impact of online claims on insurance policies has further boosted the penetration rate for the market. In most developed countries like the US and the UK, the concept of online insurance claims is not new. However, in emerging economies like India, the momentum for online claims are on the rise Most people are using technology and AI as a platform to enquire about various insurance policies, term plans, coverage criteria, and the payment of premiums that can be done through websites, emails, fax, or a text message through phones.
Based on the successful impact of online claims, it has been adopted by most of the leading insurance companies, which can also enhance user-friendliness. Online claims can save time for pet owners in their busy work schedules. Most pet insurance companies are offering the feature to claim online and make the work easy and simple without involving much paperwork. Since most pet owners are millennials, they are more oriented toward the digital approach, like online claims and queries, which can be a potential trend to enhance the growth of the pet insurance market.
Market Driver- Rise in Millennial Interest in Pets
With the growing number of millennials (persons who are born between 1980 and 1996 or persons reaching adulthood in the early 21st century) across the globe, the success rate of new products in the market has surged. Millennials are driving the growth of premium products and are willing to buy them based on the benefits rather than their cost. In the past decade, there is an increased concern and special interest among millennials in pet and pet-related products. With the smartphone penetration witnessed in more than 90% of the millennial, they are the potential customers for products like pet insurance and vendors are considering them as early adopters for their product offerings.
Millennials are the driving factor for the growth of pet insurance companies in recent years. More than 75% of the millennial in the North American region own a pet in their house. This is larger than that of any other demographic segment in the region. It is also estimated that more than half the pet owners in the past decade comprised millennial and Gen Z groups. They assume that pets as a part of their family rather than just an animal. Of the 43 million millennials in the US, more than 35% are pet owners in the country. More than 44% of millennial pet owners consider their pets as a substitute for babies.
The future of the pet insurance industry will be greatly influenced by millennial pet owners and their spending patterns. They are even ready to spend $500-2,000 for their pet if it falls sick. These statistics provide insights into the potential millennial who can be targeted by insurers. With the growing momentum in the US, the UK, and other European countries, proper education and awareness levels by the insurers can entice more millennial customers in the growing market areas of the APAC, MEA, and the pet care market in Latin America.
Market Segmentation
The global Pet Insurance Market is segmented into Insurance, Animals, and Countries.
Accident & Illness Policy is the largest Pet Insurance market
The accident & illness policies segment is the largest revenue contributor to the global pet insurance market by type of coverage. This segment covers reimbursement for both accidents and illnesses, including hereditary conditions and behavioral issues of the pets. While almost every insurer offers this policy, most of the plans include various ranges from premium to advance and the price of the premium depends on the age and breed of the pet. Since most pet owners are willing to spend more for the welfare of their pets and prevent expensive veterinary bills, they prefer accident & illness coverage as the most effective among other offerings.
The global pet insurance market by the dog's segment, growing at a CAGR of 21.24% during the forecast period
The growing humanization concept is driving the dogs’ insurance segment where dogs have been considered as an essential member of the family. The growth in the adoption of dogs as pets and the growing wellness concerns of pet owners is the reason for the rising dominance of this segment in the market. Every player in the industry is committed to providing dog insurance with various premiums according to the coverage plans. The premiums also rely on the species, breed, age, and gender of the dogs. Pet dog insurance is said to constitute 55−60% of the revenue for insurers.
By Region, Europe accounts for the highest market size for the period 2023 to 2030
With more than 81 million households owning at least one pet, the European region becomes the largest revenue generator for the global pet insurance market in 2023. Most of the countries in Europe have a maximum penetration rate for pet insurance products. Sweden has the largest penetration rate of 57%, followed by the UK with 25%. There are also countries like Norway, Netherlands, Germany, France, and Italy, where the adoption and awareness of insurance products are similar to that in the US. It is also estimated that 8 out of 10 dogs are insured in Sweden compared to 2 out of 10 in Finland, Norway, and the UK. Similarly, 3 out of 10 cats are insured in Sweden, where the proportion is very low in most of the other countries.
With more than 102 million pet cats, 85 million pet dogs, and around 50 million birds, the region is expected to contribute significantly with further adoption of insurance policies. The rising humanization of pets and growing preference for the pet industry is the vital driver for the market. The pet owners in the region continue to show commitment to providing nutritious food and services along with increased spending on sophisticated care as well as accessories and products for pets to improve their lifestyles. In countries like the UK, the younger generation is more interested in pets where the male pet owners are more likely to buy pet insurance than their female counterparts. Moreover, insurance penetration seems to be more among pets aged 1−5 years.
Segmentation
By Insurance
- Accident and Illness
- Accident Only
By Animal
By Region
- North America (United States, Canada, Mexico)
- Europe (Germany, France, United Kingdom, Spain, Italy, Others)
- Asia Pacific (China, India, Japan, South Korea, Australia, Others)
- Latin America (Brazil, Argentina, Others)
- Middle East and Africa (Saudi Arabia, UAE, Kuwait, Other Middle East, South Africa, Nigeria, Other Africa)
Key Players
Leading companies profiled in the study include-
- Nationwide Mutual Insurance Company
- Trupanion Inc
- Healthy Paws Pet Insurance
- Petplan
- Agria Corporation
- Deutsche Familienversicherung AG
- Animal Friends Insurance Services Limited
- Figo Pet Insurance LLC
- Embrace Pet Insurance Agency, LLC
Pet Insurance Market Outlook 2023
1 Market Overview
1.1 Introduction to Pet Insurance Market
1.2 Scope of the Study
1.3 Research Objective
1.3.1 Key Market Scope and Segments
1.3.2 Players Covered
1.3.3 Years Considered
2 Executive Summary
2.1 2023 Pet Insurance Industry- Market Statistics
3 Market Dynamics
3.1 Market Drivers
3.2 Market Challenges
3.3 Market Opportunities
3.4 Market Trends
4 Market Factor Analysis
4.1 Porter’s Five Forces
4.2 Market Entropy
4.2.1 Global Pet Insurance Market Companies with Area Served
4.2.2 Products Offerings Global Pet Insurance Market
5 COVID-19 Impact Analysis and Outlook Scenarios
5.1.1 Covid-19 Impact Analysis
5.1.2 Post-COVID-19 Scenario- Low Growth Case
5.1.3 Post-COVID-19 Scenario- Reference Growth Case
5.1.4 Post-COVID-19 Scenario- Low Growth Case
6 Global Pet Insurance Market Trends
6.1 Global Pet Insurance Revenue (USD Million) and CAGR (%) by Type (2018-2030)
6.2 Global Pet Insurance Revenue (USD Million) and CAGR (%) by Applications (2018-2030)
6.3 Global Pet Insurance Revenue (USD Million) and CAGR (%) by Regions (2018-2030)
7 Global Pet Insurance Market Revenue (USD Million) by Type, and Applications (2018-2022)
7.1 Global Pet Insurance Revenue (USD Million) by Type (2018-2022)
7.1.1 Global Pet Insurance Revenue (USD Million), Market Share (%) by Type (2018-2022)
7.2 Global Pet Insurance Revenue (USD Million) by Applications (2018-2022)
7.2.1 Global Pet Insurance Revenue (USD Million), Market Share (%) by Applications (2018-2022)
8 Global Pet Insurance Development Regional Status and Outlook
8.1 Global Pet Insurance Revenue (USD Million) By Regions (2018-2022)
8.2 North America Pet Insurance Revenue (USD Million) by Type, and Application (2018-2022)
8.2.1 North America Pet Insurance Revenue (USD Million) by Country (2018-2022)
8.2.2 North America Pet Insurance Revenue (USD Million) by Type (2018-2022)
8.2.3 North America Pet Insurance Revenue (USD Million) by Applications (2018-2022)
8.3 Europe Pet Insurance Revenue (USD Million), by Type, and Applications (USD Million) (2018-2022)
8.3.1 Europe Pet Insurance Revenue (USD Million), by Country (2018-2022)
8.3.2 Europe Pet Insurance Revenue (USD Million) by Type (2018-2022)
8.3.3 Europe Pet Insurance Revenue (USD Million) by Applications (2018-2022)
8.4 Asia Pacific Pet Insurance Revenue (USD Million), and Revenue (USD Million) by Type, and Applications (2018-2022)
8.4.1 Asia Pacific Pet Insurance Revenue (USD Million) by Country (2018-2022)
8.4.2 Asia Pacific Pet Insurance Revenue (USD Million) by Type (2018-2022)
8.4.3 Asia Pacific Pet Insurance Revenue (USD Million) by Applications (2018-2022)
8.5 South America Pet Insurance Revenue (USD Million), by Type, and Applications (2018-2022)
8.5.1 South America Pet Insurance Revenue (USD Million), by Country (2018-2022)
8.5.2 South America Pet Insurance Revenue (USD Million) by Type (2018-2022)
8.5.3 South America Pet Insurance Revenue (USD Million) by Applications (2018-2022)
8.6 Middle East and Africa Pet Insurance Revenue (USD Million), by Type, Technology, Application, Thickness (2018-2022)
8.6.1 Middle East and Africa Pet Insurance Revenue (USD Million) by Country (2018-2022)
8.6.2 Middle East and Africa Pet Insurance Revenue (USD Million) by Type (2018-2022)
8.6.3 Middle East and Africa Pet Insurance Revenue (USD Million) by Applications (2018-2022)
9 Company Profiles
10 Global Pet Insurance Market Revenue (USD Million), by Type, and Applications (2023-2030)
10.1 Global Pet Insurance Revenue (USD Million) and Market Share (%) by Type (2023-2030)
10.1.1 Global Pet Insurance Revenue (USD Million), and Market Share (%) by Type (2023-2030)
10.2 Global Pet Insurance Revenue (USD Million) and Market Share (%) by Applications (2023-2030)
10.2.1 Global Pet Insurance Revenue (USD Million), and Market Share (%) by Applications (2023-2030)
11 Global Pet Insurance Development Regional Status and Outlook Forecast
11.1 Global Pet Insurance Revenue (USD Million) By Regions (2023-2030)
11.2 North America Pet Insurance Revenue (USD Million) by Type, and Applications (2023-2030)
11.2.1 North America Pet Insurance Revenue (USD) Million by Country (2023-2030)
11.2.2 North America Pet Insurance Revenue (USD Million), by Type (2023-2030)
11.2.3 North America Pet Insurance Revenue (USD Million), Market Share (%) by Applications (2023-2030)
11.3 Europe Pet Insurance Revenue (USD Million), by Type, and Applications (2023-2030)
11.3.1 Europe Pet Insurance Revenue (USD Million), by Country (2023-2030)
11.3.2 Europe Pet Insurance Revenue (USD Million), by Type (2023-2030)
11.3.3 Europe Pet Insurance Revenue (USD Million), by Applications (2023-2030)
11.4 Asia Pacific Pet Insurance Revenue (USD Million) by Type, and Applications (2023-2030)
11.4.1 Asia Pacific Pet Insurance Revenue (USD Million), by Country (2023-2030)
11.4.2 Asia Pacific Pet Insurance Revenue (USD Million), by Type (2023-2030)
11.4.3 Asia Pacific Pet Insurance Revenue (USD Million), by Applications (2023-2030)
11.5 South America Pet Insurance Revenue (USD Million), by Type, and Applications (2023-2030)
11.5.1 South America Pet Insurance Revenue (USD Million), by Country (2023-2030)
11.5.2 South America Pet Insurance Revenue (USD Million), by Type (2023-2030)
11.5.3 South America Pet Insurance Revenue (USD Million), by Applications (2023-2030)
11.6 Middle East and Africa Pet Insurance Revenue (USD Million), by Type, and Applications (2023-2030)
11.6.1 Middle East and Africa Pet Insurance Revenue (USD Million), by Region (2023-2030)
11.6.2 Middle East and Africa Pet Insurance Revenue (USD Million), by Type (2023-2030)
11.6.3 Middle East and Africa Pet Insurance Revenue (USD Million), by Applications (2023-2030)
12 Methodology and Data Sources
12.1 Methodology/Research Approach
12.1.1 Research Programs/Design
12.1.2 Market Size Estimation
12.1.3 Market Breakdown and Data Triangulation
12.2 Data Sources
12.2.1 Secondary Sources
12.2.2 Primary Sources
12.3 Disclaimer
List Of Tables
Table 1 Market Segmentation Analysis
Table 2 Global Pet Insurance Market Companies with Areas Served
Table 3 Products Offerings Global Pet Insurance Market
Table 4 Low Growth Scenario Forecasts
Table 5 Reference Case Growth Scenario
Table 6 High Growth Case Scenario
Table 7 Global Pet Insurance Revenue (USD Million) And CAGR (%) By Type (2018-2030)
Table 8 Global Pet Insurance Revenue (USD Million) And CAGR (%) By Applications (2018-2030)
Table 9 Global Pet Insurance Revenue (USD Million) And CAGR (%) By Regions (2018-2030)
Table 10 Global Pet Insurance Revenue (USD Million) By Type (2018-2022)
Table 11 Global Pet Insurance Revenue Market Share (%) By Type (2018-2022)
Table 12 Global Pet Insurance Revenue (USD Million) By Applications (2018-2022)
Table 13 Global Pet Insurance Revenue Market Share (%) By Applications (2018-2022)
Table 14 Global Pet Insurance Market Revenue (USD Million) By Regions (2018-2022)
Table 15 Global Pet Insurance Market Share (%) By Regions (2018-2022)
Table 16 North America Pet Insurance Revenue (USD Million) By Country (2018-2022)
Table 17 North America Pet Insurance Revenue (USD Million) By Type (2018-2022)
Table 18 North America Pet Insurance Revenue (USD Million) By Applications (2018-2022)
Table 19 Europe Pet Insurance Revenue (USD Million) By Country (2018-2022)
Table 20 Europe Pet Insurance Revenue (USD Million) By Type (2018-2022)
Table 21 Europe Pet Insurance Revenue (USD Million) By Applications (2018-2022)
Table 22 Asia Pacific Pet Insurance Revenue (USD Million) By Country (2018-2022)
Table 23 Asia Pacific Pet Insurance Revenue (USD Million) By Type (2018-2022)
Table 24 Asia Pacific Pet Insurance Revenue (USD Million) By Applications (2018-2022)
Table 25 South America Pet Insurance Revenue (USD Million) By Country (2018-2022)
Table 26 South America Pet Insurance Revenue (USD Million) By Type (2018-2022)
Table 27 South America Pet Insurance Revenue (USD Million) By Applications (2018-2022)
Table 28 Middle East and Africa Pet Insurance Revenue (USD Million) By Region (2018-2022)
Table 29 Middle East and Africa Pet Insurance Revenue (USD Million) By Type (2018-2022)
Table 30 Middle East and Africa Pet Insurance Revenue (USD Million) By Applications (2018-2022)
Table 31 Financial Analysis
Table 32 Global Pet Insurance Revenue (USD Million) By Type (2023-2030)
Table 33 Global Pet Insurance Revenue Market Share (%) By Type (2023-2030)
Table 34 Global Pet Insurance Revenue (USD Million) By Applications (2023-2030)
Table 35 Global Pet Insurance Revenue Market Share (%) By Applications (2023-2030)
Table 36 Global Pet Insurance Market Revenue (USD Million), And Revenue (USD Million) By Regions (2023-2030)
Table 37 North America Pet Insurance Revenue (USD)By Country (2023-2030)
Table 38 North America Pet Insurance Revenue (USD Million) By Type (2023-2030)
Table 39 North America Pet Insurance Revenue (USD Million) By Applications (2023-2030)
Table 40 Europe Pet Insurance Revenue (USD Million) By Country (2023-2030)
Table 41 Europe Pet Insurance Revenue (USD Million) By Type (2023-2030)
Table 42 Europe Pet Insurance Revenue (USD Million) By Applications (2023-2030)
Table 43 Asia Pacific Pet Insurance Revenue (USD Million) By Country (2023-2030)
Table 44 Asia Pacific Pet Insurance Revenue (USD Million) By Type (2023-2030)
Table 45 Asia Pacific Pet Insurance Revenue (USD Million) By Applications (2023-2030)
Table 46 South America Pet Insurance Revenue (USD Million) By Country (2023-2030)
Table 47 South America Pet Insurance Revenue (USD Million) By Type (2023-2030)
Table 48 South America Pet Insurance Revenue (USD Million) By Applications (2023-2030)
Table 49 Middle East and Africa Pet Insurance Revenue (USD Million) By Region (2023-2030)
Table 50 Middle East and Africa Pet Insurance Revenue (USD Million) By Region (2023-2030)
Table 51 Middle East and Africa Pet Insurance Revenue (USD Million) By Type (2023-2030)
Table 52 Middle East and Africa Pet Insurance Revenue (USD Million) By Applications (2023-2030)
Table 53 Research Programs/Design for This Report
Table 54 Key Data Information from Secondary Sources
Table 55 Key Data Information from Primary Sources
List Of Figures
Figure 1 Market Scope
Figure 2 Porter’s Five Forces
Figure 3 Global Pet Insurance Revenue (USD Million) By Type (2018-2022)
Figure 4 Global Pet Insurance Revenue Market Share (%) By Type (2022)
Figure 5 Global Pet Insurance Revenue (USD Million) By Applications (2018-2022)
Figure 6 Global Pet Insurance Revenue Market Share (%) By Applications (2022)
Figure 7 Global Pet Insurance Market Revenue (USD Million) By Regions (2018-2022)
Figure 8 Global Pet Insurance Market Share (%) By Regions (2022)
Figure 9 North America Pet Insurance Revenue (USD Million) By Country (2018-2022)
Figure 10 North America Pet Insurance Revenue (USD Million) By Type (2018-2022)
Figure 11 North America Pet Insurance Revenue (USD Million) By Applications (2018-2022)
Figure 12 Europe Pet Insurance Revenue (USD Million) By Country (2018-2022)
Figure 13 Europe Pet Insurance Revenue (USD Million) By Type (2018-2022)
Figure 14 Europe Pet Insurance Revenue (USD Million) By Applications (2018-2022)
Figure 15 Asia Pacific Pet Insurance Revenue (USD Million) By Country (2018-2022)
Figure 16 Asia Pacific Pet Insurance Revenue (USD Million) By Type (2018-2022)
Figure 17 Asia Pacific Pet Insurance Revenue (USD Million) By Applications (2018-2022)
Figure 18 South America Pet Insurance Revenue (USD Million) By Country (2018-2022)
Figure 19 South America Pet Insurance Revenue (USD Million) By Type (2018-2022)
Figure 20 South America Pet Insurance Revenue (USD Million) By Applications (2018-2022)
Figure 21 Middle East and Africa Pet Insurance Revenue (USD Million) By Region (2018-2022)
Figure 22 Middle East and Africa Pet Insurance Revenue (USD Million) By Type (2018-2022)
Figure 23 Middle East and Africa Pet Insurance Revenue (USD Million) By Applications (2018-2022)
Figure 24 Global Pet Insurance Revenue (USD Million) By Type (2023-2030)
Figure 25 Global Pet Insurance Revenue Market Share (%) By Type (2030)
Figure 26 Global Pet Insurance Revenue (USD Million) By Applications (2023-2030)
Figure 27 Global Pet Insurance Revenue Market Share (%) By Applications (2030)
Figure 28 Global Pet Insurance Market Revenue (USD Million) By Regions (2023-2030)
Figure 29 North America Pet Insurance Revenue (USD Million) By Country (2023-2030)
Figure 30 North America Pet Insurance Revenue (USD Million) By Type (2023-2030)
Figure 31 North America Pet Insurance Revenue (USD Million) By Applications (2023-2030)
Figure 32 Europe Pet Insurance Revenue (USD Million) By Country (2023-2030)
Figure 33 Europe Pet Insurance Revenue (USD Million) By Type (2023-2030)
Figure 34 Europe Pet Insurance Revenue (USD Million) By Applications (2023-2030)
Figure 35 Asia Pacific Pet Insurance Revenue (USD Million) By Country (2023-2030)
Figure 36 Asia Pacific Pet Insurance Revenue (USD Million) By Type (2023-2030)
Figure 37 Asia Pacific Pet Insurance Revenue (USD Million) By Applications (2023-2030)
Figure 38 South America Pet Insurance Revenue (USD Million) By Country (2023-2030)
Figure 39 South America Pet Insurance Revenue (USD Million) By Type (2023-2030)
Figure 40 South America Pet Insurance Revenue (USD Million) By Applications (2023-2030)
Figure 41 Middle East and Africa Pet Insurance Revenue (USD Million) By Region (2023-2030)
Figure 42 Middle East and Africa Pet Insurance Revenue (USD Million) By Region (2023-2030)
Figure 43 Middle East and Africa Pet Insurance Revenue (USD Million) By Type (2023-2030)
Figure 44 Middle East and Africa Pet Insurance Revenue (USD Million) By Applications (2023-2030)
Figure 45 Bottom-Up and Top-Down Approaches For This Report
Figure 46 Data Triangulation
