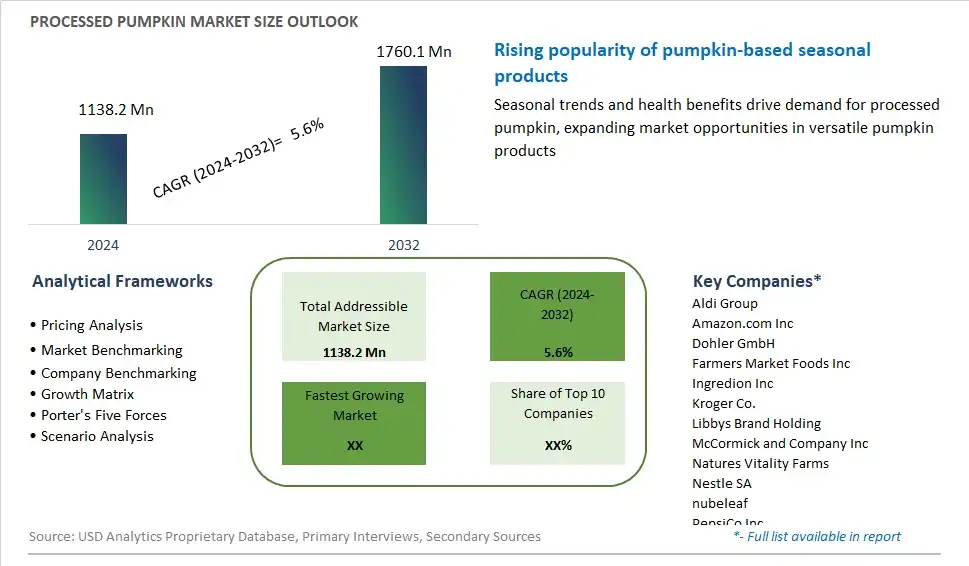
Global Processed Pumpkin Market Size is valued at $1138.2 Million in 2024 and is forecast to register a growth rate (CAGR) of 5.6% to reach $1760.1 Million by 2032.
The global Processed Pumpkin Market Comprehensive Study analyzes and forecasts the market size across 6 regions and 24 countries for diverse segments -By Product (Dried, Puree, Concentrates), By Application (Beverages, Bakery, Snacks, Baby Food, Desserts, Others)
An Introduction to Processed Pumpkin Market
The processed pumpkin market in 2024 is experiencing robust growth, driven by increasing consumer demand for versatile and nutritious pumpkin products. Processed pumpkin, which includes canned pumpkin puree, pumpkin pie filling, and pumpkin-based snacks, is prized for its rich flavor, smooth texture, and high nutritional value, including fiber, vitamins, and antioxidants. Health-conscious consumers are increasingly incorporating processed pumpkin into their diets for its health benefits and culinary versatility. The market is influenced by the growing popularity of seasonal and holiday-themed foods, with pumpkin products being a staple in fall and winter recipes. Innovations in packaging and product formulations have further enhanced the appeal and convenience of processed pumpkin. As awareness of the nutritional benefits of pumpkin continues to grow, the processed pumpkin market is set for sustained growth and diversification.
Processed Pumpkin Competitive Landscape
The market report analyses the leading companies in the industry including Aldi Group, Amazon.com Inc, Dohler GmbH, Farmers Market Foods Inc, Ingredion Inc, Kroger Co., Libbys Brand Holding, McCormick and Company Inc, Natures Vitality Farms, Nestle SA, nubeleaf, PepsiCo Inc, Plum Organics PBC, Seawind International, Target Corp, The Great American Spice Co., Walmart Inc, Whole Life Pet Products, Woodland Foods Ltd, Z Natural Foods LLC, and Others.
Processed Pumpkin Market Dynamics
Processed Pumpkin Market Trend: Diversification of Pumpkin-Based Products
The market for processed pumpkin is witnessing a prominent trend towards the diversification of pumpkin-based products. This trend is driven by the growing popularity of pumpkin as a versatile ingredient in both sweet and savory dishes. Processed pumpkin products such as pumpkin puree, canned pumpkin, pumpkin pie filling, and pumpkin spice blends are increasingly used in various recipes, including soups, desserts, baked goods, and beverages. As consumers seek out innovative and convenient ways to incorporate pumpkin into their diets beyond traditional pumpkin pie, the market for processed pumpkin is expanding to include a wider range of product offerings to meet diverse culinary preferences.
Market Driver: Seasonal Demand and Holiday Traditions
The rapid expansion of the processed pumpkin market is primarily driven by seasonal demand and holiday traditions, particularly during the fall and winter months. Pumpkin-centric holidays such as Halloween, Thanksgiving, and Christmas drive increased consumer interest in pumpkin-based foods and beverages. Processed pumpkin products are a staple ingredient in holiday recipes such as pumpkin pie, pumpkin bread, pumpkin spice lattes, and pumpkin soups, contributing to higher sales and consumption during these festive seasons. Moreover, the association of pumpkin with warmth, comfort, and nostalgia further fuels consumer demand for processed pumpkin products as part of traditional holiday celebrations.
Market Opportunity: Innovation in Healthy and Convenient Pumpkin Products
One significant opportunity within the processed pumpkin market lies in innovation in healthy and convenient pumpkin products to meet the evolving preferences and dietary needs of consumers. Brands can differentiate themselves by offering a wider range of processed pumpkin options, including low-sugar or sugar-free pumpkin products, organic and non-GMO pumpkin options, and pumpkin-based snacks and convenience foods. Additionally, exploring innovative packaging formats such as portion-controlled packs, resealable pouches, and shelf-stable pumpkin products can enhance convenience and appeal to on-the-go consumers. Furthermore, leveraging consumer demand for pumpkin's nutritional benefits, including its rich content of vitamins, minerals, and antioxidants, can create opportunities for premium and functional pumpkin products within the market. Collaborations with nutritionists, chefs, and food scientists can drive product innovation and ensure that processed pumpkin products meet the highest standards of taste, quality, and healthfulness. As the market for processed pumpkin continues to evolve, brands that prioritize innovation, sustainability, and consumer engagement are well-positioned to capitalize on the growing demand for convenient and nutritious pumpkin-based products.
Processed Pumpkin Market Share Analysis: Puree held the dominant market share in 2024
Within the segmented landscape of the Processed Pumpkin Market categorized by Product, Puree is the largest and most prevalent segment, driven by several key factors. Pumpkin puree serves as a versatile ingredient used in a wide array of culinary applications, including soups, sauces, pies, baked goods, and beverages. Its smooth texture, rich flavor, and vibrant color make it a popular choice among consumers and food manufacturers alike. Further, pumpkin puree offers convenience and consistency, eliminating the need for peeling, seeding, and cooking fresh pumpkins. Additionally, the increasing popularity of pumpkin-flavored products and the growing demand for natural and nutrient-rich ingredients fuel the growth of the Puree segment. As consumers seek authentic and high-quality pumpkin products for their culinary creations, the dominance of Pumpkin Puree in the Processed Pumpkin Market is expected to persist, driving overall market sales and growth.
Processed Pumpkin Market Share Analysis: Beverages market is poised to register the fastest growth rae over the forecast period to 2032
In the segmented landscape of the Processed Pumpkin Market categorized by Application, the Beverages category is the fastest-growing segment, propelled by several key factors. Processed pumpkin is increasingly utilized in the beverage industry for its unique flavor profile, nutritional benefits, and versatility. Pumpkin-based beverages such as lattes, smoothies, juices, and shakes have gained popularity among consumers seeking innovative and seasonal drink options. Further, the growing trend of health and wellness, coupled with the perception of pumpkin as a superfood rich in vitamins, minerals, and antioxidants, drives the demand for pumpkin-based beverages. Additionally, the seasonal appeal of pumpkin-flavored beverages, particularly during autumn and winter months, contributes to their rapid growth. As consumers continue to embrace functional and flavorful beverage choices, the Beverages segment is poised for sustained expansion in the Processed Pumpkin Market, reshaping the landscape of pumpkin-based products.
Processed Pumpkin Market Share Analysis: Desserts held the dominant market share in 2024
Within the segmented landscape of the Processed Pumpkin Market categorized by Food, the Desserts category is the largest and most prevalent segment, driven by several key factors. Processed pumpkin is a versatile ingredient widely utilized in various dessert applications, including pies, cakes, muffins, cookies, puddings, and ice creams. Its natural sweetness, smooth texture, and earthy flavor profile make it a popular choice among consumers and food manufacturers alike. Further, desserts featuring pumpkin evoke feelings of warmth, comfort, and nostalgia, particularly during the fall and winter seasons. The popularity of pumpkin-flavored desserts extends beyond traditional holidays, with consumers seeking pumpkin treats year-round. Additionally, the growing interest in plant-based and naturally flavored desserts fuels the demand for pumpkin-based desserts as a wholesome and indulgent option. As consumers continue to crave delicious and innovative dessert choices, the dominance of the Desserts segment in the Processed Pumpkin Market is expected to persist, driving overall market sales and growth.
Processed Pumpkin Market Segmentation
By Product
Dried
Puree
Concentrates
By Application
Beverages
Bakery
Snacks
Baby Food
Desserts
Others
Countries Analyzed
North America (US, Canada, Mexico)
Europe (Germany, UK, France, Spain, Italy, Russia, Rest of Europe)
Asia Pacific (China, India, Japan, South Korea, Australia, South East Asia, Rest of Asia)
South America (Brazil, Argentina, Rest of South America)
Middle East and Africa (Saudi Arabia, UAE, Rest of Middle East, South Africa, Egypt, Rest of Africa)
Processed Pumpkin Companies Profiled in the Study
Aldi Group
Amazon.com Inc
Dohler GmbH
Farmers Market Foods Inc
Ingredion Inc
Kroger Co.
Libbys Brand Holding
McCormick and Company Inc
Natures Vitality Farms
Nestle SA
nubeleaf
PepsiCo Inc
Plum Organics PBC
Seawind International
Target Corp
The Great American Spice Co.
Walmart Inc
Whole Life Pet Products
Woodland Foods Ltd
Z Natural Foods LLC
*- List Not Exhaustive
Chapter 1. TABLE OF CONTENTS
Chapter 2. Introduction to Processed Pumpkin Market
2.1. Market Overview
2.2. Key Statistics and Report Highlights
2.3. Scope of the Comprehensive Study
2.3.1. Market Definition
2.3.2 Countries and Regions Covered
2.3.3 Research Objective
2.3.4 Units, Currency, and Conversions
2.3.5 Industry Value Chain
2.4. Key Market Segments
2.5. Key Companies
2.6. Study Period
Chapter 3. Strategic Analysis Review
3.1. Processed Pumpkin Pricing Analysis and Forecast
3.2. Porter’s Five Forces
3.3. Market Ecosystem
3.4. SWOT Analysis
3.5. Regulatory Scenario
3.3. Effects of Inflation, Russia-Ukraine War, moderating economic growth, and other macroeconomic factors
Chapter 4. Competitive Landscape
4.1. Market Share Analysis
4.1.1. Global Processed Pumpkin Market Share by Company, 2023
4.1.2. Product Offerings of Leading Processed Pumpkin Companies
4.2. Market Entropy
4.2.1. New Product Launches in the Industry
4.2.2. Mergers, Acquisitions, Joint ventures, and Partnerships
4.3. Key Strategies and Best Practices
Chapter 5. Global Market Projections: Best, Reference, and Low Case Scenarios
5.1. Growth Analysis- Case Scenario Definitions
5.2. Low Growth Case Scenario Forecasts
5.3. Reference Growth Case Scenario Forecasts
5.4. High Growth Case Scenario Forecasts
Chapter 6. Market Dynamics
6.1. Processed Pumpkin Market Drivers
6.2. Processed Pumpkin Market Challenges
6.6. Processed Pumpkin Market Opportunities
6.4. Processed Pumpkin Market Trends
Chapter 7. Global Processed Pumpkin Market Outlook Trends
7.1. Global Processed Pumpkin Revenue (USD Million) and CAGR (%) by Type (2021-2032)
7.2. Global Processed Pumpkin Revenue (USD Million) and CAGR (%) by Application (2021-2032)
7.3. Global Processed Pumpkin Revenue (USD Million) and CAGR (%) by Product (2021-2032)
By Product
Dried
Puree
Concentrates
By Application
Beverages
Bakery
Snacks
Baby Food
Desserts
Others
Chapter 8. Global Processed Pumpkin Regional Analysis and Outlook
8.1. Global Processed Pumpkin Revenue (USD Million) By Regions (2021- 2032)
8.2. North America Processed Pumpkin Revenue (USD Million) by Country (2021-2032)
8.2.1. United States Processed Pumpkin Regional Analysis and Outlook
8.2.2. Canada Processed Pumpkin Regional Analysis and Outlook
8.2.3. Mexico Processed Pumpkin Regional Analysis and Outlook
8.3. Europe Processed Pumpkin Revenue (USD Million), by Country (2021-2032)
8.3.1. Germany Processed Pumpkin Regional Analysis and Outlook
8.3.2. France Processed Pumpkin Regional Analysis and Outlook
8.3.3. United Kingdom Processed Pumpkin Regional Analysis and Outlook
8.3.4. Spain Processed Pumpkin Regional Analysis and Outlook
8.3.5. Italy Processed Pumpkin Regional Analysis and Outlook
8.3.6. Russia Processed Pumpkin Regional Analysis and Outlook
8.3.7. Rest of Europe Processed Pumpkin Regional Analysis and Outlook
8.4. Asia Pacific Processed Pumpkin Revenue (USD Million) by Country (2021-2032)
8.4.1. China Processed Pumpkin Regional Analysis and Outlook
8.4.2. Japan Processed Pumpkin Regional Analysis and Outlook
8.4.3. India Processed Pumpkin Regional Analysis and Outlook
8.4.4. South Korea Processed Pumpkin Regional Analysis and Outlook
8.4.5. Australia Processed Pumpkin Regional Analysis and Outlook
8.4.6. South East Asia Processed Pumpkin Regional Analysis and Outlook
8.4.7. Rest of Asia Pacific Processed Pumpkin Regional Analysis and Outlook
8.5. South America Processed Pumpkin Revenue (USD Million), by Country (2021-2032)
8.5.1. Brazil Processed Pumpkin Regional Analysis and Outlook
8.5.2. Argentina Processed Pumpkin Regional Analysis and Outlook
8.5.3. Rest of South America Processed Pumpkin Regional Analysis and Outlook
8.6. Middle East and Africa Processed Pumpkin Revenue (USD Million) by Country (2021-2032)
8.6.1. Middle East Processed Pumpkin Regional Analysis and Outlook
8.6.2. Africa Processed Pumpkin Regional Analysis and Outlook
Chapter 9. North America Processed Pumpkin Analysis and Outlook
9.1. North America Processed Pumpkin Revenue (USD Million) by Segments (2021-2032)
9.1.1. North America Processed Pumpkin Revenue (USD Million) by Type (2021-2032)
9.1.2. North America Processed Pumpkin Revenue (USD Million) by Application (2021-2032)
9.1.3. North America Processed Pumpkin Revenue (USD Million) by Product (2021-2032)
By Product
Dried
Puree
Concentrates
By Application
Beverages
Bakery
Snacks
Baby Food
Desserts
Others
Chapter 10. Europe Processed Pumpkin Analysis and Outlook
10.1. Europe Processed Pumpkin Revenue (USD Million), by Segments (USD Million) (2021-2032)
10.1.1. Europe Processed Pumpkin Revenue (USD Million) by Type (2021-2032)
10.1.2. Europe Processed Pumpkin Revenue (USD Million) by Application (2021-2032)
10.1.3. Europe Processed Pumpkin Revenue (USD Million) by Product (2021-2032)
By Product
Dried
Puree
Concentrates
By Application
Beverages
Bakery
Snacks
Baby Food
Desserts
Others
Chapter 11. Asia Pacific Processed Pumpkin Analysis and Outlook
11.1. Asia Pacific Processed Pumpkin Revenue (USD Million), and Revenue (USD Million) by Segments (2021-2032)
11.1.1. Asia Pacific Processed Pumpkin Revenue (USD Million) by Type (2021-2032)
11.1.2. Asia Pacific Processed Pumpkin Revenue (USD Million) by Application (2021-2032)
11.1.3. Asia Pacific Processed Pumpkin Revenue (USD Million) by Product (2021-2032)
By Product
Dried
Puree
Concentrates
By Application
Beverages
Bakery
Snacks
Baby Food
Desserts
Others
Chapter 12. South America Processed Pumpkin Analysis and Outlook
12.1. South America Processed Pumpkin Revenue (USD Million), by Segments (2021-2032)
12.1.1. South America Processed Pumpkin Revenue (USD Million) by Type (2021-2032)
12.1.2. South America Processed Pumpkin Revenue (USD Million) by Application (2021-2032)
12.1.3. South America Processed Pumpkin Revenue (USD Million) by Product (2021-2032)
By Product
Dried
Puree
Concentrates
By Application
Beverages
Bakery
Snacks
Baby Food
Desserts
Others
Chapter 13. Middle East and Africa Processed Pumpkin Analysis and Outlook
13.1. Middle East and Africa Processed Pumpkin Revenue (USD Million), by Segments (2021-2032)
13.1.1. Middle East and Africa Processed Pumpkin Revenue (USD Million) by Type (2021-2032)
13.1.2. Middle East and Africa Processed Pumpkin Revenue (USD Million) by Application (2021-2032)
13.1.3. Middle East and Africa Processed Pumpkin Revenue (USD Million) by Product (2021-2032)
By Product
Dried
Puree
Concentrates
By Application
Beverages
Bakery
Snacks
Baby Food
Desserts
Others
Chapter 14. Processed Pumpkin Company Profiles
14.1 Business Overview
14.2 Product Profiles
14.3 SWOT Profiles
14.5 Recent Developments
14.6 Financial Profile
List of Companies
Aldi Group
Amazon.com Inc
Dohler GmbH
Farmers Market Foods Inc
Ingredion Inc
Kroger Co.
Libbys Brand Holding
McCormick and Company Inc
Natures Vitality Farms
Nestle SA
nubeleaf
PepsiCo Inc
Plum Organics PBC
Seawind International
Target Corp
The Great American Spice Co.
Walmart Inc
Whole Life Pet Products
Woodland Foods Ltd
Z Natural Foods LLC
15. Methodology and Data Sources
15.1 Customization Offerings
15.2 Subscription Services
15.3 Related Reports
15.4 Publisher Expertise
LIST OF TABLES
Table 1 Market Segmentation Analysis
Table 2 Global Processed Pumpkin Market Share of Leading Companies, 2023
Table 3 Product Offerings of Leading Companies
Table 4 Low Growth Scenario Forecasts
Table 5 Reference Case Growth Scenario
Table 6 High Growth Case Scenario
Table 7 Global Processed Pumpkin Revenue (USD Million) And CAGR (%) By Type (2021-2032)
Table 8 Global Processed Pumpkin Revenue (USD Million) And CAGR (%) By Application (2021-2032)
Table 9 Global Processed Pumpkin Revenue (USD Million) And CAGR (%) By Product (2021-2032)
Table 10 Global Processed Pumpkin Market Revenue (USD Million) By Regions (2021-2032)
Table 11 Global Processed Pumpkin Market Share (%) By Regions (2021-2032)
Table 12 North America Processed Pumpkin Revenue (USD Million) By Country (2021-2032)
Table 13 Europe Processed Pumpkin Revenue (USD Million) By Country (2021-2032)
Table 14 Asia Pacific Processed Pumpkin Revenue (USD Million) By Country (2021-2032)
Table 15 South America Processed Pumpkin Revenue (USD Million) By Country (2021-2032)
Table 16 Middle East and Africa Processed Pumpkin Revenue (USD Million) By Region (2021-2032)
Table 17 North America Processed Pumpkin Revenue (USD Million) By Type (2021-2032)
Table 18 North America Processed Pumpkin Revenue (USD Million) By Application (2021-2032)
Table 19 North America Processed Pumpkin Revenue (USD Million) By Product (2021-2032)
Table 20 Europe Processed Pumpkin Revenue (USD Million) By Type (2021-2032)
Table 21 Europe Processed Pumpkin Revenue (USD Million) By Application (2021-2032)
Table 22 Europe Processed Pumpkin Revenue (USD Million) By Product (2021-2032)
Table 23 Asia Pacific Processed Pumpkin Revenue (USD Million) By Type (2021-2032)
Table 24 Asia Pacific Processed Pumpkin Revenue (USD Million) By Application (2021-2032)
Table 25 Asia Pacific Processed Pumpkin Revenue (USD Million) By Product (2021-2032)
Table 26 South America Processed Pumpkin Revenue (USD Million) By Type (2021-2032)
Table 27 South America Processed Pumpkin Revenue (USD Million) By Application (2021-2032)
Table 28 South America Processed Pumpkin Revenue (USD Million) By Product (2021-2032)
Table 29 Middle East and Africa Processed Pumpkin Revenue (USD Million) By Type (2021-2032)
Table 30 Middle East and Africa Processed Pumpkin Revenue (USD Million) By Application (2021-2032)
Table 31 Middle East and Africa Processed Pumpkin Revenue (USD Million) By Product (2021-2032)
LIST OF FIGURES
Figure 1. Market Scope
Figure 2. Pricing Forecasts Per Unit, 2023- 2032
Figure 3. Porter’s Five Forces
Figure 4. Global Processed Pumpkin Market Revenue (USD Million) By Regions (2021-2032)
Figure 5. Global Processed Pumpkin Market Share (%) By Regions (2023)
Figure 6. North America Processed Pumpkin Revenue (USD Million) By Country (2021-2032)
Figure 7. United States Processed Pumpkin Revenue (USD Million) By Country (2021-2032)
Figure 8. Canada Processed Pumpkin Revenue (USD Million) By Country (2021-2032)
Figure 9. Mexico Processed Pumpkin Revenue (USD Million) By Country (2021-2032)
Figure 10. Europe Processed Pumpkin Revenue (USD Million) By Country (2021-2032)
Figure 11. Germany Processed Pumpkin Revenue (USD Million) By Country (2021-2032)
Figure 12. France Processed Pumpkin Revenue (USD Million) By Country (2021-2032)
Figure 13. United Kingdom Processed Pumpkin Revenue (USD Million) By Country (2021-2032)
Figure 14. Spain Processed Pumpkin Revenue (USD Million) By Country (2021-2032)
Figure 15. Italy Processed Pumpkin Revenue (USD Million) By Country (2021-2032)
Figure 16. Russia Processed Pumpkin Revenue (USD Million) By Country (2021-2032)
Figure 17. Rest of Europe Processed Pumpkin Revenue (USD Million) By Country (2021-2032)
Figure 11. Asia Pacific Processed Pumpkin Revenue (USD Million) By Country (2021-2032)
Figure 12. China Processed Pumpkin Revenue (USD Million) By Country (2021-2032)
Figure 13. Japan Processed Pumpkin Revenue (USD Million) By Country (2021-2032)
Figure 14. India Processed Pumpkin Revenue (USD Million) By Country (2021-2032)
Figure 15. South Korea Processed Pumpkin Revenue (USD Million) By Country (2021-2032)
Figure 16. Australia Processed Pumpkin Revenue (USD Million) By Country (2021-2032)
Figure 17. South East Asia Processed Pumpkin Revenue (USD Million) By Country (2021-2032)
Figure 18. South America Processed Pumpkin Revenue (USD Million) By Country (2021-2032)
Figure 19. Brazil Processed Pumpkin Revenue (USD Million) By Country (2021-2032)
Figure 20. Argentina Processed Pumpkin Revenue (USD Million) By Country (2021-2032)
Figure 21. Rest of Asia Pacific Processed Pumpkin Revenue (USD Million) By Country (2021-2032)
Figure 22. Middle East and Africa Processed Pumpkin Revenue (USD Million) By Region (2021-2032)
Figure 23. Saudi Arabia Processed Pumpkin Revenue (USD Million) By Region (2021-2032)
Figure 24. The UAE Processed Pumpkin Revenue (USD Million) By Region (2021-2032)
Figure 25. Rest of Middle East Processed Pumpkin Revenue (USD Million) By Region (2021-2032)
Figure 26. South Africa Processed Pumpkin Revenue (USD Million) By Region (2021-2032)
Figure 27. Africa Processed Pumpkin Revenue (USD Million) By Region (2021-2032)
Figure 28. North America Processed Pumpkin Revenue (USD Million) By Type (2021-2032)
Figure 29. North America Processed Pumpkin Revenue (USD Million) By Application (2021-2032)
Figure 30. North America Processed Pumpkin Revenue (USD Million) By Product (2021-2032)
Figure 31. Europe Processed Pumpkin Revenue (USD Million) By Type (2021-2032)
Figure 32. Europe Processed Pumpkin Revenue (USD Million) By Application (2021-2032)
Figure 33. Europe Processed Pumpkin Revenue (USD Million) By Product (2021-2032)
Figure 34. Asia Pacific Processed Pumpkin Revenue (USD Million) By Type (2021-2032)
Figure 35. Asia Pacific Processed Pumpkin Revenue (USD Million) By Application (2021-2032)
Figure 36. Asia Pacific Processed Pumpkin Revenue (USD Million) By Product (2021-2032)
Figure 37. South America Processed Pumpkin Revenue (USD Million) By Type (2021-2032)
Figure 38. South America Processed Pumpkin Revenue (USD Million) By Application (2021-2032)
Figure 39. South America Processed Pumpkin Revenue (USD Million) By Product (2021-2032)
Figure 40. Middle East and Africa Processed Pumpkin Revenue (USD Million) By Type (2021-2032)
Figure 41. Middle East and Africa Processed Pumpkin Revenue (USD Million) By Application (2021-2032)
Figure 42. Middle East and Africa Processed Pumpkin Revenue (USD Million) By Product (2021-2032)
By Product
Dried
Puree
Concentrates
By Application
Beverages
Bakery
Snacks
Baby Food
Desserts
Others
Countries Analyzed
North America (US, Canada, Mexico)
Europe (Germany, UK, France, Spain, Italy, Russia, Rest of Europe)
Asia Pacific (China, India, Japan, South Korea, Australia, South East Asia, Rest of Asia)
South America (Brazil, Argentina, Rest of South America)
Middle East and Africa (Saudi Arabia, UAE, Rest of Middle East, South Africa, Egypt, Rest of Africa)
