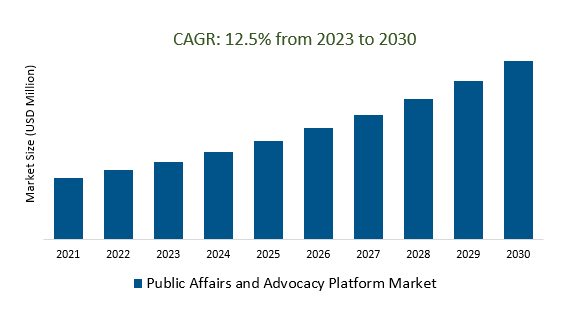
The Global Public Affairs and Advocacy Platform Market Size is estimated to register 12.5% growth over the forecast period from 2023 to 2030.
The market growth is driven by the increasing adoption of digital platforms and social media for advocacy and public affairs efforts is a significant trend. Platforms that offer social media monitoring, sentiment analysis, and engagement tracking are in demand. Leading companies focusing on Increased Digitalization, Advanced Analytics and AI, Greater Emphasis on Data Privacy and Security, and others to boost market shares in the industry.
Market Overview
The Public Affairs and Advocacy Platform Market offers software solutions to support organizations in lobbying, grassroots mobilization, stakeholder engagement, and legislative tracking. Key features include data analytics, social media integration, compliance reporting, and event management. Market participants like Phone2Action, CQ Roll Call, and Nation Builder provide these tools. Key trends include digital transformation, data analytics and AI, global expansion, security and compliance, and grassroots mobilization, making these platforms essential for organizations seeking to engage with stakeholders and influence public policy.
Market Dynamics
Market Trends- Companies are launching Data Analytics and AI to attract a consumer base
Data analytics and artificial intelligence (AI) are fundamental components of the Public Affairs and Advocacy Platform Market, offering organizations the means to optimize advocacy strategies, personalize outreach, and gauge public sentiment with precision. These technologies empower platforms to perform sentiment analysis, predict policy outcomes, automate campaign optimization, target key influencers, ensure compliance, and adapt messaging in real time. Leveraging data analytics and AI, advocacy professionals can make informed decisions, engage stakeholders effectively across channels, and navigate dynamic policy landscapes with agility, enhancing the impact and efficiency of their advocacy efforts significantly.
Market Driver- Security and Privacy demand for efficient Public Affairs and Advocacy Platform Market
Security and privacy are paramount concerns within the Public Affairs and Advocacy Platform Market. Given the sensitive nature of political and advocacy-related data, these platforms prioritize robust security measures and compliance with data protection regulations. This includes encryption protocols to safeguard user data, access controls to restrict unauthorized access, and regular security audits to identify vulnerabilities. Additionally, adherence to data privacy regulations such as GDPR and CCPA is essential, ensuring that user consent is obtained for data collection and processing. As advocacy platforms often handle sensitive information, the assurance of data privacy and security not only fosters trust among users but also mitigates legal and reputational risks for organizations.
Market Opportunity-Introduction of Social Responsibility and ESG
Social Responsibility and ESG (Environmental, Social, and Governance) considerations are gaining prominence in the Public Affairs and Advocacy Platform Market. These platforms are adapting to help organizations manage ESG initiatives, engage stakeholders on sustainability issues, and transparently report progress. They also enable advocacy on ESG topics, aligning with the broader shift towards ethical and sustainable practices in business and society, enhancing organizations' reputations and societal impact.
Market Share Analysis- Cloud based Public Affairs and Advocacy Platform Market will register the fastest growth
The Global Public Affairs and Advocacy Platform Market is analyzed across Cloud-Based, On-Premises, and others. Of these, cloud-based registers the fastest growth. Cloud-based solutions are increasingly favored in the Public Affairs and Advocacy Platform Market for their scalability, accessibility, and streamlined maintenance. These platforms offer users the ability to access advocacy tools and data remotely, facilitate real-time collaboration, and integrate seamlessly with other cloud services. These advantages make cloud-based solutions a popular choice for organizations aiming to enhance the efficiency and agility of their advocacy efforts in the digital age.
Market Share Analysis- Enterprises held a significant market share in 2023
The Global Public Affairs and Advocacy Platform Market is analyzed across a wide range of applications including Enterprises, Nonprofits and Associations, and others. Of these, Enterprises held a significant market share in 2023. Enterprises are a significant segment of the Public Affairs and Advocacy Platform Market, relying on these platforms to manage and streamline their advocacy efforts. These platforms offer large organizations tools for legislative tracking, grassroots mobilization, stakeholder engagement, and compliance management. They enable enterprises to monitor policy developments, engage with supporters, analyze data, and optimize advocacy campaigns on a large scale. With growing complexities in public affairs and advocacy, enterprises increasingly turn to these platforms to effectively influence public policy, engage stakeholders, and ensure compliance with regulatory requirements, making them a crucial market segment in this domain.
Public Affairs and Advocacy Platform Market Segmentation
By Type
By Application
- Enterprises
- Nonprofits and Associations
By Region
- North America (United States, Canada, Mexico)
- Europe (Germany, France, United Kingdom, Spain, Italy, Others)
- Asia Pacific (China, India, Japan, South Korea, Australia, Others)
- Latin America (Brazil, Argentina, Others)
- Middle East and Africa (Saudi Arabia, UAE, Kuwait, Other Middle East, South Africa, Nigeria, Other Africa)
Public Affairs and Advocacy Platform Market companies
- NationBuilder
- FiscalNote
- Phone2Action
- EveryAction's Digital Tools
- Muster
- Salsa Labs
- DDC Advocacy
- Bloomberg Industry Group
- Blue Utopia
- Capitolimpact
- CivicEngine
- Rally Congress
- Soft Edge
- Crowdpac
- BroadStripes
- Engaging Networks
- Gulf Partyline
- Ecanvasser
- Quorum
* List not exhaustive
Public Affairs and Advocacy Platform Market Outlook 2023
1 Market Overview
1.1 Introduction to the Public Affairs and Advocacy Platform Market
1.2 Scope of the Study
1.3 Research Objective
1.3.1 Key Market Scope and Segments
1.3.2 Players Covered
1.3.3 Years Considered
2 Executive Summary
2.1 2023 Public Affairs and Advocacy Platform Industry- Market Statistics
3 Market Dynamics
3.1 Market Drivers
3.2 Market Challenges
3.3 Market Opportunities
3.4 Market Trends
4 Market Factor Analysis
4.1 Porter’s Five Forces
4.2 Market Entropy
4.2.1 Global Public Affairs and Advocacy Platform Market Companies with Area Served
4.2.2 Products Offerings Global Public Affairs and Advocacy Platform Market
5 COVID-19 Impact Analysis and Outlook Scenarios
5.1.1 Covid-19 Impact Analysis
5.1.2 Post-COVID-19 Scenario- Low Growth Case
5.1.3 Post-COVID-19 Scenario- Reference Growth Case
5.1.4 Post-COVID-19 Scenario- Low Growth Case
6 Global Public Affairs and Advocacy Platform Market Trends
6.1 Global Public Affairs and Advocacy Platform Revenue (USD Million) and CAGR (%) by Type (2018-2030)
6.2 Global Public Affairs and Advocacy Platform Revenue (USD Million) and CAGR (%) by Applications (2018-2030)
6.3 Global Public Affairs and Advocacy Platform Revenue (USD Million) and CAGR (%) by Regions (2018-2030)
7 Global Public Affairs and Advocacy Platform Market Revenue (USD Million) by Type, and Applications (2018-2022)
7.1 Global Public Affairs and Advocacy Platform Revenue (USD Million) by Type (2018-2022)
7.1.1 Global Public Affairs and Advocacy Platform Revenue (USD Million), Market Share (%) by Type (2018-2022)
7.2 Global Public Affairs and Advocacy Platform Revenue (USD Million) by Applications (2018-2022)
7.2.1 Global Public Affairs and Advocacy Platform Revenue (USD Million), Market Share (%) by Applications (2018-2022)
8 Global Public Affairs and Advocacy Platform Development Regional Status and Outlook
8.1 Global Public Affairs and Advocacy Platform Revenue (USD Million) By Regions (2018-2022)
8.2 North America Public Affairs and Advocacy Platform Revenue (USD Million) by Type, and Application (2018-2022)
8.2.1 North America Public Affairs and Advocacy Platform Revenue (USD Million) by Country (2018-2022)
8.2.2 North America Public Affairs and Advocacy Platform Revenue (USD Million) by Type (2018-2022)
8.2.3 North America Public Affairs and Advocacy Platform Revenue (USD Million) by Applications (2018-2022)
8.3 Europe Public Affairs and Advocacy Platform Revenue (USD Million), by Type, and Applications (USD Million) (2018-2022)
8.3.1 Europe Public Affairs and Advocacy Platform Revenue (USD Million), by Country (2018-2022)
8.3.2 Europe Public Affairs and Advocacy Platform Revenue (USD Million) by Type (2018-2022)
8.3.3 Europe Public Affairs and Advocacy Platform Revenue (USD Million) by Applications (2018-2022)
8.4 Asia Pacific Public Affairs and Advocacy Platform Revenue (USD Million), and Revenue (USD Million) by Type, and Applications (2018-2022)
8.4.1 Asia Pacific Public Affairs and Advocacy Platform Revenue (USD Million) by Country (2018-2022)
8.4.2 Asia Pacific Public Affairs and Advocacy Platform Revenue (USD Million) by Type (2018-2022)
8.4.3 Asia Pacific Public Affairs and Advocacy Platform Revenue (USD Million) by Applications (2018-2022)
8.5 South America Public Affairs and Advocacy Platform Revenue (USD Million), by Type, and Applications (2018-2022)
8.5.1 South America Public Affairs and Advocacy Platform Revenue (USD Million), by Country (2018-2022)
8.5.2 South America Public Affairs and Advocacy Platform Revenue (USD Million) by Type (2018-2022)
8.5.3 South America Public Affairs and Advocacy Platform Revenue (USD Million) by Applications (2018-2022)
8.6 Middle East and Africa Public Affairs and Advocacy Platform Revenue (USD Million), by Type, Technology, Application, Thickness (2018-2022)
8.6.1 Middle East and Africa Public Affairs and Advocacy Platform Revenue (USD Million) by Country (2018-2022)
8.6.2 Middle East and Africa Public Affairs and Advocacy Platform Revenue (USD Million) by Type (2018-2022)
8.6.3 Middle East and Africa Public Affairs and Advocacy Platform Revenue (USD Million) by Applications (2018-2022)
9 Company Profiles
10 Global Public Affairs and Advocacy Platform Market Revenue (USD Million), by Type, and Applications (2023-2030)
10.1 Global Public Affairs and Advocacy Platform Revenue (USD Million) and Market Share (%) by Type (2023-2030)
10.1.1 Global Public Affairs and Advocacy Platform Revenue (USD Million), and Market Share (%) by Type (2023-2030)
10.2 Global Public Affairs and Advocacy Platform Revenue (USD Million) and Market Share (%) by Applications (2023-2030)
10.2.1 Global Public Affairs and Advocacy Platform Revenue (USD Million), and Market Share (%) by Applications (2023-2030)
11 Global Public Affairs and Advocacy Platform Development Regional Status and Outlook Forecast
11.1 Global Public Affairs and Advocacy Platform Revenue (USD Million) By Regions (2023-2030)
11.2 North America Public Affairs and Advocacy Platform Revenue (USD Million) by Type, and Applications (2023-2030)
11.2.1 North America Public Affairs and Advocacy Platform Revenue (USD) Million by Country (2023-2030)
11.2.2 North America Public Affairs and Advocacy Platform Revenue (USD Million), by Type (2023-2030)
11.2.3 North America Public Affairs and Advocacy Platform Revenue (USD Million), Market Share (%) by Applications (2023-2030)
11.3 Europe Public Affairs and Advocacy Platform Revenue (USD Million), by Type, and Applications (2023-2030)
11.3.1 Europe Public Affairs and Advocacy Platform Revenue (USD Million), by Country (2023-2030)
11.3.2 Europe Public Affairs and Advocacy Platform Revenue (USD Million), by Type (2023-2030)
11.3.3 Europe Public Affairs and Advocacy Platform Revenue (USD Million), by Applications (2023-2030)
11.4 Asia Pacific Public Affairs and Advocacy Platform Revenue (USD Million) by Type, and Applications (2023-2030)
11.4.1 Asia Pacific Public Affairs and Advocacy Platform Revenue (USD Million), by Country (2023-2030)
11.4.2 Asia Pacific Public Affairs and Advocacy Platform Revenue (USD Million), by Type (2023-2030)
11.4.3 Asia Pacific Public Affairs and Advocacy Platform Revenue (USD Million), by Applications (2023-2030)
11.5 South America Public Affairs and Advocacy Platform Revenue (USD Million), by Type, and Applications (2023-2030)
11.5.1 South America Public Affairs and Advocacy Platform Revenue (USD Million), by Country (2023-2030)
11.5.2 South America Public Affairs and Advocacy Platform Revenue (USD Million), by Type (2023-2030)
11.5.3 South America Public Affairs and Advocacy Platform Revenue (USD Million), by Applications (2023-2030)
11.6 Middle East and Africa Public Affairs and Advocacy Platform Revenue (USD Million), by Type, and Applications (2023-2030)
11.6.1 Middle East and Africa Public Affairs and Advocacy Platform Revenue (USD Million), by Region (2023-2030)
11.6.2 Middle East and Africa Public Affairs and Advocacy Platform Revenue (USD Million), by Type (2023-2030)
11.6.3 Middle East and Africa Public Affairs and Advocacy Platform Revenue (USD Million), by Applications (2023-2030)
12 Methodology and Data Sources
12.1 Methodology/Research Approach
12.1.1 Research Programs/Design
12.1.2 Market Size Estimation
12.1.3 Market Breakdown and Data Triangulation
12.2 Data Sources
12.2.1 Secondary Sources
12.2.2 Primary Sources
12.3 Disclaimer
List of Tables
Table 1 Market Segmentation Analysis
Table 2 Global Public Affairs and Advocacy Platform Market Companies with Areas Served
Table 3 Products Offerings Global Public Affairs and Advocacy Platform Market
Table 4 Low Growth Scenario Forecasts
Table 5 Reference Case Growth Scenario
Table 6 High Growth Case Scenario
Table 7 Global Public Affairs and Advocacy Platform Revenue (USD Million) And CAGR (%) By Type (2018-2030)
Table 8 Global Public Affairs and Advocacy Platform Revenue (USD Million) And CAGR (%) By Applications (2018-2030)
Table 9 Global Public Affairs and Advocacy Platform Revenue (USD Million) And CAGR (%) By Regions (2018-2030)
Table 10 Global Public Affairs and Advocacy Platform Revenue (USD Million) By Type (2018-2022)
Table 11 Global Public Affairs and Advocacy Platform Revenue Market Share (%) By Type (2018-2022)
Table 12 Global Public Affairs and Advocacy Platform Revenue (USD Million) By Applications (2018-2022)
Table 13 Global Public Affairs and Advocacy Platform Revenue Market Share (%) By Applications (2018-2022)
Table 14 Global Public Affairs and Advocacy Platform Market Revenue (USD Million) By Regions (2018-2022)
Table 15 Global Public Affairs and Advocacy Platform Market Share (%) By Regions (2018-2022)
Table 16 North America Public Affairs and Advocacy Platform Revenue (USD Million) By Country (2018-2022)
Table 17 North America Public Affairs and Advocacy Platform Revenue (USD Million) By Type (2018-2022)
Table 18 North America Public Affairs and Advocacy Platform Revenue (USD Million) By Applications (2018-2022)
Table 19 Europe Public Affairs and Advocacy Platform Revenue (USD Million) By Country (2018-2022)
Table 20 Europe Public Affairs and Advocacy Platform Revenue (USD Million) By Type (2018-2022)
Table 21 Europe Public Affairs and Advocacy Platform Revenue (USD Million) By Applications (2018-2022)
Table 22 Asia Pacific Public Affairs and Advocacy Platform Revenue (USD Million) By Country (2018-2022)
Table 23 Asia Pacific Public Affairs and Advocacy Platform Revenue (USD Million) By Type (2018-2022)
Table 24 Asia Pacific Public Affairs and Advocacy Platform Revenue (USD Million) By Applications (2018-2022)
Table 25 South America Public Affairs and Advocacy Platform Revenue (USD Million) By Country (2018-2022)
Table 26 South America Public Affairs and Advocacy Platform Revenue (USD Million) By Type (2018-2022)
Table 27 South America Public Affairs and Advocacy Platform Revenue (USD Million) By Applications (2018-2022)
Table 28 Middle East and Africa Public Affairs and Advocacy Platform Revenue (USD Million) By Region (2018-2022)
Table 29 Middle East and Africa Public Affairs and Advocacy Platform Revenue (USD Million) By Type (2018-2022)
Table 30 Middle East and Africa Public Affairs and Advocacy Platform Revenue (USD Million) By Applications (2018-2022)
Table 31 Financial Analysis
Table 32 Global Public Affairs and Advocacy Platform Revenue (USD Million) By Type (2023-2030)
Table 33 Global Public Affairs and Advocacy Platform Revenue Market Share (%) By Type (2023-2030)
Table 34 Global Public Affairs and Advocacy Platform Revenue (USD Million) By Applications (2023-2030)
Table 35 Global Public Affairs and Advocacy Platform Revenue Market Share (%) By Applications (2023-2030)
Table 36 Global Public Affairs and Advocacy Platform Market Revenue (USD Million), And Revenue (USD Million) By Regions (2023-2030)
Table 37 North America Public Affairs and Advocacy Platform Revenue (USD)By Country (2023-2030)
Table 38 North America Public Affairs and Advocacy Platform Revenue (USD Million) By Type (2023-2030)
Table 39 North America Public Affairs and Advocacy Platform Revenue (USD Million) By Applications (2023-2030)
Table 40 Europe Public Affairs and Advocacy Platform Revenue (USD Million) By Country (2023-2030)
Table 41 Europe Public Affairs and Advocacy Platform Revenue (USD Million) By Type (2023-2030)
Table 42 Europe Public Affairs and Advocacy Platform Revenue (USD Million) By Applications (2023-2030)
Table 43 Asia Pacific Public Affairs and Advocacy Platform Revenue (USD Million) By Country (2023-2030)
Table 44 Asia Pacific Public Affairs and Advocacy Platform Revenue (USD Million) By Type (2023-2030)
Table 45 Asia Pacific Public Affairs and Advocacy Platform Revenue (USD Million) By Applications (2023-2030)
Table 46 South America Public Affairs and Advocacy Platform Revenue (USD Million) By Country (2023-2030)
Table 47 South America Public Affairs and Advocacy Platform Revenue (USD Million) By Type (2023-2030)
Table 48 South America Public Affairs and Advocacy Platform Revenue (USD Million) By Applications (2023-2030)
Table 49 Middle East and Africa Public Affairs and Advocacy Platform Revenue (USD Million) By Region (2023-2030)
Table 50 Middle East and Africa Public Affairs and Advocacy Platform Revenue (USD Million) By Region (2023-2030)
Table 51 Middle East and Africa Public Affairs and Advocacy Platform Revenue (USD Million) By Type (2023-2030)
Table 52 Middle East and Africa Public Affairs and Advocacy Platform Revenue (USD Million) By Applications (2023-2030)
Table 53 Research Programs/Design for This Report
Table 54 Key Data Information from Secondary Sources
Table 55 Key Data Information from Primary Sources
List of Figures
Figure 1 Market Scope
Figure 2 Porter’s Five Forces
Figure 3 Global Public Affairs and Advocacy Platform Revenue (USD Million) By Type (2018-2022)
Figure 4 Global Public Affairs and Advocacy Platform Revenue Market Share (%) By Type (2022)
Figure 5 Global Public Affairs and Advocacy Platform Revenue (USD Million) By Applications (2018-2022)
Figure 6 Global Public Affairs and Advocacy Platform Revenue Market Share (%) By Applications (2022)
Figure 7 Global Public Affairs and Advocacy Platform Market Revenue (USD Million) By Regions (2018-2022)
Figure 8 Global Public Affairs and Advocacy Platform Market Share (%) By Regions (2022)
Figure 9 North America Public Affairs and Advocacy Platform Revenue (USD Million) By Country (2018-2022)
Figure 10 North America Public Affairs and Advocacy Platform Revenue (USD Million) By Type (2018-2022)
Figure 11 North America Public Affairs and Advocacy Platform Revenue (USD Million) By Applications (2018-2022)
Figure 12 Europe Public Affairs and Advocacy Platform Revenue (USD Million) By Country (2018-2022)
Figure 13 Europe Public Affairs and Advocacy Platform Revenue (USD Million) By Type (2018-2022)
Figure 14 Europe Public Affairs and Advocacy Platform Revenue (USD Million) By Applications (2018-2022)
Figure 15 Asia Pacific Public Affairs and Advocacy Platform Revenue (USD Million) By Country (2018-2022)
Figure 16 Asia Pacific Public Affairs and Advocacy Platform Revenue (USD Million) By Type (2018-2022)
Figure 17 Asia Pacific Public Affairs and Advocacy Platform Revenue (USD Million) By Applications (2018-2022)
Figure 18 South America Public Affairs and Advocacy Platform Revenue (USD Million) By Country (2018-2022)
Figure 19 South America Public Affairs and Advocacy Platform Revenue (USD Million) By Type (2018-2022)
Figure 20 South America Public Affairs and Advocacy Platform Revenue (USD Million) By Applications (2018-2022)
Figure 21 Middle East and Africa Public Affairs and Advocacy Platform Revenue (USD Million) By Region (2018-2022)
Figure 22 Middle East and Africa Public Affairs and Advocacy Platform Revenue (USD Million) By Type (2018-2022)
Figure 23 Middle East and Africa Public Affairs and Advocacy Platform Revenue (USD Million) By Applications (2018-2022)
Figure 24 Global Public Affairs and Advocacy Platform Revenue (USD Million) By Type (2023-2030)
Figure 25 Global Public Affairs and Advocacy Platform Revenue Market Share (%) By Type (2030)
Figure 26 Global Public Affairs and Advocacy Platform Revenue (USD Million) By Applications (2023-2030)
Figure 27 Global Public Affairs and Advocacy Platform Revenue Market Share (%) By Applications (2030)
Figure 28 Global Public Affairs and Advocacy Platform Market Revenue (USD Million) By Regions (2023-2030)
Figure 29 North America Public Affairs and Advocacy Platform Revenue (USD Million) By Country (2023-2030)
Figure 30 North America Public Affairs and Advocacy Platform Revenue (USD Million) By Type (2023-2030)
Figure 31 North America Public Affairs and Advocacy Platform Revenue (USD Million) By Applications (2023-2030)
Figure 32 Europe Public Affairs and Advocacy Platform Revenue (USD Million) By Country (2023-2030)
Figure 33 Europe Public Affairs and Advocacy Platform Revenue (USD Million) By Type (2023-2030)
Figure 34 Europe Public Affairs and Advocacy Platform Revenue (USD Million) By Applications (2023-2030)
Figure 35 Asia Pacific Public Affairs and Advocacy Platform Revenue (USD Million) By Country (2023-2030)
Figure 36 Asia Pacific Public Affairs and Advocacy Platform Revenue (USD Million) By Type (2023-2030)
Figure 37 Asia Pacific Public Affairs and Advocacy Platform Revenue (USD Million) By Applications (2023-2030)
Figure 38 South America Public Affairs and Advocacy Platform Revenue (USD Million) By Country (2023-2030)
Figure 39 South America Public Affairs and Advocacy Platform Revenue (USD Million) By Type (2023-2030)
Figure 40 South America Public Affairs and Advocacy Platform Revenue (USD Million) By Applications (2023-2030)
Figure 41 Middle East and Africa Public Affairs and Advocacy Platform Revenue (USD Million) By Region (2023-2030)
Figure 42 Middle East and Africa Public Affairs and Advocacy Platform Revenue (USD Million) By Region (2023-2030)
Figure 43 Middle East and Africa Public Affairs and Advocacy Platform Revenue (USD Million) By Type (2023-2030)
Figure 44 Middle East and Africa Public Affairs and Advocacy Platform Revenue (USD Million) By Applications (2023-2030)
Figure 45 Bottom-Up and Top-Down Approaches For This Report
Figure 46 Data Triangulation
