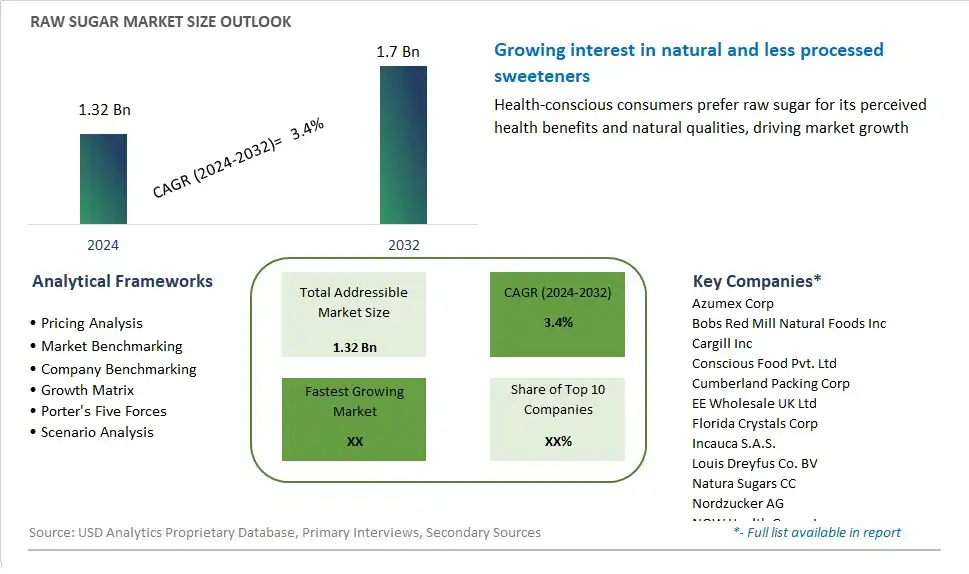
Global Raw Sugar Market Size is valued at $1.32 Billion in 2024 and is forecast to register a growth rate (CAGR) of 3.4% to reach $1.7 Billion by 2032.
The global Raw Sugar Market Comprehensive Study analyzes and forecasts the market size across 6 regions and 24 countries for diverse segments -By Product (Liquid sugar, Crystallized sugar), By Type (Conventional, Organic)
An Introduction to Raw Sugar Market
In 2025, the raw sugar market is expanding as global demand for natural sweeteners continues to rise. Raw sugar, less processed than white sugar, retains more of the cane’s natural molasses, making it a preferred choice for health-conscious consumers and food manufacturers seeking less refined ingredients. The market is influenced by fluctuating sugar prices, changes in agricultural policies, and advancements in sugarcane cultivation and processing techniques. Major producers like Brazil, India, and Thailand are adapting to market demands by enhancing production efficiency and sustainability practices. Additionally, the growing popularity of raw sugar in baking, confectionery, and beverages is further driving market growth.
Raw Sugar Competitive Landscape
The market report analyses the leading companies in the industry including Azumex Corp, Bobs Red Mill Natural Foods Inc, Cargill Inc, Conscious Food Pvt. Ltd, Cumberland Packing Corp, EE Wholesale UK Ltd, Florida Crystals Corp, Incauca S.A.S., Louis Dreyfus Co. BV, Natura Sugars CC, Nordzucker AG, NOW Health Group Inc, SUGART, Sunbest Natural, and Others.
Raw Sugar Market Dynamics
Raw Sugar Market Trend: Shift Towards Natural and Unrefined Sweeteners
A significant market trend in the raw sugar industry is the increasing consumer preference for natural and unrefined sweeteners. As health-consciousness rises, consumers are seeking alternatives to refined white sugar, which is often perceived as less healthy due to its processing methods and added chemicals. Raw sugar, with its minimal processing and higher nutrient content compared to refined sugar, is gaining popularity as a more natural and wholesome sweetening option. This trend is driven by a growing awareness of the health risks associated with excessive sugar consumption and a desire for more natural and minimally processed food ingredients.
Market Driver: Growing Demand for Clean Label Products
The growing demand for clean label products serves as a significant market driver for raw sugar. Consumers are increasingly scrutinizing product labels and seeking transparency regarding the ingredients used in their food and beverages. Raw sugar, with its simple and recognizable composition, aligns well with the clean label movement, as it is perceived as a more wholesome and less processed sweetening option compared to refined sugars. Manufacturers are responding to this demand by incorporating raw sugar into a wide range of food and beverage products, including snacks, baked goods, and beverages, to meet consumer preferences for clean, natural, and minimally processed ingredients.
Market Opportunity: Expansion into Organic and Fair Trade Segments
One potential opportunity for the raw sugar market lies in expanding into organic and fair trade segments. With an increasing emphasis on ethical and sustainable sourcing practices, there is a growing demand for organic and fair trade certified sugar among consumers who prioritize environmental stewardship and social responsibility. By investing in organic farming practices and establishing fair trade partnerships with sugar producers, companies can differentiate their raw sugar products in the market and appeal to conscientious consumers seeking products that align with their values. Additionally, certification as organic and fair trade can open doors to niche markets and premium price points, creating opportunities for value-added positioning and enhanced market penetration. Market Trend: Convenience and On-the-Go Lifestyles Driving Ready-to-Drink MarketThe ready-to-drink (RTD) market is experiencing a significant trend fueled by the increasing prevalence of convenience and on-the-go lifestyles among consumers. With busy schedules and limited time for meal preparation, consumers are seeking convenient beverage options that offer both nutrition and portability. Ready-to-drink beverages, including iced coffees, teas, energy drinks, and protein shakes, cater to this demand by providing ready-made solutions that can be conveniently consumed anytime, anywhere. This trend is further accentuated by the rise of urbanization, longer work hours, and a growing emphasis on convenience-oriented products across various consumer segments.
Market Driver: Demand for Healthier and Functional Beverage Choices
The demand for healthier and functional beverage choices is driving growth in the ready-to-drink market. As consumers become increasingly health-conscious and proactive about their well-being, there is a growing preference for beverages that offer nutritional benefits and functional ingredients. Ready-to-drink beverages that incorporate natural ingredients, vitamins, minerals, and functional additives such as probiotics, antioxidants, and adaptogens are gaining traction among health-conscious consumers seeking convenient ways to support their active lifestyles. This driver is reinforced by the growing popularity of wellness trends such as clean eating, plant-based diets, and mindful consumption, which influence beverage choices and drive innovation in the RTD segment.
Market Opportunity: Innovation in Sustainable Packaging and Eco-Friendly Solutions
One potential opportunity for the ready-to-drink market lies in innovation in sustainable packaging and eco-friendly solutions. As environmental concerns become increasingly prominent, consumers are seeking sustainable alternatives to traditional single-use packaging, such as plastic bottles and aluminum cans. Ready-to-drink brands can capitalize on this opportunity by exploring innovative packaging materials, such as biodegradable plastics, compostable packaging, and reusable containers, to reduce their environmental footprint and appeal to eco-conscious consumers. Additionally, investing in initiatives such as refill stations, package-free options, and carbon-neutral distribution channels can further enhance the sustainability credentials of ready-to-drink products, positioning brands as leaders in environmental stewardship while attracting a growing segment of environmentally aware consumers.
Raw Sugar Market Share Analysis: Crystallized Sugar held the dominant market share in 2024
In the Raw Sugar market segmented by product, Crystallized Sugar is the largest segment, owing to its widespread use, versatility, and long-standing popularity in various industries. Crystallized sugar, also known as granulated sugar, is produced through the crystallization of sucrose from sugarcane or sugar beet juice. It is a fundamental ingredient in numerous food and beverage products, including baked goods, confectionery, beverages, sauces, and preserves, due to its ability to add sweetness, texture, and preservation properties. Further, crystallized sugar has a longer shelf life compared to liquid sugar varieties, making it suitable for bulk storage and transportation. Additionally, crystallized sugar is preferred by consumers for its ease of use in measuring and handling, making it a staple pantry item in households and commercial kitchens alike. Furthermore, the versatility and familiarity of crystallized sugar in culinary applications contribute to its dominance as the largest segment in the Raw Sugar market. Overall, the widespread usage, convenience, and versatility of crystallized sugar make it the preferred choice for consumers and industries, reinforcing its position as the largest segment in the market.
Raw Sugar Market Share Analysis: Organic market is poised to register the fastest growth rae over the forecast period to 2032
In the Raw Sugar market segmented by type, the Organic segment is the fastest-growing, driven by increasing consumer demand for natural, sustainable, and environmentally friendly food products. Organic raw sugar is produced without the use of synthetic pesticides, fertilizers, or genetically modified organisms (GMOs), adhering to strict organic farming standards and practices. This segment appeals to health-conscious consumers seeking products free from chemical residues and synthetic additives. Further, organic raw sugar is perceived to have superior taste and quality, as it is often produced from premium-quality sugarcane or sugar beet crops cultivated in nutrient-rich soils using traditional farming methods. Additionally, the growing awareness of environmental sustainability and ethical sourcing practices in agriculture further drives the demand for organic raw sugar. Furthermore, the expansion of organic certification programs and the availability of organic raw sugar in mainstream retail channels contribute to its rapid growth in the market. Overall, the combination of consumer preferences for natural, sustainable products and the increasing availability of organic raw sugar options positions the Organic segment as the fastest-growing in the Raw Sugar market.
Raw Sugar Market Segmentation
By Product
Liquid sugar
Crystallized sugar
By Type
Conventional
Organic
Countries Analyzed
North America (US, Canada, Mexico)
Europe (Germany, UK, France, Spain, Italy, Russia, Rest of Europe)
Asia Pacific (China, India, Japan, South Korea, Australia, South East Asia, Rest of Asia)
South America (Brazil, Argentina, Rest of South America)
Middle East and Africa (Saudi Arabia, UAE, Rest of Middle East, South Africa, Egypt, Rest of Africa)
Raw Sugar Companies Profiled in the Study
Azumex Corp
Bobs Red Mill Natural Foods Inc
Cargill Inc
Conscious Food Pvt. Ltd
Cumberland Packing Corp
EE Wholesale UK Ltd
Florida Crystals Corp
Incauca S.A.S.
Louis Dreyfus Co. BV
Natura Sugars CC
Nordzucker AG
NOW Health Group Inc
SUGART
Sunbest Natural
*- List Not Exhaustive
Chapter 1. TABLE OF CONTENTS
Chapter 2. Introduction to Raw Sugar Market
2.1. Market Overview
2.2. Key Statistics and Report Highlights
2.3. Scope of the Comprehensive Study
2.3.1. Market Definition
2.3.2 Countries and Regions Covered
2.3.3 Research Objective
2.3.4 Units, Currency, and Conversions
2.3.5 Industry Value Chain
2.4. Key Market Segments
2.5. Key Companies
2.6. Study Period
Chapter 3. Strategic Analysis Review
3.1. Raw Sugar Pricing Analysis and Forecast
3.2. Porter’s Five Forces
3.3. Market Ecosystem
3.4. SWOT Analysis
3.5. Regulatory Scenario
3.3. Effects of Inflation, Russia-Ukraine War, moderating economic growth, and other macroeconomic factors
Chapter 4. Competitive Landscape
4.1. Market Share Analysis
4.1.1. Global Raw Sugar Market Share by Company, 2023
4.1.2. Product Offerings of Leading Raw Sugar Companies
4.2. Market Entropy
4.2.1. New Product Launches in the Industry
4.2.2. Mergers, Acquisitions, Joint ventures, and Partnerships
4.3. Key Strategies and Best Practices
Chapter 5. Global Market Projections: Best, Reference, and Low Case Scenarios
5.1. Growth Analysis- Case Scenario Definitions
5.2. Low Growth Case Scenario Forecasts
5.3. Reference Growth Case Scenario Forecasts
5.4. High Growth Case Scenario Forecasts
Chapter 6. Market Dynamics
6.1. Raw Sugar Market Drivers
6.2. Raw Sugar Market Challenges
6.6. Raw Sugar Market Opportunities
6.4. Raw Sugar Market Trends
Chapter 7. Global Raw Sugar Market Outlook Trends
7.1. Global Raw Sugar Revenue (USD Million) and CAGR (%) by Type (2021-2032)
7.2. Global Raw Sugar Revenue (USD Million) and CAGR (%) by Application (2021-2032)
7.3. Global Raw Sugar Revenue (USD Million) and CAGR (%) by Product (2021-2032)
By Product
Liquid sugar
Crystallized sugar
By Type
Conventional
Organic
Chapter 8. Global Raw Sugar Regional Analysis and Outlook
8.1. Global Raw Sugar Revenue (USD Million) By Regions (2021- 2032)
8.2. North America Raw Sugar Revenue (USD Million) by Country (2021-2032)
8.2.1. United States Raw Sugar Regional Analysis and Outlook
8.2.2. Canada Raw Sugar Regional Analysis and Outlook
8.2.3. Mexico Raw Sugar Regional Analysis and Outlook
8.3. Europe Raw Sugar Revenue (USD Million), by Country (2021-2032)
8.3.1. Germany Raw Sugar Regional Analysis and Outlook
8.3.2. France Raw Sugar Regional Analysis and Outlook
8.3.3. United Kingdom Raw Sugar Regional Analysis and Outlook
8.3.4. Spain Raw Sugar Regional Analysis and Outlook
8.3.5. Italy Raw Sugar Regional Analysis and Outlook
8.3.6. Russia Raw Sugar Regional Analysis and Outlook
8.3.7. Rest of Europe Raw Sugar Regional Analysis and Outlook
8.4. Asia Pacific Raw Sugar Revenue (USD Million) by Country (2021-2032)
8.4.1. China Raw Sugar Regional Analysis and Outlook
8.4.2. Japan Raw Sugar Regional Analysis and Outlook
8.4.3. India Raw Sugar Regional Analysis and Outlook
8.4.4. South Korea Raw Sugar Regional Analysis and Outlook
8.4.5. Australia Raw Sugar Regional Analysis and Outlook
8.4.6. South East Asia Raw Sugar Regional Analysis and Outlook
8.4.7. Rest of Asia Pacific Raw Sugar Regional Analysis and Outlook
8.5. South America Raw Sugar Revenue (USD Million), by Country (2021-2032)
8.5.1. Brazil Raw Sugar Regional Analysis and Outlook
8.5.2. Argentina Raw Sugar Regional Analysis and Outlook
8.5.3. Rest of South America Raw Sugar Regional Analysis and Outlook
8.6. Middle East and Africa Raw Sugar Revenue (USD Million) by Country (2021-2032)
8.6.1. Middle East Raw Sugar Regional Analysis and Outlook
8.6.2. Africa Raw Sugar Regional Analysis and Outlook
Chapter 9. North America Raw Sugar Analysis and Outlook
9.1. North America Raw Sugar Revenue (USD Million) by Segments (2021-2032)
9.1.1. North America Raw Sugar Revenue (USD Million) by Type (2021-2032)
9.1.2. North America Raw Sugar Revenue (USD Million) by Application (2021-2032)
9.1.3. North America Raw Sugar Revenue (USD Million) by Product (2021-2032)
By Product
Liquid sugar
Crystallized sugar
By Type
Conventional
Organic
Chapter 10. Europe Raw Sugar Analysis and Outlook
10.1. Europe Raw Sugar Revenue (USD Million), by Segments (USD Million) (2021-2032)
10.1.1. Europe Raw Sugar Revenue (USD Million) by Type (2021-2032)
10.1.2. Europe Raw Sugar Revenue (USD Million) by Application (2021-2032)
10.1.3. Europe Raw Sugar Revenue (USD Million) by Product (2021-2032)
By Product
Liquid sugar
Crystallized sugar
By Type
Conventional
Organic
Chapter 11. Asia Pacific Raw Sugar Analysis and Outlook
11.1. Asia Pacific Raw Sugar Revenue (USD Million), and Revenue (USD Million) by Segments (2021-2032)
11.1.1. Asia Pacific Raw Sugar Revenue (USD Million) by Type (2021-2032)
11.1.2. Asia Pacific Raw Sugar Revenue (USD Million) by Application (2021-2032)
11.1.3. Asia Pacific Raw Sugar Revenue (USD Million) by Product (2021-2032)
By Product
Liquid sugar
Crystallized sugar
By Type
Conventional
Organic
Chapter 12. South America Raw Sugar Analysis and Outlook
12.1. South America Raw Sugar Revenue (USD Million), by Segments (2021-2032)
12.1.1. South America Raw Sugar Revenue (USD Million) by Type (2021-2032)
12.1.2. South America Raw Sugar Revenue (USD Million) by Application (2021-2032)
12.1.3. South America Raw Sugar Revenue (USD Million) by Product (2021-2032)
By Product
Liquid sugar
Crystallized sugar
By Type
Conventional
Organic
Chapter 13. Middle East and Africa Raw Sugar Analysis and Outlook
13.1. Middle East and Africa Raw Sugar Revenue (USD Million), by Segments (2021-2032)
13.1.1. Middle East and Africa Raw Sugar Revenue (USD Million) by Type (2021-2032)
13.1.2. Middle East and Africa Raw Sugar Revenue (USD Million) by Application (2021-2032)
13.1.3. Middle East and Africa Raw Sugar Revenue (USD Million) by Product (2021-2032)
By Product
Liquid sugar
Crystallized sugar
By Type
Conventional
Organic
Chapter 14. Raw Sugar Company Profiles
14.1 Business Overview
14.2 Product Profiles
14.3 SWOT Profiles
14.5 Recent Developments
14.6 Financial Profile
List of Companies
Azumex Corp
Bobs Red Mill Natural Foods Inc
Cargill Inc
Conscious Food Pvt. Ltd
Cumberland Packing Corp
EE Wholesale UK Ltd
Florida Crystals Corp
Incauca S.A.S.
Louis Dreyfus Co. BV
Natura Sugars CC
Nordzucker AG
NOW Health Group Inc
SUGART
Sunbest Natural
15. Methodology and Data Sources
15.1 Customization Offerings
15.2 Subscription Services
15.3 Related Reports
15.4 Publisher Expertise
LIST OF TABLES
Table 1 Market Segmentation Analysis
Table 2 Global Raw Sugar Market Share of Leading Companies, 2023
Table 3 Product Offerings of Leading Companies
Table 4 Low Growth Scenario Forecasts
Table 5 Reference Case Growth Scenario
Table 6 High Growth Case Scenario
Table 7 Global Raw Sugar Revenue (USD Million) And CAGR (%) By Type (2021-2032)
Table 8 Global Raw Sugar Revenue (USD Million) And CAGR (%) By Application (2021-2032)
Table 9 Global Raw Sugar Revenue (USD Million) And CAGR (%) By Product (2021-2032)
Table 10 Global Raw Sugar Market Revenue (USD Million) By Regions (2021-2032)
Table 11 Global Raw Sugar Market Share (%) By Regions (2021-2032)
Table 12 North America Raw Sugar Revenue (USD Million) By Country (2021-2032)
Table 13 Europe Raw Sugar Revenue (USD Million) By Country (2021-2032)
Table 14 Asia Pacific Raw Sugar Revenue (USD Million) By Country (2021-2032)
Table 15 South America Raw Sugar Revenue (USD Million) By Country (2021-2032)
Table 16 Middle East and Africa Raw Sugar Revenue (USD Million) By Region (2021-2032)
Table 17 North America Raw Sugar Revenue (USD Million) By Type (2021-2032)
Table 18 North America Raw Sugar Revenue (USD Million) By Application (2021-2032)
Table 19 North America Raw Sugar Revenue (USD Million) By Product (2021-2032)
Table 20 Europe Raw Sugar Revenue (USD Million) By Type (2021-2032)
Table 21 Europe Raw Sugar Revenue (USD Million) By Application (2021-2032)
Table 22 Europe Raw Sugar Revenue (USD Million) By Product (2021-2032)
Table 23 Asia Pacific Raw Sugar Revenue (USD Million) By Type (2021-2032)
Table 24 Asia Pacific Raw Sugar Revenue (USD Million) By Application (2021-2032)
Table 25 Asia Pacific Raw Sugar Revenue (USD Million) By Product (2021-2032)
Table 26 South America Raw Sugar Revenue (USD Million) By Type (2021-2032)
Table 27 South America Raw Sugar Revenue (USD Million) By Application (2021-2032)
Table 28 South America Raw Sugar Revenue (USD Million) By Product (2021-2032)
Table 29 Middle East and Africa Raw Sugar Revenue (USD Million) By Type (2021-2032)
Table 30 Middle East and Africa Raw Sugar Revenue (USD Million) By Application (2021-2032)
Table 31 Middle East and Africa Raw Sugar Revenue (USD Million) By Product (2021-2032)
LIST OF FIGURES
Figure 1. Market Scope
Figure 2. Pricing Forecasts Per Unit, 2023- 2032
Figure 3. Porter’s Five Forces
Figure 4. Global Raw Sugar Market Revenue (USD Million) By Regions (2021-2032)
Figure 5. Global Raw Sugar Market Share (%) By Regions (2023)
Figure 6. North America Raw Sugar Revenue (USD Million) By Country (2021-2032)
Figure 7. United States Raw Sugar Revenue (USD Million) By Country (2021-2032)
Figure 8. Canada Raw Sugar Revenue (USD Million) By Country (2021-2032)
Figure 9. Mexico Raw Sugar Revenue (USD Million) By Country (2021-2032)
Figure 10. Europe Raw Sugar Revenue (USD Million) By Country (2021-2032)
Figure 11. Germany Raw Sugar Revenue (USD Million) By Country (2021-2032)
Figure 12. France Raw Sugar Revenue (USD Million) By Country (2021-2032)
Figure 13. United Kingdom Raw Sugar Revenue (USD Million) By Country (2021-2032)
Figure 14. Spain Raw Sugar Revenue (USD Million) By Country (2021-2032)
Figure 15. Italy Raw Sugar Revenue (USD Million) By Country (2021-2032)
Figure 16. Russia Raw Sugar Revenue (USD Million) By Country (2021-2032)
Figure 17. Rest of Europe Raw Sugar Revenue (USD Million) By Country (2021-2032)
Figure 11. Asia Pacific Raw Sugar Revenue (USD Million) By Country (2021-2032)
Figure 12. China Raw Sugar Revenue (USD Million) By Country (2021-2032)
Figure 13. Japan Raw Sugar Revenue (USD Million) By Country (2021-2032)
Figure 14. India Raw Sugar Revenue (USD Million) By Country (2021-2032)
Figure 15. South Korea Raw Sugar Revenue (USD Million) By Country (2021-2032)
Figure 16. Australia Raw Sugar Revenue (USD Million) By Country (2021-2032)
Figure 17. South East Asia Raw Sugar Revenue (USD Million) By Country (2021-2032)
Figure 18. South America Raw Sugar Revenue (USD Million) By Country (2021-2032)
Figure 19. Brazil Raw Sugar Revenue (USD Million) By Country (2021-2032)
Figure 20. Argentina Raw Sugar Revenue (USD Million) By Country (2021-2032)
Figure 21. Rest of Asia Pacific Raw Sugar Revenue (USD Million) By Country (2021-2032)
Figure 22. Middle East and Africa Raw Sugar Revenue (USD Million) By Region (2021-2032)
Figure 23. Saudi Arabia Raw Sugar Revenue (USD Million) By Region (2021-2032)
Figure 24. The UAE Raw Sugar Revenue (USD Million) By Region (2021-2032)
Figure 25. Rest of Middle East Raw Sugar Revenue (USD Million) By Region (2021-2032)
Figure 26. South Africa Raw Sugar Revenue (USD Million) By Region (2021-2032)
Figure 27. Africa Raw Sugar Revenue (USD Million) By Region (2021-2032)
Figure 28. North America Raw Sugar Revenue (USD Million) By Type (2021-2032)
Figure 29. North America Raw Sugar Revenue (USD Million) By Application (2021-2032)
Figure 30. North America Raw Sugar Revenue (USD Million) By Product (2021-2032)
Figure 31. Europe Raw Sugar Revenue (USD Million) By Type (2021-2032)
Figure 32. Europe Raw Sugar Revenue (USD Million) By Application (2021-2032)
Figure 33. Europe Raw Sugar Revenue (USD Million) By Product (2021-2032)
Figure 34. Asia Pacific Raw Sugar Revenue (USD Million) By Type (2021-2032)
Figure 35. Asia Pacific Raw Sugar Revenue (USD Million) By Application (2021-2032)
Figure 36. Asia Pacific Raw Sugar Revenue (USD Million) By Product (2021-2032)
Figure 37. South America Raw Sugar Revenue (USD Million) By Type (2021-2032)
Figure 38. South America Raw Sugar Revenue (USD Million) By Application (2021-2032)
Figure 39. South America Raw Sugar Revenue (USD Million) By Product (2021-2032)
Figure 40. Middle East and Africa Raw Sugar Revenue (USD Million) By Type (2021-2032)
Figure 41. Middle East and Africa Raw Sugar Revenue (USD Million) By Application (2021-2032)
Figure 42. Middle East and Africa Raw Sugar Revenue (USD Million) By Product (2021-2032)
By Product
Liquid sugar
Crystallized sugar
By Type
Conventional
Organic
Countries Analyzed
North America (US, Canada, Mexico)
Europe (Germany, UK, France, Spain, Italy, Russia, Rest of Europe)
Asia Pacific (China, India, Japan, South Korea, Australia, South East Asia, Rest of Asia)
South America (Brazil, Argentina, Rest of South America)
Middle East and Africa (Saudi Arabia, UAE, Rest of Middle East, South Africa, Egypt, Rest of Africa)
