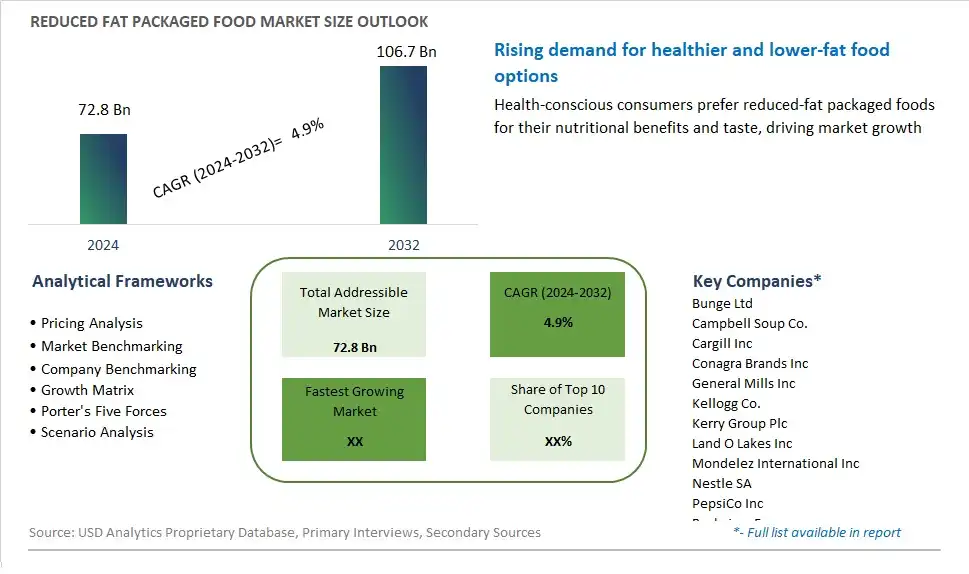
Global Reduced Fat Packaged Food Market Size is valued at $72.8 Billion in 2024 and is forecast to register a growth rate (CAGR) of 4.9% to reach $106.7 Billion by 2032.
The global Reduced Fat Packaged Food Market Comprehensive Study analyzes and forecasts the market size across 6 regions and 24 countries for diverse segments -By Application (Bakery, Dairy, Cereals, Meat products, Others), By Distribution Channel (Supermarkets/Hypermarkets, Convenience stores, Specialty stores, Online)
An Introduction to Reduced Fat Packaged Food Market
In 2024, the reduced fat packaged food market is thriving as consumers increasingly seek healthier dietary options without compromising on taste and convenience. Reduced fat products, including snacks, dairy, and ready meals, cater to the growing demand for lower-calorie and heart-healthy foods. Advances in food technology and ingredient innovation are enabling manufacturers to create tasty, lower-fat alternatives that meet consumer expectations. The market is also driven by rising awareness of diet-related health issues such as obesity and cardiovascular diseases. Furthermore, regulatory initiatives and labeling requirements are encouraging the development and marketing of reduced fat packaged foods, making them more accessible to health-conscious consumers.
Reduced Fat Packaged Food Competitive Landscape
The market report analyses the leading companies in the industry including Bunge Ltd, Campbell Soup Co., Cargill Inc, Conagra Brands Inc, General Mills Inc, Kellogg Co., Kerry Group Plc, Land O Lakes Inc, Mondelez International Inc, Nestle SA, PepsiCo Inc, Rockview Farms, Tesco Plc, The Hain Celestial Group Inc, The Hershey Co., The Kraft Heinz Co., Tyson Foods Inc, and Others.
Reduced Fat Packaged Food Market Dynamics
Reduced Fat Packaged Food Market Trend: Shift Towards Healthier Eating Habits and Weight Management
A prominent market trend in reduced-fat packaged food is the increasing consumer focus on healthier eating habits and weight management. With rising concerns about obesity and chronic diseases, consumers are becoming more mindful of their dietary choices and seeking products that align with their health goals. Reduced-fat packaged food offers a convenient and accessible option for individuals looking to reduce their fat intake without sacrificing taste or convenience. This trend is driven by a growing awareness of the health risks associated with high-fat diets and a desire for products that support a balanced and nutritious lifestyle.
Market Driver: Demand for Healthier Alternatives and Nutritional Transparency
The market driver for reduced-fat packaged food is the demand for healthier alternatives and nutritional transparency among consumers. As dietary preferences evolve and nutritional awareness increases, there is a growing demand for packaged food products that offer lower fat content without compromising on taste or quality. Consumers are seeking products with transparent labeling and recognizable ingredients, allowing them to make informed choices about their food purchases. Reduced-fat packaged food brands are responding to this demand by reformulating their products to reduce fat content, using healthier cooking methods, and incorporating natural ingredients to enhance nutritional value and appeal to health-conscious consumers.
Market Opportunity: Innovation in Flavor Enhancement and Texture Optimization
One potential opportunity for the reduced-fat packaged food market lies in innovation in flavor enhancement and texture optimization. While reducing fat content is essential for meeting health and dietary preferences, maintaining taste and texture is critical for consumer acceptance and satisfaction. Brands can capitalize on this opportunity by investing in research and development to develop innovative techniques and ingredients that enhance the flavor profile and mouthfeel of reduced-fat products. This may include using herbs, spices, umami-rich ingredients, and natural flavor enhancers to add depth and complexity to reduced-fat recipes, as well as exploring alternative cooking methods and food processing techniques to preserve texture and consistency. By focusing on flavor innovation and texture optimization, brands can overcome taste barriers associated with reduced-fat products and create offerings that appeal to a broader consumer base.
Reduced Fat Packaged Food Market Share Analysis: Dairy held the dominant market share in 2024
In the Reduced Fat Packaged Food market segmented by application, the Dairy segment is the largest, propelled by its widespread usage, versatility, and consumer demand for healthier alternatives. Reduced-fat dairy products, including milk, yogurt, cheese, and spreads, are widely consumed by individuals seeking to reduce their overall fat intake while still enjoying the nutritional benefits of dairy. These products are favored for their familiar taste and texture, making them suitable substitutes for their full-fat counterparts in various culinary applications. Further, the dairy industry has responded to consumer preferences by offering an extensive range of reduced-fat options, catering to different dietary needs and preferences. Additionally, reduced-fat dairy products are often perceived as healthier choices due to their lower fat content, making them popular among health-conscious consumers aiming to maintain a balanced diet. Furthermore, the dairy segment's dominance is reinforced by its consistent presence in supermarkets, grocery stores, and online retail platforms, ensuring accessibility to consumers across different demographics and lifestyles. Overall, the widespread usage, versatility, and perceived health benefits of reduced-fat dairy products position the Dairy segment as the largest in the Reduced Fat Packaged Food market.
Reduced Fat Packaged Food Market Share Analysis: Online market is poised to register the fastest growth rae over the forecast period to 2032
In the Reduced Fat Packaged Food market segmented by distribution channel, the Online segment is the fastest-growing, driven by the increasing popularity of e-commerce platforms, shifting consumer shopping habits, and convenience factors. Online retail offers consumers a convenient and hassle-free shopping experience, allowing them to browse and purchase reduced-fat packaged food products from the comfort of their homes. This segment's growth is further propelled by the COVID-19 pandemic, which accelerated the adoption of online shopping due to safety concerns and restrictions on in-person shopping. Further, online platforms provide a wide selection of reduced-fat packaged food options, often with competitive pricing and promotional offers, attracting budget-conscious and health-conscious consumers alike. Additionally, the convenience of doorstep delivery and the availability of subscription services enhance the appeal of online shopping for reduced-fat packaged foods. Furthermore, the growing digitalization of retail and the expansion of online grocery platforms contribute to the rapid growth of the Online segment in the Reduced Fat Packaged Food market. Overall, the combination of convenience, safety, and accessibility positions the Online segment as the fastest-growing distribution channel in the market.
Reduced Fat Packaged Food Market Segmentation
By Application
Bakery
Dairy
Cereals
Meat products
Others
By Distribution Channel
Supermarkets/Hypermarkets
Convenience stores
Specialty stores
Online
Countries Analyzed
North America (US, Canada, Mexico)
Europe (Germany, UK, France, Spain, Italy, Russia, Rest of Europe)
Asia Pacific (China, India, Japan, South Korea, Australia, South East Asia, Rest of Asia)
South America (Brazil, Argentina, Rest of South America)
Middle East and Africa (Saudi Arabia, UAE, Rest of Middle East, South Africa, Egypt, Rest of Africa)
Reduced Fat Packaged Food Companies Profiled in the Study
Bunge Ltd
Campbell Soup Co.
Cargill Inc
Conagra Brands Inc
General Mills Inc
Kellogg Co.
Kerry Group Plc
Land O Lakes Inc
Mondelez International Inc
Nestle SA
PepsiCo Inc
Rockview Farms
Tesco Plc
The Hain Celestial Group Inc
The Hershey Co.
The Kraft Heinz Co.
Tyson Foods Inc
*- List Not Exhaustive
Chapter 1. TABLE OF CONTENTS
Chapter 2. Introduction to Reduced Fat Packaged Food Market
2.1. Market Overview
2.2. Key Statistics and Report Highlights
2.3. Scope of the Comprehensive Study
2.3.1. Market Definition
2.3.2 Countries and Regions Covered
2.3.3 Research Objective
2.3.4 Units, Currency, and Conversions
2.3.5 Industry Value Chain
2.4. Key Market Segments
2.5. Key Companies
2.6. Study Period
Chapter 3. Strategic Analysis Review
3.1. Reduced Fat Packaged Food Pricing Analysis and Forecast
3.2. Porter’s Five Forces
3.3. Market Ecosystem
3.4. SWOT Analysis
3.5. Regulatory Scenario
3.3. Effects of Inflation, Russia-Ukraine War, moderating economic growth, and other macroeconomic factors
Chapter 4. Competitive Landscape
4.1. Market Share Analysis
4.1.1. Global Reduced Fat Packaged Food Market Share by Company, 2023
4.1.2. Product Offerings of Leading Reduced Fat Packaged Food Companies
4.2. Market Entropy
4.2.1. New Product Launches in the Industry
4.2.2. Mergers, Acquisitions, Joint ventures, and Partnerships
4.3. Key Strategies and Best Practices
Chapter 5. Global Market Projections: Best, Reference, and Low Case Scenarios
5.1. Growth Analysis- Case Scenario Definitions
5.2. Low Growth Case Scenario Forecasts
5.3. Reference Growth Case Scenario Forecasts
5.4. High Growth Case Scenario Forecasts
Chapter 6. Market Dynamics
6.1. Reduced Fat Packaged Food Market Drivers
6.2. Reduced Fat Packaged Food Market Challenges
6.6. Reduced Fat Packaged Food Market Opportunities
6.4. Reduced Fat Packaged Food Market Trends
Chapter 7. Global Reduced Fat Packaged Food Market Outlook Trends
7.1. Global Reduced Fat Packaged Food Revenue (USD Million) and CAGR (%) by Type (2021-2032)
7.2. Global Reduced Fat Packaged Food Revenue (USD Million) and CAGR (%) by Application (2021-2032)
7.3. Global Reduced Fat Packaged Food Revenue (USD Million) and CAGR (%) by Product (2021-2032)
By Application
Bakery
Dairy
Cereals
Meat products
Others
By Distribution Channel
Supermarkets/Hypermarkets
Convenience stores
Specialty stores
Online
Chapter 8. Global Reduced Fat Packaged Food Regional Analysis and Outlook
8.1. Global Reduced Fat Packaged Food Revenue (USD Million) By Regions (2021- 2032)
8.2. North America Reduced Fat Packaged Food Revenue (USD Million) by Country (2021-2032)
8.2.1. United States Reduced Fat Packaged Food Regional Analysis and Outlook
8.2.2. Canada Reduced Fat Packaged Food Regional Analysis and Outlook
8.2.3. Mexico Reduced Fat Packaged Food Regional Analysis and Outlook
8.3. Europe Reduced Fat Packaged Food Revenue (USD Million), by Country (2021-2032)
8.3.1. Germany Reduced Fat Packaged Food Regional Analysis and Outlook
8.3.2. France Reduced Fat Packaged Food Regional Analysis and Outlook
8.3.3. United Kingdom Reduced Fat Packaged Food Regional Analysis and Outlook
8.3.4. Spain Reduced Fat Packaged Food Regional Analysis and Outlook
8.3.5. Italy Reduced Fat Packaged Food Regional Analysis and Outlook
8.3.6. Russia Reduced Fat Packaged Food Regional Analysis and Outlook
8.3.7. Rest of Europe Reduced Fat Packaged Food Regional Analysis and Outlook
8.4. Asia Pacific Reduced Fat Packaged Food Revenue (USD Million) by Country (2021-2032)
8.4.1. China Reduced Fat Packaged Food Regional Analysis and Outlook
8.4.2. Japan Reduced Fat Packaged Food Regional Analysis and Outlook
8.4.3. India Reduced Fat Packaged Food Regional Analysis and Outlook
8.4.4. South Korea Reduced Fat Packaged Food Regional Analysis and Outlook
8.4.5. Australia Reduced Fat Packaged Food Regional Analysis and Outlook
8.4.6. South East Asia Reduced Fat Packaged Food Regional Analysis and Outlook
8.4.7. Rest of Asia Pacific Reduced Fat Packaged Food Regional Analysis and Outlook
8.5. South America Reduced Fat Packaged Food Revenue (USD Million), by Country (2021-2032)
8.5.1. Brazil Reduced Fat Packaged Food Regional Analysis and Outlook
8.5.2. Argentina Reduced Fat Packaged Food Regional Analysis and Outlook
8.5.3. Rest of South America Reduced Fat Packaged Food Regional Analysis and Outlook
8.6. Middle East and Africa Reduced Fat Packaged Food Revenue (USD Million) by Country (2021-2032)
8.6.1. Middle East Reduced Fat Packaged Food Regional Analysis and Outlook
8.6.2. Africa Reduced Fat Packaged Food Regional Analysis and Outlook
Chapter 9. North America Reduced Fat Packaged Food Analysis and Outlook
9.1. North America Reduced Fat Packaged Food Revenue (USD Million) by Segments (2021-2032)
9.1.1. North America Reduced Fat Packaged Food Revenue (USD Million) by Type (2021-2032)
9.1.2. North America Reduced Fat Packaged Food Revenue (USD Million) by Application (2021-2032)
9.1.3. North America Reduced Fat Packaged Food Revenue (USD Million) by Product (2021-2032)
By Application
Bakery
Dairy
Cereals
Meat products
Others
By Distribution Channel
Supermarkets/Hypermarkets
Convenience stores
Specialty stores
Online
Chapter 10. Europe Reduced Fat Packaged Food Analysis and Outlook
10.1. Europe Reduced Fat Packaged Food Revenue (USD Million), by Segments (USD Million) (2021-2032)
10.1.1. Europe Reduced Fat Packaged Food Revenue (USD Million) by Type (2021-2032)
10.1.2. Europe Reduced Fat Packaged Food Revenue (USD Million) by Application (2021-2032)
10.1.3. Europe Reduced Fat Packaged Food Revenue (USD Million) by Product (2021-2032)
By Application
Bakery
Dairy
Cereals
Meat products
Others
By Distribution Channel
Supermarkets/Hypermarkets
Convenience stores
Specialty stores
Online
Chapter 11. Asia Pacific Reduced Fat Packaged Food Analysis and Outlook
11.1. Asia Pacific Reduced Fat Packaged Food Revenue (USD Million), and Revenue (USD Million) by Segments (2021-2032)
11.1.1. Asia Pacific Reduced Fat Packaged Food Revenue (USD Million) by Type (2021-2032)
11.1.2. Asia Pacific Reduced Fat Packaged Food Revenue (USD Million) by Application (2021-2032)
11.1.3. Asia Pacific Reduced Fat Packaged Food Revenue (USD Million) by Product (2021-2032)
By Application
Bakery
Dairy
Cereals
Meat products
Others
By Distribution Channel
Supermarkets/Hypermarkets
Convenience stores
Specialty stores
Online
Chapter 12. South America Reduced Fat Packaged Food Analysis and Outlook
12.1. South America Reduced Fat Packaged Food Revenue (USD Million), by Segments (2021-2032)
12.1.1. South America Reduced Fat Packaged Food Revenue (USD Million) by Type (2021-2032)
12.1.2. South America Reduced Fat Packaged Food Revenue (USD Million) by Application (2021-2032)
12.1.3. South America Reduced Fat Packaged Food Revenue (USD Million) by Product (2021-2032)
By Application
Bakery
Dairy
Cereals
Meat products
Others
By Distribution Channel
Supermarkets/Hypermarkets
Convenience stores
Specialty stores
Online
Chapter 13. Middle East and Africa Reduced Fat Packaged Food Analysis and Outlook
13.1. Middle East and Africa Reduced Fat Packaged Food Revenue (USD Million), by Segments (2021-2032)
13.1.1. Middle East and Africa Reduced Fat Packaged Food Revenue (USD Million) by Type (2021-2032)
13.1.2. Middle East and Africa Reduced Fat Packaged Food Revenue (USD Million) by Application (2021-2032)
13.1.3. Middle East and Africa Reduced Fat Packaged Food Revenue (USD Million) by Product (2021-2032)
By Application
Bakery
Dairy
Cereals
Meat products
Others
By Distribution Channel
Supermarkets/Hypermarkets
Convenience stores
Specialty stores
Online
Chapter 14. Reduced Fat Packaged Food Company Profiles
14.1 Business Overview
14.2 Product Profiles
14.3 SWOT Profiles
14.5 Recent Developments
14.6 Financial Profile
List of Companies
Bunge Ltd
Campbell Soup Co.
Cargill Inc
Conagra Brands Inc
General Mills Inc
Kellogg Co.
Kerry Group Plc
Land O Lakes Inc
Mondelez International Inc
Nestle SA
PepsiCo Inc
Rockview Farms
Tesco Plc
The Hain Celestial Group Inc
The Hershey Co.
The Kraft Heinz Co.
Tyson Foods Inc
15. Methodology and Data Sources
15.1 Customization Offerings
15.2 Subscription Services
15.3 Related Reports
15.4 Publisher Expertise
LIST OF TABLES
Table 1 Market Segmentation Analysis
Table 2 Global Reduced Fat Packaged Food Market Share of Leading Companies, 2023
Table 3 Product Offerings of Leading Companies
Table 4 Low Growth Scenario Forecasts
Table 5 Reference Case Growth Scenario
Table 6 High Growth Case Scenario
Table 7 Global Reduced Fat Packaged Food Revenue (USD Million) And CAGR (%) By Type (2021-2032)
Table 8 Global Reduced Fat Packaged Food Revenue (USD Million) And CAGR (%) By Application (2021-2032)
Table 9 Global Reduced Fat Packaged Food Revenue (USD Million) And CAGR (%) By Product (2021-2032)
Table 10 Global Reduced Fat Packaged Food Market Revenue (USD Million) By Regions (2021-2032)
Table 11 Global Reduced Fat Packaged Food Market Share (%) By Regions (2021-2032)
Table 12 North America Reduced Fat Packaged Food Revenue (USD Million) By Country (2021-2032)
Table 13 Europe Reduced Fat Packaged Food Revenue (USD Million) By Country (2021-2032)
Table 14 Asia Pacific Reduced Fat Packaged Food Revenue (USD Million) By Country (2021-2032)
Table 15 South America Reduced Fat Packaged Food Revenue (USD Million) By Country (2021-2032)
Table 16 Middle East and Africa Reduced Fat Packaged Food Revenue (USD Million) By Region (2021-2032)
Table 17 North America Reduced Fat Packaged Food Revenue (USD Million) By Type (2021-2032)
Table 18 North America Reduced Fat Packaged Food Revenue (USD Million) By Application (2021-2032)
Table 19 North America Reduced Fat Packaged Food Revenue (USD Million) By Product (2021-2032)
Table 20 Europe Reduced Fat Packaged Food Revenue (USD Million) By Type (2021-2032)
Table 21 Europe Reduced Fat Packaged Food Revenue (USD Million) By Application (2021-2032)
Table 22 Europe Reduced Fat Packaged Food Revenue (USD Million) By Product (2021-2032)
Table 23 Asia Pacific Reduced Fat Packaged Food Revenue (USD Million) By Type (2021-2032)
Table 24 Asia Pacific Reduced Fat Packaged Food Revenue (USD Million) By Application (2021-2032)
Table 25 Asia Pacific Reduced Fat Packaged Food Revenue (USD Million) By Product (2021-2032)
Table 26 South America Reduced Fat Packaged Food Revenue (USD Million) By Type (2021-2032)
Table 27 South America Reduced Fat Packaged Food Revenue (USD Million) By Application (2021-2032)
Table 28 South America Reduced Fat Packaged Food Revenue (USD Million) By Product (2021-2032)
Table 29 Middle East and Africa Reduced Fat Packaged Food Revenue (USD Million) By Type (2021-2032)
Table 30 Middle East and Africa Reduced Fat Packaged Food Revenue (USD Million) By Application (2021-2032)
Table 31 Middle East and Africa Reduced Fat Packaged Food Revenue (USD Million) By Product (2021-2032)
LIST OF FIGURES
Figure 1. Market Scope
Figure 2. Pricing Forecasts Per Unit, 2023- 2032
Figure 3. Porter’s Five Forces
Figure 4. Global Reduced Fat Packaged Food Market Revenue (USD Million) By Regions (2021-2032)
Figure 5. Global Reduced Fat Packaged Food Market Share (%) By Regions (2023)
Figure 6. North America Reduced Fat Packaged Food Revenue (USD Million) By Country (2021-2032)
Figure 7. United States Reduced Fat Packaged Food Revenue (USD Million) By Country (2021-2032)
Figure 8. Canada Reduced Fat Packaged Food Revenue (USD Million) By Country (2021-2032)
Figure 9. Mexico Reduced Fat Packaged Food Revenue (USD Million) By Country (2021-2032)
Figure 10. Europe Reduced Fat Packaged Food Revenue (USD Million) By Country (2021-2032)
Figure 11. Germany Reduced Fat Packaged Food Revenue (USD Million) By Country (2021-2032)
Figure 12. France Reduced Fat Packaged Food Revenue (USD Million) By Country (2021-2032)
Figure 13. United Kingdom Reduced Fat Packaged Food Revenue (USD Million) By Country (2021-2032)
Figure 14. Spain Reduced Fat Packaged Food Revenue (USD Million) By Country (2021-2032)
Figure 15. Italy Reduced Fat Packaged Food Revenue (USD Million) By Country (2021-2032)
Figure 16. Russia Reduced Fat Packaged Food Revenue (USD Million) By Country (2021-2032)
Figure 17. Rest of Europe Reduced Fat Packaged Food Revenue (USD Million) By Country (2021-2032)
Figure 11. Asia Pacific Reduced Fat Packaged Food Revenue (USD Million) By Country (2021-2032)
Figure 12. China Reduced Fat Packaged Food Revenue (USD Million) By Country (2021-2032)
Figure 13. Japan Reduced Fat Packaged Food Revenue (USD Million) By Country (2021-2032)
Figure 14. India Reduced Fat Packaged Food Revenue (USD Million) By Country (2021-2032)
Figure 15. South Korea Reduced Fat Packaged Food Revenue (USD Million) By Country (2021-2032)
Figure 16. Australia Reduced Fat Packaged Food Revenue (USD Million) By Country (2021-2032)
Figure 17. South East Asia Reduced Fat Packaged Food Revenue (USD Million) By Country (2021-2032)
Figure 18. South America Reduced Fat Packaged Food Revenue (USD Million) By Country (2021-2032)
Figure 19. Brazil Reduced Fat Packaged Food Revenue (USD Million) By Country (2021-2032)
Figure 20. Argentina Reduced Fat Packaged Food Revenue (USD Million) By Country (2021-2032)
Figure 21. Rest of Asia Pacific Reduced Fat Packaged Food Revenue (USD Million) By Country (2021-2032)
Figure 22. Middle East and Africa Reduced Fat Packaged Food Revenue (USD Million) By Region (2021-2032)
Figure 23. Saudi Arabia Reduced Fat Packaged Food Revenue (USD Million) By Region (2021-2032)
Figure 24. The UAE Reduced Fat Packaged Food Revenue (USD Million) By Region (2021-2032)
Figure 25. Rest of Middle East Reduced Fat Packaged Food Revenue (USD Million) By Region (2021-2032)
Figure 26. South Africa Reduced Fat Packaged Food Revenue (USD Million) By Region (2021-2032)
Figure 27. Africa Reduced Fat Packaged Food Revenue (USD Million) By Region (2021-2032)
Figure 28. North America Reduced Fat Packaged Food Revenue (USD Million) By Type (2021-2032)
Figure 29. North America Reduced Fat Packaged Food Revenue (USD Million) By Application (2021-2032)
Figure 30. North America Reduced Fat Packaged Food Revenue (USD Million) By Product (2021-2032)
Figure 31. Europe Reduced Fat Packaged Food Revenue (USD Million) By Type (2021-2032)
Figure 32. Europe Reduced Fat Packaged Food Revenue (USD Million) By Application (2021-2032)
Figure 33. Europe Reduced Fat Packaged Food Revenue (USD Million) By Product (2021-2032)
Figure 34. Asia Pacific Reduced Fat Packaged Food Revenue (USD Million) By Type (2021-2032)
Figure 35. Asia Pacific Reduced Fat Packaged Food Revenue (USD Million) By Application (2021-2032)
Figure 36. Asia Pacific Reduced Fat Packaged Food Revenue (USD Million) By Product (2021-2032)
Figure 37. South America Reduced Fat Packaged Food Revenue (USD Million) By Type (2021-2032)
Figure 38. South America Reduced Fat Packaged Food Revenue (USD Million) By Application (2021-2032)
Figure 39. South America Reduced Fat Packaged Food Revenue (USD Million) By Product (2021-2032)
Figure 40. Middle East and Africa Reduced Fat Packaged Food Revenue (USD Million) By Type (2021-2032)
Figure 41. Middle East and Africa Reduced Fat Packaged Food Revenue (USD Million) By Application (2021-2032)
Figure 42. Middle East and Africa Reduced Fat Packaged Food Revenue (USD Million) By Product (2021-2032)
By Application
Bakery
Dairy
Cereals
Meat products
Others
By Distribution Channel
Supermarkets/Hypermarkets
Convenience stores
Specialty stores
Online
Countries Analyzed
North America (US, Canada, Mexico)
Europe (Germany, UK, France, Spain, Italy, Russia, Rest of Europe)
Asia Pacific (China, India, Japan, South Korea, Australia, South East Asia, Rest of Asia)
South America (Brazil, Argentina, Rest of South America)
Middle East and Africa (Saudi Arabia, UAE, Rest of Middle East, South Africa, Egypt, Rest of Africa)
