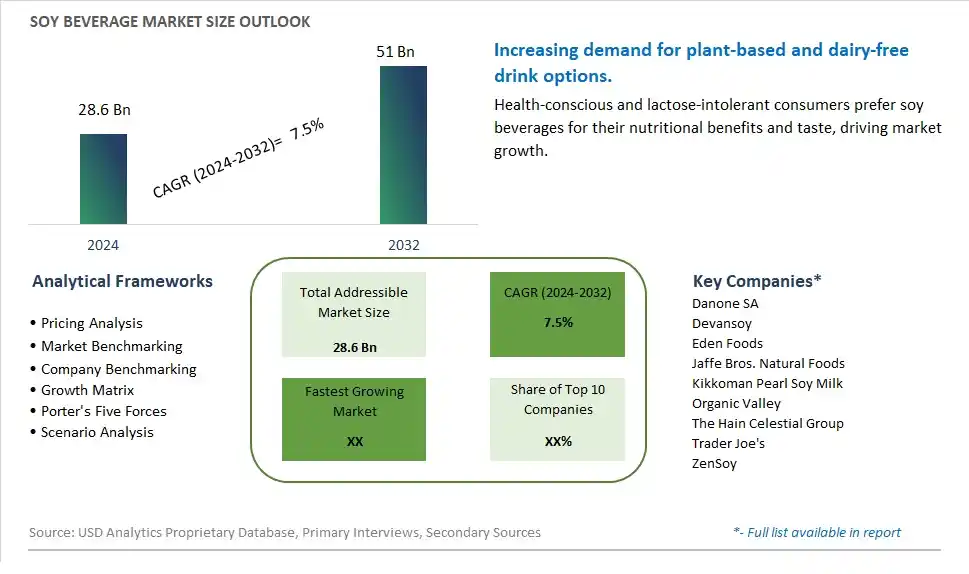
Global Soy Beverage Market Size is valued at $28.6 Billion in 2024 and is forecast to register a growth rate (CAGR) of 7.5% to reach $51 Billion by 2032.
The global Soy Beverage Market Comprehensive Study analyzes and forecasts the market size across 6 regions and 24 countries for diverse segments -By Product (Soy Milk, Soy-Based Drinkable Yogurt), By Flavor (Plain Soy Beverages, Flavored Soy Beverages), By Distribution Channel (Supermarkets/Hypermarkets, Pharmacies/Drug Stores, Online Retail Stores, Convenience Stores, Others)
An Introduction to Soy Beverage Market
In 2024, the soy beverage market is experiencing steady growth driven by shifting consumer preferences towards plant-based alternatives and growing awareness of the health benefits associated with soy consumption. Soy beverages, made from soybeans and enriched with vitamins and minerals, offer a nutritious and dairy-free alternative to traditional dairy milk. With rising concerns about lactose intolerance, milk allergies, and environmental sustainability, consumers are increasingly turning to soy beverages as a versatile and sustainable source of protein, calcium, and essential nutrients. Moreover, advancements in food processing technologies have improved the taste, texture, and nutritional profile of soy beverages, expanding their appeal to a broader audience. As demand for plant-based beverages continues to rise, the soy beverage market is expected to witness further innovation and market penetration in the years ahead.
Soy Beverage Competitive Landscape
The market report analyses the leading companies in the industry including Danone SA, Devansoy, Eden Foods, Jaffe Bros. Natural Foods, Kikkoman Pearl Soy Milk, Organic Valley, The Hain Celestial Group, Trader Joe's, ZenSoy, and Others.
Soy Beverage Market Dynamics
Soy Beverage Market Trend: Rising Demand for Plant-Based Alternatives in the Beverage Industry
The market trend for soy beverages reflects a rising demand for plant-based alternatives in the beverage industry. As consumers increasingly seek healthier and more sustainable dietary choices, plant-based beverages like soy milk have gained popularity as alternatives to traditional dairy products. Soy beverages are valued for their nutritional benefits, including being a rich source of protein, vitamins, and minerals, as well as their lactose-free and cholesterol-free properties. This trend is driven by factors such as growing concerns about animal welfare, environmental sustainability, and health consciousness, prompting consumers to incorporate plant-based options into their diets.
Market Driver: Health and Wellness Considerations Driving Dietary Shifts
The market for soy beverages is primarily driven by health and wellness considerations that are driving dietary shifts among consumers. With a growing emphasis on preventive healthcare and lifestyle-related chronic diseases, individuals are increasingly adopting plant-based diets for their potential health benefits. Soy beverages are perceived as nutritious and functional beverages that contribute to overall well-being, offering benefits such as heart health support, bone health maintenance, and weight management. Additionally, as consumers become more educated about the environmental and ethical implications of food choices, they are choosing soy beverages as part of a sustainable and compassionate lifestyle.
Market Opportunity: Product Innovation and Diversification to Meet Consumer Preferences
An opportunity for the soy beverage market lies in product innovation and diversification to meet evolving consumer preferences and market trends. Manufacturers can capitalize on the growing demand for plant-based beverages by introducing innovative soy beverage formulations that cater to diverse consumer needs and preferences. This includes developing flavored varieties, such as vanilla, chocolate, and strawberry, to enhance taste appeal and broaden market appeal among consumers of all ages. Additionally, there is an opportunity to fortify soy beverages with additional nutrients, such as vitamins, minerals, and antioxidants, to enhance their functional properties and nutritional profile. Moreover, expanding distribution channels, such as online retail platforms and convenience stores, can further increase accessibility and visibility of soy beverages, driving growth and market penetration in the plant-based beverage segment.
Soy Beverage Market Share Analysis: Soy-Based Drinkable Yogurt is the Fastest Growing Segment to 2032
Soy-based drinkable yogurt is expected to be the fastest-growing segment in the Soy Beverage Market by product to 2032. The demand for soy-based drinkable yogurt is driven by the increasing awareness of the health benefits of soy, including high protein content, lactose-free properties, and digestive health support. Soy-based drinkable yogurt appeals to consumers seeking nutritious and convenient beverage options. Additionally, advancements in yogurt formulation and the development of high-quality, flavorful soy-based products contribute to the segment's rapid growth. The expansion of product offerings and the increasing availability of soy-based drinkable yogurt in various retail channels support the growth of this segment.
Soy Beverage Market by Flavor: Flavored Soy Beverages is the Fastest Growing Segment to 2032
Flavored soy beverages are anticipated to be the fastest-growing segment in the Soy Beverage Market by flavor to 2032. The demand for flavored soy beverages is driven by the increasing preference for tasty and nutritious drink options that offer a variety of flavors. Consumers are seeking alternatives to traditional dairy beverages that provide health benefits, such as high protein and essential nutrients. Additionally, the growing trend of plant-based diets and the rising popularity of flavored beverages contribute to the segment's rapid growth. The expansion of product offerings and the increasing availability of flavored soy beverages in various retail channels support the growth of this segment.
Soy Beverage Market by Distribution Channel: Online Retail Stores is the Fastest Growing Segment to 2032
The online retail stores segment is expected to be the fastest-growing in the Soy Beverage Market by distribution channel to 2032. The convenience and accessibility of online shopping, combined with the growing consumer preference for e-commerce, drive the rapid growth of this segment. Online platforms offer a wide variety of soy beverages, detailed product descriptions, and customer reviews, making it easier for consumers to make informed purchasing decisions. The COVID-19 pandemic has further accelerated the shift towards online shopping, as consumers seek contactless and convenient ways to purchase their favorite soy beverages. Subscription services and direct-to-consumer models also contribute to the segment's expansion, providing consumers with regular deliveries of their preferred soy beverages.
Soy Beverage Market Segmentation
By Product
Soy Milk
Soy-Based Drinkable Yogurt
By Flavor
Plain Soy Beverages
Flavored Soy Beverages
By Distribution Channel
Supermarkets/Hypermarkets
Pharmacies/Drug Stores
Online Retail Stores
Convenience Stores
Others
Countries Analyzed
North America (US, Canada, Mexico)
Europe (Germany, UK, France, Spain, Italy, Russia, Rest of Europe)
Asia Pacific (China, India, Japan, South Korea, Australia, South East Asia, Rest of Asia)
South America (Brazil, Argentina, Rest of South America)
Middle East and Africa (Saudi Arabia, UAE, Rest of Middle East, South Africa, Egypt, Rest of Africa)
Soy Beverage Companies Profiled in the Study
Danone SA
Devansoy
Eden Foods
Jaffe Bros. Natural Foods
Kikkoman Pearl Soy Milk
Organic Valley
The Hain Celestial Group
Trader Joe's
ZenSoy
*- List Not Exhaustive
Chapter 1. TABLE OF CONTENTS
Chapter 2. Introduction to Soy Beverage Market
2.1. Market Overview
2.2. Key Statistics and Report Highlights
2.3. Scope of the Comprehensive Study
2.3.1. Market Definition
2.3.2 Countries and Regions Covered
2.3.3 Research Objective
2.3.4 Units, Currency, and Conversions
2.3.5 Industry Value Chain
2.4. Key Market Segments
2.5. Key Companies
2.6. Study Period
Chapter 3. Strategic Analysis Review
3.1. Soy Beverage Pricing Analysis and Forecast
3.2. Porter’s Five Forces
3.3. Market Ecosystem
3.4. SWOT Analysis
3.5. Regulatory Scenario
3.3. Effects of Inflation, Russia-Ukraine War, moderating economic growth, and other macroeconomic factors
Chapter 4. Competitive Landscape
4.1. Market Share Analysis
4.1.1. Global Soy Beverage Market Share by Company, 2023
4.1.2. Product Offerings of Leading Soy Beverage Companies
4.2. Market Entropy
4.2.1. New Product Launches in the Industry
4.2.2. Mergers, Acquisitions, Joint ventures, and Partnerships
4.3. Key Strategies and Best Practices
Chapter 5. Global Market Projections: Best, Reference, and Low Case Scenarios
5.1. Growth Analysis- Case Scenario Definitions
5.2. Low Growth Case Scenario Forecasts
5.3. Reference Growth Case Scenario Forecasts
5.4. High Growth Case Scenario Forecasts
Chapter 6. Market Dynamics
6.1. Soy Beverage Market Drivers
6.2. Soy Beverage Market Challenges
6.6. Soy Beverage Market Opportunities
6.4. Soy Beverage Market Trends
Chapter 7. Global Soy Beverage Market Outlook Trends
7.1. Global Soy Beverage Revenue (USD Million) and CAGR (%) by Type (2021-2032)
7.2. Global Soy Beverage Revenue (USD Million) and CAGR (%) by Application (2021-2032)
7.3. Global Soy Beverage Revenue (USD Million) and CAGR (%) by Product (2021-2032)
By Product
Soy Milk
Soy-Based Drinkable Yogurt
By Flavor
Plain Soy Beverages
Flavored Soy Beverages
By Distribution Channel
Supermarkets/Hypermarkets
Pharmacies/Drug Stores
Online Retail Stores
Convenience Stores
Others
Chapter 8. Global Soy Beverage Regional Analysis and Outlook
8.1. Global Soy Beverage Revenue (USD Million) By Regions (2021- 2032)
8.2. North America Soy Beverage Revenue (USD Million) by Country (2021-2032)
8.2.1. United States Soy Beverage Regional Analysis and Outlook
8.2.2. Canada Soy Beverage Regional Analysis and Outlook
8.2.3. Mexico Soy Beverage Regional Analysis and Outlook
8.3. Europe Soy Beverage Revenue (USD Million), by Country (2021-2032)
8.3.1. Germany Soy Beverage Regional Analysis and Outlook
8.3.2. France Soy Beverage Regional Analysis and Outlook
8.3.3. United Kingdom Soy Beverage Regional Analysis and Outlook
8.3.4. Spain Soy Beverage Regional Analysis and Outlook
8.3.5. Italy Soy Beverage Regional Analysis and Outlook
8.3.6. Russia Soy Beverage Regional Analysis and Outlook
8.3.7. Rest of Europe Soy Beverage Regional Analysis and Outlook
8.4. Asia Pacific Soy Beverage Revenue (USD Million) by Country (2021-2032)
8.4.1. China Soy Beverage Regional Analysis and Outlook
8.4.2. Japan Soy Beverage Regional Analysis and Outlook
8.4.3. India Soy Beverage Regional Analysis and Outlook
8.4.4. South Korea Soy Beverage Regional Analysis and Outlook
8.4.5. Australia Soy Beverage Regional Analysis and Outlook
8.4.6. South East Asia Soy Beverage Regional Analysis and Outlook
8.4.7. Rest of Asia Pacific Soy Beverage Regional Analysis and Outlook
8.5. South America Soy Beverage Revenue (USD Million), by Country (2021-2032)
8.5.1. Brazil Soy Beverage Regional Analysis and Outlook
8.5.2. Argentina Soy Beverage Regional Analysis and Outlook
8.5.3. Rest of South America Soy Beverage Regional Analysis and Outlook
8.6. Middle East and Africa Soy Beverage Revenue (USD Million) by Country (2021-2032)
8.6.1. Middle East Soy Beverage Regional Analysis and Outlook
8.6.2. Africa Soy Beverage Regional Analysis and Outlook
Chapter 9. North America Soy Beverage Analysis and Outlook
9.1. North America Soy Beverage Revenue (USD Million) by Segments (2021-2032)
9.1.1. North America Soy Beverage Revenue (USD Million) by Type (2021-2032)
9.1.2. North America Soy Beverage Revenue (USD Million) by Application (2021-2032)
9.1.3. North America Soy Beverage Revenue (USD Million) by Product (2021-2032)
By Product
Soy Milk
Soy-Based Drinkable Yogurt
By Flavor
Plain Soy Beverages
Flavored Soy Beverages
By Distribution Channel
Supermarkets/Hypermarkets
Pharmacies/Drug Stores
Online Retail Stores
Convenience Stores
Others
Chapter 10. Europe Soy Beverage Analysis and Outlook
10.1. Europe Soy Beverage Revenue (USD Million), by Segments (USD Million) (2021-2032)
10.1.1. Europe Soy Beverage Revenue (USD Million) by Type (2021-2032)
10.1.2. Europe Soy Beverage Revenue (USD Million) by Application (2021-2032)
10.1.3. Europe Soy Beverage Revenue (USD Million) by Product (2021-2032)
By Product
Soy Milk
Soy-Based Drinkable Yogurt
By Flavor
Plain Soy Beverages
Flavored Soy Beverages
By Distribution Channel
Supermarkets/Hypermarkets
Pharmacies/Drug Stores
Online Retail Stores
Convenience Stores
Others
Chapter 11. Asia Pacific Soy Beverage Analysis and Outlook
11.1. Asia Pacific Soy Beverage Revenue (USD Million), and Revenue (USD Million) by Segments (2021-2032)
11.1.1. Asia Pacific Soy Beverage Revenue (USD Million) by Type (2021-2032)
11.1.2. Asia Pacific Soy Beverage Revenue (USD Million) by Application (2021-2032)
11.1.3. Asia Pacific Soy Beverage Revenue (USD Million) by Product (2021-2032)
By Product
Soy Milk
Soy-Based Drinkable Yogurt
By Flavor
Plain Soy Beverages
Flavored Soy Beverages
By Distribution Channel
Supermarkets/Hypermarkets
Pharmacies/Drug Stores
Online Retail Stores
Convenience Stores
Others
Chapter 12. South America Soy Beverage Analysis and Outlook
12.1. South America Soy Beverage Revenue (USD Million), by Segments (2021-2032)
12.1.1. South America Soy Beverage Revenue (USD Million) by Type (2021-2032)
12.1.2. South America Soy Beverage Revenue (USD Million) by Application (2021-2032)
12.1.3. South America Soy Beverage Revenue (USD Million) by Product (2021-2032)
By Product
Soy Milk
Soy-Based Drinkable Yogurt
By Flavor
Plain Soy Beverages
Flavored Soy Beverages
By Distribution Channel
Supermarkets/Hypermarkets
Pharmacies/Drug Stores
Online Retail Stores
Convenience Stores
Others
Chapter 13. Middle East and Africa Soy Beverage Analysis and Outlook
13.1. Middle East and Africa Soy Beverage Revenue (USD Million), by Segments (2021-2032)
13.1.1. Middle East and Africa Soy Beverage Revenue (USD Million) by Type (2021-2032)
13.1.2. Middle East and Africa Soy Beverage Revenue (USD Million) by Application (2021-2032)
13.1.3. Middle East and Africa Soy Beverage Revenue (USD Million) by Product (2021-2032)
By Product
Soy Milk
Soy-Based Drinkable Yogurt
By Flavor
Plain Soy Beverages
Flavored Soy Beverages
By Distribution Channel
Supermarkets/Hypermarkets
Pharmacies/Drug Stores
Online Retail Stores
Convenience Stores
Others
Chapter 14. Soy Beverage Company Profiles
14.1 Business Overview
14.2 Product Profiles
14.3 SWOT Profiles
14.5 Recent Developments
14.6 Financial Profile
List of Companies
Danone SA
Devansoy
Eden Foods
Jaffe Bros. Natural Foods
Kikkoman Pearl Soy Milk
Organic Valley
The Hain Celestial Group
Trader Joe's
ZenSoy
15. Methodology and Data Sources
15.1 Customization Offerings
15.2 Subscription Services
15.3 Related Reports
15.4 Publisher Expertise
LIST OF TABLES
Table 1 Market Segmentation Analysis
Table 2 Global Soy Beverage Market Share of Leading Companies, 2023
Table 3 Product Offerings of Leading Companies
Table 4 Low Growth Scenario Forecasts
Table 5 Reference Case Growth Scenario
Table 6 High Growth Case Scenario
Table 7 Global Soy Beverage Revenue (USD Million) And CAGR (%) By Type (2021-2032)
Table 8 Global Soy Beverage Revenue (USD Million) And CAGR (%) By Application (2021-2032)
Table 9 Global Soy Beverage Revenue (USD Million) And CAGR (%) By Product (2021-2032)
Table 10 Global Soy Beverage Market Revenue (USD Million) By Regions (2021-2032)
Table 11 Global Soy Beverage Market Share (%) By Regions (2021-2032)
Table 12 North America Soy Beverage Revenue (USD Million) By Country (2021-2032)
Table 13 Europe Soy Beverage Revenue (USD Million) By Country (2021-2032)
Table 14 Asia Pacific Soy Beverage Revenue (USD Million) By Country (2021-2032)
Table 15 South America Soy Beverage Revenue (USD Million) By Country (2021-2032)
Table 16 Middle East and Africa Soy Beverage Revenue (USD Million) By Region (2021-2032)
Table 17 North America Soy Beverage Revenue (USD Million) By Type (2021-2032)
Table 18 North America Soy Beverage Revenue (USD Million) By Application (2021-2032)
Table 19 North America Soy Beverage Revenue (USD Million) By Product (2021-2032)
Table 20 Europe Soy Beverage Revenue (USD Million) By Type (2021-2032)
Table 21 Europe Soy Beverage Revenue (USD Million) By Application (2021-2032)
Table 22 Europe Soy Beverage Revenue (USD Million) By Product (2021-2032)
Table 23 Asia Pacific Soy Beverage Revenue (USD Million) By Type (2021-2032)
Table 24 Asia Pacific Soy Beverage Revenue (USD Million) By Application (2021-2032)
Table 25 Asia Pacific Soy Beverage Revenue (USD Million) By Product (2021-2032)
Table 26 South America Soy Beverage Revenue (USD Million) By Type (2021-2032)
Table 27 South America Soy Beverage Revenue (USD Million) By Application (2021-2032)
Table 28 South America Soy Beverage Revenue (USD Million) By Product (2021-2032)
Table 29 Middle East and Africa Soy Beverage Revenue (USD Million) By Type (2021-2032)
Table 30 Middle East and Africa Soy Beverage Revenue (USD Million) By Application (2021-2032)
Table 31 Middle East and Africa Soy Beverage Revenue (USD Million) By Product (2021-2032)
LIST OF FIGURES
Figure 1. Market Scope
Figure 2. Pricing Forecasts Per Unit, 2023- 2032
Figure 3. Porter’s Five Forces
Figure 4. Global Soy Beverage Market Revenue (USD Million) By Regions (2021-2032)
Figure 5. Global Soy Beverage Market Share (%) By Regions (2023)
Figure 6. North America Soy Beverage Revenue (USD Million) By Country (2021-2032)
Figure 7. United States Soy Beverage Revenue (USD Million) By Country (2021-2032)
Figure 8. Canada Soy Beverage Revenue (USD Million) By Country (2021-2032)
Figure 9. Mexico Soy Beverage Revenue (USD Million) By Country (2021-2032)
Figure 10. Europe Soy Beverage Revenue (USD Million) By Country (2021-2032)
Figure 11. Germany Soy Beverage Revenue (USD Million) By Country (2021-2032)
Figure 12. France Soy Beverage Revenue (USD Million) By Country (2021-2032)
Figure 13. United Kingdom Soy Beverage Revenue (USD Million) By Country (2021-2032)
Figure 14. Spain Soy Beverage Revenue (USD Million) By Country (2021-2032)
Figure 15. Italy Soy Beverage Revenue (USD Million) By Country (2021-2032)
Figure 16. Russia Soy Beverage Revenue (USD Million) By Country (2021-2032)
Figure 17. Rest of Europe Soy Beverage Revenue (USD Million) By Country (2021-2032)
Figure 11. Asia Pacific Soy Beverage Revenue (USD Million) By Country (2021-2032)
Figure 12. China Soy Beverage Revenue (USD Million) By Country (2021-2032)
Figure 13. Japan Soy Beverage Revenue (USD Million) By Country (2021-2032)
Figure 14. India Soy Beverage Revenue (USD Million) By Country (2021-2032)
Figure 15. South Korea Soy Beverage Revenue (USD Million) By Country (2021-2032)
Figure 16. Australia Soy Beverage Revenue (USD Million) By Country (2021-2032)
Figure 17. South East Asia Soy Beverage Revenue (USD Million) By Country (2021-2032)
Figure 18. South America Soy Beverage Revenue (USD Million) By Country (2021-2032)
Figure 19. Brazil Soy Beverage Revenue (USD Million) By Country (2021-2032)
Figure 20. Argentina Soy Beverage Revenue (USD Million) By Country (2021-2032)
Figure 21. Rest of Asia Pacific Soy Beverage Revenue (USD Million) By Country (2021-2032)
Figure 22. Middle East and Africa Soy Beverage Revenue (USD Million) By Region (2021-2032)
Figure 23. Saudi Arabia Soy Beverage Revenue (USD Million) By Region (2021-2032)
Figure 24. The UAE Soy Beverage Revenue (USD Million) By Region (2021-2032)
Figure 25. Rest of Middle East Soy Beverage Revenue (USD Million) By Region (2021-2032)
Figure 26. South Africa Soy Beverage Revenue (USD Million) By Region (2021-2032)
Figure 27. Africa Soy Beverage Revenue (USD Million) By Region (2021-2032)
Figure 28. North America Soy Beverage Revenue (USD Million) By Type (2021-2032)
Figure 29. North America Soy Beverage Revenue (USD Million) By Application (2021-2032)
Figure 30. North America Soy Beverage Revenue (USD Million) By Product (2021-2032)
Figure 31. Europe Soy Beverage Revenue (USD Million) By Type (2021-2032)
Figure 32. Europe Soy Beverage Revenue (USD Million) By Application (2021-2032)
Figure 33. Europe Soy Beverage Revenue (USD Million) By Product (2021-2032)
Figure 34. Asia Pacific Soy Beverage Revenue (USD Million) By Type (2021-2032)
Figure 35. Asia Pacific Soy Beverage Revenue (USD Million) By Application (2021-2032)
Figure 36. Asia Pacific Soy Beverage Revenue (USD Million) By Product (2021-2032)
Figure 37. South America Soy Beverage Revenue (USD Million) By Type (2021-2032)
Figure 38. South America Soy Beverage Revenue (USD Million) By Application (2021-2032)
Figure 39. South America Soy Beverage Revenue (USD Million) By Product (2021-2032)
Figure 40. Middle East and Africa Soy Beverage Revenue (USD Million) By Type (2021-2032)
Figure 41. Middle East and Africa Soy Beverage Revenue (USD Million) By Application (2021-2032)
Figure 42. Middle East and Africa Soy Beverage Revenue (USD Million) By Product (2021-2032)
By Product
Soy Milk
Soy-Based Drinkable Yogurt
By Flavor
Plain Soy Beverages
Flavored Soy Beverages
By Distribution Channel
Supermarkets/Hypermarkets
Pharmacies/Drug Stores
Online Retail Stores
Convenience Stores
Others
Countries Analyzed
North America (US, Canada, Mexico)
Europe (Germany, UK, France, Spain, Italy, Russia, Rest of Europe)
Asia Pacific (China, India, Japan, South Korea, Australia, South East Asia, Rest of Asia)
South America (Brazil, Argentina, Rest of South America)
Middle East and Africa (Saudi Arabia, UAE, Rest of Middle East, South Africa, Egypt, Rest of Africa)
