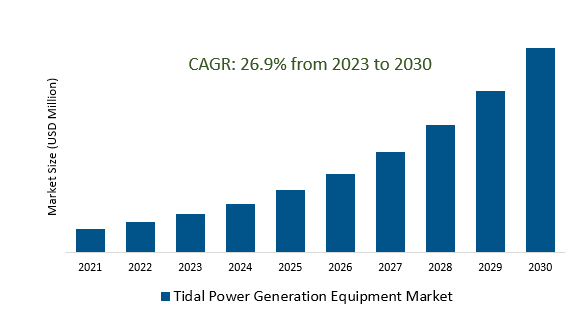
The Global Tidal Power Generation Equipment Market Size is estimated to register 26.9% growth over the forecast period from 2023 to 2030.
The expansion of the market is propelled by a growing partnership among governments, private enterprises, and research institutions, aiming to expedite research and development in tidal energy technology. This involves establishing international collaborations to exchange knowledge and resources, thereby stimulating innovation in the field of tidal power generation equipment. Leading Companies focusing on Global Expansion and Market Penetration, Technological Innovation and Research Focus, Hybrid Renewable Energy Systems, and others to boost market shares in the industry.
Market Overview
The Tidal Power Generation Equipment Market revolves around converting tidal energy into electricity, driven by a surge in global demand for sustainable energy. Key components include tidal turbines, generators, support structures, and power electronics. The market faces challenges such as high initial costs and environmental concerns but is poised for growth with ongoing technological advancements and government support. Prospects include global expansion, technological innovation, and integration with other renewables in hybrid systems, making the market dynamic and promising for a diverse and resilient energy landscape.
Market Dynamics
Market Trends- The tidal power generation equipment market is poised for growth as the world transitions to renewable energy sources.
The global transition to renewable energy, the tidal power generation equipment market is growing. Rising investments and ongoing project developments, along with advancements in turbine design and materials, are boosting market competitiveness. Aligned with international carbon neutrality initiatives, the sector contributes significantly to diversifying renewable energy portfolios. Governments are propelling market expansion through supportive policies, grants, and streamlined regulations. Collaborations involving governments, private entities, and research institutions are fostering innovation, establishing tidal power as a pivotal player in the shift toward sustainable energy sources.
Market Driver- The global demand for tidal power generation equipment is being driven by technological advancements that make this renewable energy source more efficient and cost-effective.
The global demand for tidal power generation equipment is surging due to advancements enhancing efficiency and cost-effectiveness. Notable technological innovations in materials, design, and control systems have bolstered the performance of tidal energy systems. Market trends indicate significant growth, with a focus on key players, emerging opportunities, and regional dynamics. Tidal power's environmental benefits and sustainability are increasingly emphasized, positioning it as a promising contributor to carbon emissions reduction. Government policies, incentives, and regulatory frameworks play a crucial role in shaping the industry landscape. Addressing challenges like environmental concerns, infrastructure development, and financing is imperative for the sector's long-term viability. Comparative analyses with other renewable sources, real-world case studies, and insights into investment trends provide a comprehensive perspective on the current state and prospects of the tidal power generation equipment market.
Market Opportunity- Government initiatives and regulatory frameworks play a crucial role in fostering growth and development in the tidal power generation equipment market.
Government initiatives and regulatory frameworks are pivotal in propelling the growth of the tidal power generation equipment market. This influence extends globally, with varying approaches among countries and regions. Incentives, subsidies, and financial support programs play a key role, illustrated by successful projects benefiting from government backing. The direct impact of policies on market dynamics, investment patterns, and technological advancements is evident, highlighting the crucial interplay between regulatory environments and industry decisions. Compliance with standards and environmental regulations is imperative, shaping the industry's credibility and addressing the delicate balance between renewable energy development and environmental protection. Successful public-private partnerships demonstrate the collaborative potential between governments and private entities, fostering innovation and sustainable growth.
Market Share Analysis- Single-library Unidirectional Station Tidal Power Generation Equipment Market will register the fastest growth
The Global Tidal Power Generation Equipment Market is analyzed across Single-library Unidirectional Stations, Single-library Bi-directional Stations, Double-library Bi-directional Stations, and others. Single-library Unidirectional Station is poised to register the fastest growth. The market for single-library unidirectional station tidal power generation equipment is characterized by its focus on efficient power generation from tidal resources. This specialized equipment, designed for single-library applications, is influenced by technological advancements, government support, and regulatory frameworks. Key factors include efficiency, reliability, and adherence to industry standards. With the increasing demand for sustainable energy solutions, this market is poised for growth, presenting opportunities for innovation and collaboration among industry stakeholders.
Market Share Analysis- Industrial held a significant market share in 2023
The Global Product Engineering Service Market is analyzed across various applications including Industrial, Commercial, and others. Of these, Industrial held a significant market share in 2023. The industrial tidal power generation equipment market focuses on delivering efficient and sustainable energy solutions tailored for industrial applications. Key drivers include technological advancements, government support, and regulatory frameworks promoting tidal energy adoption. Emphasizing efficiency, reliability, and adherence to industry standards, this market responds to the growing demand for cleaner energy in industrial operations, presenting opportunities for innovation and collaboration within the industry.
Tidal Power Generation Equipment Market News
Hydro Wing has revealed its intentions to implement a tidal energy project in Wales, securing a contract for a 10 MW tidal Stream Energy initiative as part of the UK government's most recent Contract for Difference round.
CalWave initiates California's inaugural long-term wave energy project, marking a significant advancement in the state's pursuit of sustainable energy solutions.
Tidal Power Generation Equipment Market Segmentation
By Type
- Single-library Unidirectional Station
- Single-library Bi-directional Station
- Double-library Bi-directional Station
By Application
By Region
- North America (United States, Canada, Mexico)
- Europe (Germany, France, United Kingdom, Spain, Italy, Others)
- Asia Pacific (China, India, Japan, South Korea, Australia, Others)
- Latin America (Brazil, Argentina, Others)
- Middle East and Africa (Saudi Arabia, UAE, Kuwait, Other Middle East, South Africa, Nigeria, Other Africa)
Tidal Power Generation Equipment Market Companies
- Atlantis Resources
- Ocean Power Technologies
- Tidal Energy
- Tenax Energy
- AquaGen Technologies
- Aquamarine Power
- Alternative Energy
- Ocean Renewable Power
- S.D.E. Energy
- Marine Current Turbines
*List not exhaustive
Tidal Power Generation Equipment Market Outlook 2023
1 Market Overview
1.1 Introduction to the Tidal Power Generation Equipment Market
1.2 Scope of the Study
1.3 Research Objective
1.3.1 Key Market Scope and Segments
1.3.2 Players Covered
1.3.3 Years Considered
2 Executive Summary
2.1 2023 Tidal Power Generation Equipment Industry- Market Statistics
3 Market Dynamics
3.1 Market Drivers
3.2 Market Challenges
3.3 Market Opportunities
3.4 Market Trends
4 Market Factor Analysis
4.1 Porter’s Five Forces
4.2 Market Entropy
4.2.1 Global Tidal Power Generation Equipment Market Companies with Area Served
4.2.2 Products Offerings Global Tidal Power Generation Equipment Market
5 COVID-19 Impact Analysis and Outlook Scenarios
5.1.1 Covid-19 Impact Analysis
5.1.2 post-COVID-19 Scenario- Low Growth Case
5.1.3 post-COVID-19 Scenario- Reference Growth Case
5.1.4 post-COVID-19 Scenario- Low Growth Case
6 Global Tidal Power Generation Equipment Market Trends
6.1 Global Tidal Power Generation Equipment Revenue (USD Million) and CAGR (%) by Type (2018-2030)
6.2 Global Tidal Power Generation Equipment Revenue (USD Million) and CAGR (%) by Applications (2018-2030)
6.3 Global Tidal Power Generation Equipment Revenue (USD Million) and CAGR (%) by regions (2018-2030)
7 Global Tidal Power Generation Equipment Market Revenue (USD Million) by Type, and Applications (2018-2022)
7.1 Global Tidal Power Generation Equipment Revenue (USD Million) by Type (2018-2022)
7.1.1 Global Tidal Power Generation Equipment Revenue (USD Million), Market Share (%) by Type (2018-2022)
7.2 Global Tidal Power Generation Equipment Revenue (USD Million) by Applications (2018-2022)
7.2.1 Global Tidal Power Generation Equipment Revenue (USD Million), Market Share (%) by Applications (2018-2022)
8 Global Tidal Power Generation Equipment Development Regional Status and Outlook
8.1 Global Tidal Power Generation Equipment Revenue (USD Million) By Regions (2018-2022)
8.2 North America Tidal Power Generation Equipment Revenue (USD Million) by Type, and Application (2018-2022)
8.2.1 North America Tidal Power Generation Equipment Revenue (USD Million) by Country (2018-2022)
8.2.2 North America Tidal Power Generation Equipment Revenue (USD Million) by Type (2018-2022)
8.2.3 North America Tidal Power Generation Equipment Revenue (USD Million) by Applications (2018-2022)
8.3 Europe Tidal Power Generation Equipment Revenue (USD Million), by Type, and Applications (USD Million) (2018-2022)
8.3.1 Europe Tidal Power Generation Equipment Revenue (USD Million), by Country (2018-2022)
8.3.2 Europe Tidal Power Generation Equipment Revenue (USD Million) by Type (2018-2022)
8.3.3 Europe Tidal Power Generation Equipment Revenue (USD Million) by Applications (2018-2022)
8.4 Asia Pacific Tidal Power Generation Equipment Revenue (USD Million), and Revenue (USD Million) by Type, and Applications (2018-2022)
8.4.1 Asia Pacific Tidal Power Generation Equipment Revenue (USD Million) by Country (2018-2022)
8.4.2 Asia Pacific Tidal Power Generation Equipment Revenue (USD Million) by Type (2018-2022)
8.4.3 Asia Pacific Tidal Power Generation Equipment Revenue (USD Million) by Applications (2018-2022)
8.5 South America Tidal Power Generation Equipment Revenue (USD Million), by Type, and Applications (2018-2022)
8.5.1 South America Tidal Power Generation Equipment Revenue (USD Million), by Country (2018-2022)
8.5.2 South America Tidal Power Generation Equipment Revenue (USD Million) by Type (2018-2022)
8.5.3 South America Tidal Power Generation Equipment Revenue (USD Million) by Applications (2018-2022)
8.6 Middle East and Africa Tidal Power Generation Equipment Revenue (USD Million), by Type, Technology, Application, Thickness (2018-2022)
8.6.1 Middle East and Africa Tidal Power Generation Equipment Revenue (USD Million) by Country (2018-2022)
8.6.2 Middle East and Africa Tidal Power Generation Equipment Revenue (USD Million) by Type (2018-2022)
8.6.3 Middle East and Africa Tidal Power Generation Equipment Revenue (USD Million) by Applications (2018-2022)
9 Company Profiles
10 Global Tidal Power Generation Equipment Market Revenue (USD Million), by Type, and Applications (2023-2030)
10.1 Global Tidal Power Generation Equipment Revenue (USD Million) and Market Share (%) by Type (2023-2030)
10.1.1 Global Tidal Power Generation Equipment Revenue (USD Million), and Market Share (%) by Type (2023-2030)
10.2 Global Tidal Power Generation Equipment Revenue (USD Million) and Market Share (%) by Applications (2023-2030)
10.2.1 Global Tidal Power Generation Equipment Revenue (USD Million), and Market Share (%) by Applications (2023-2030)
11 Global Tidal Power Generation Equipment Development Regional Status and Outlook Forecast
11.1 Global Tidal Power Generation Equipment Revenue (USD Million) By Regions (2023-2030)
11.2 North America Tidal Power Generation Equipment Revenue (USD Million) by Type, and Applications (2023-2030)
11.2.1 North America Tidal Power Generation Equipment Revenue (USD) Million by Country (2023-2030)
11.2.2 North America Tidal Power Generation Equipment Revenue (USD Million), by Type (2023-2030)
11.2.3 North America Tidal Power Generation Equipment Revenue (USD Million), Market Share (%) by Applications (2023-2030)
11.3 Europe Tidal Power Generation Equipment Revenue (USD Million), by Type, and Applications (2023-2030)
11.3.1 Europe Tidal Power Generation Equipment Revenue (USD Million), by Country (2023-2030)
11.3.2 Europe Tidal Power Generation Equipment Revenue (USD Million), by Type (2023-2030)
11.3.3 Europe Tidal Power Generation Equipment Revenue (USD Million), by Applications (2023-2030)
11.4 Asia Pacific Tidal Power Generation Equipment Revenue (USD Million) by Type, and Applications (2023-2030)
11.4.1 Asia Pacific Tidal Power Generation Equipment Revenue (USD Million), by Country (2023-2030)
11.4.2 Asia Pacific Tidal Power Generation Equipment Revenue (USD Million), by Type (2023-2030)
11.4.3 Asia Pacific Tidal Power Generation Equipment Revenue (USD Million), by Applications (2023-2030)
11.5 South America Tidal Power Generation Equipment Revenue (USD Million), by Type, and Applications (2023-2030)
11.5.1 South America Tidal Power Generation Equipment Revenue (USD Million), by Country (2023-2030)
11.5.2 South America Tidal Power Generation Equipment Revenue (USD Million), by Type (2023-2030)
11.5.3 South America Tidal Power Generation Equipment Revenue (USD Million), by Applications (2023-2030)
11.6 Middle East and Africa Tidal Power Generation Equipment Revenue (USD Million), by Type, and Applications (2023-2030)
11.6.1 Middle East and Africa Tidal Power Generation Equipment Revenue (USD Million), by region (2023-2030)
11.6.2 Middle East and Africa Tidal Power Generation Equipment Revenue (USD Million), by Type (2023-2030)
11.6.3 Middle East and Africa Tidal Power Generation Equipment Revenue (USD Million), by Applications (2023-2030)
12 Methodology and Data Sources
12.1 Methodology/Research Approach
12.1.1 Research Programs/Design
12.1.2 Market Size Estimation
12.1.3 Market Breakdown and Data Triangulation
12.2 Data Sources
12.2.1 Secondary Sources
12.2.2 Primary Sources
12.3 Disclaimer
List of Tables
Table 1 Market Segmentation Analysis
Table 2 Global Tidal Power Generation Equipment Market Companies with Areas Served
Table 3 Products Offerings Global Tidal Power Generation Equipment Market
Table 4 Low Growth Scenario Forecasts
Table 5 Reference Case Growth Scenario
Table 6 High Growth Case Scenario
Table 7 Global Tidal Power Generation Equipment Revenue (USD Million) And CAGR (%) By Type (2018-2030)
Table 8 Global Tidal Power Generation Equipment Revenue (USD Million) And CAGR (%) By Applications (2018-2030)
Table 9 Global Tidal Power Generation Equipment Revenue (USD Million) And CAGR (%) By Regions (2018-2030)
Table 10 Global Tidal Power Generation Equipment Revenue (USD Million) By Type (2018-2022)
Table 11 Global Tidal Power Generation Equipment Revenue Market Share (%) By Type (2018-2022)
Table 12 Global Tidal Power Generation Equipment Revenue (USD Million) By Applications (2018-2022)
Table 13 Global Tidal Power Generation Equipment Revenue Market Share (%) By Applications (2018-2022)
Table 14 Global Tidal Power Generation Equipment Market Revenue (USD Million) By Regions (2018-2022)
Table 15 Global Tidal Power Generation Equipment Market Share (%) By Regions (2018-2022)
Table 16 North America Tidal Power Generation Equipment Revenue (USD Million) By Country (2018-2022)
Table 17 North America Tidal Power Generation Equipment Revenue (USD Million) By Type (2018-2022)
Table 18 North America Tidal Power Generation Equipment Revenue (USD Million) By Applications (2018-2022)
Table 19 Europe Tidal Power Generation Equipment Revenue (USD Million) By Country (2018-2022)
Table 20 Europe Tidal Power Generation Equipment Revenue (USD Million) By Type (2018-2022)
Table 21 Europe Tidal Power Generation Equipment Revenue (USD Million) By Applications (2018-2022)
Table 22 Asia Pacific Tidal Power Generation Equipment Revenue (USD Million) By Country (2018-2022)
Table 23 Asia Pacific Tidal Power Generation Equipment Revenue (USD Million) By Type (2018-2022)
Table 24 Asia Pacific Tidal Power Generation Equipment Revenue (USD Million) By Applications (2018-2022)
Table 25 South America Tidal Power Generation Equipment Revenue (USD Million) By Country (2018-2022)
Table 26 South America Tidal Power Generation Equipment Revenue (USD Million) By Type (2018-2022)
Table 27 South America Tidal Power Generation Equipment Revenue (USD Million) By Applications (2018-2022)
Table 28 Middle East and Africa Tidal Power Generation Equipment Revenue (USD Million) By Region (2018-2022)
Table 29 Middle East and Africa Tidal Power Generation Equipment Revenue (USD Million) By Type (2018-2022)
Table 30 Middle East and Africa Tidal Power Generation Equipment Revenue (USD Million) By Applications (2018-2022)
Table 31 Financial Analysis
Table 32 Global Tidal Power Generation Equipment Revenue (USD Million) By Type (2023-2030)
Table 33 Global Tidal Power Generation Equipment Revenue Market Share (%) By Type (2023-2030)
Table 34 Global Tidal Power Generation Equipment Revenue (USD Million) By Applications (2023-2030)
Table 35 Global Tidal Power Generation Equipment Revenue Market Share (%) By Applications (2023-2030)
Table 36 Global Tidal Power Generation Equipment Market Revenue (USD Million), And Revenue (USD Million) By Regions (2023-2030)
Table 37 North America Tidal Power Generation Equipment Revenue (USD)By Country (2023-2030)
Table 38 North America Tidal Power Generation Equipment Revenue (USD Million) By Type (2023-2030)
Table 39 North America Tidal Power Generation Equipment Revenue (USD Million) By Applications (2023-2030)
Table 40 Europe Tidal Power Generation Equipment Revenue (USD Million) By Country (2023-2030)
Table 41 Europe Tidal Power Generation Equipment Revenue (USD Million) By Type (2023-2030)
Table 42 Europe Tidal Power Generation Equipment Revenue (USD Million) By Applications (2023-2030)
Table 43 Asia Pacific Tidal Power Generation Equipment Revenue (USD Million) By Country (2023-2030)
Table 44 Asia Pacific Tidal Power Generation Equipment Revenue (USD Million) By Type (2023-2030)
Table 45 Asia Pacific Tidal Power Generation Equipment Revenue (USD Million) By Applications (2023-2030)
Table 46 South America Tidal Power Generation Equipment Revenue (USD Million) By Country (2023-2030)
Table 47 South America Tidal Power Generation Equipment Revenue (USD Million) By Type (2023-2030)
Table 48 South America Tidal Power Generation Equipment Revenue (USD Million) By Applications (2023-2030)
Table 49 Middle East and Africa Tidal Power Generation Equipment Revenue (USD Million) By Region (2023-2030)
Table 50 Middle East and Africa Tidal Power Generation Equipment Revenue (USD Million) By Region (2023-2030)
Table 51 Middle East and Africa Tidal Power Generation Equipment Revenue (USD Million) By Type (2023-2030)
Table 52 Middle East and Africa Tidal Power Generation Equipment Revenue (USD Million) By Applications (2023-2030)
Table 53 Research Programs/Design for This Report
Table 54 Key Data Information from Secondary Sources
Table 55 Key Data Information from Primary Sources
List of Figures
Figure 1 Market Scope
Figure 2 Porter’s Five Forces
Figure 3 Global Tidal Power Generation Equipment Revenue (USD Million) By Type (2018-2022)
Figure 4 Global Tidal Power Generation Equipment Revenue Market Share (%) By Type (2022)
Figure 5 Global Tidal Power Generation Equipment Revenue (USD Million) By Applications (2018-2022)
Figure 6 Global Tidal Power Generation Equipment Revenue Market Share (%) By Applications (2022)
Figure 7 Global Tidal Power Generation Equipment Market Revenue (USD Million) By Regions (2018-2022)
Figure 8 Global Tidal Power Generation Equipment Market Share (%) By Regions (2022)
Figure 9 North America Tidal Power Generation Equipment Revenue (USD Million) By Country (2018-2022)
Figure 10 North America Tidal Power Generation Equipment Revenue (USD Million) By Type (2018-2022)
Figure 11 North America Tidal Power Generation Equipment Revenue (USD Million) By Applications (2018-2022)
Figure 12 Europe Tidal Power Generation Equipment Revenue (USD Million) By Country (2018-2022)
Figure 13 Europe Tidal Power Generation Equipment Revenue (USD Million) By Type (2018-2022)
Figure 14 Europe Tidal Power Generation Equipment Revenue (USD Million) By Applications (2018-2022)
Figure 15 Asia Pacific Tidal Power Generation Equipment Revenue (USD Million) By Country (2018-2022)
Figure 16 Asia Pacific Tidal Power Generation Equipment Revenue (USD Million) By Type (2018-2022)
Figure 17 Asia Pacific Tidal Power Generation Equipment Revenue (USD Million) By Applications (2018-2022)
Figure 18 South America Tidal Power Generation Equipment Revenue (USD Million) By Country (2018-2022)
Figure 19 South America Tidal Power Generation Equipment Revenue (USD Million) By Type (2018-2022)
Figure 20 South America Tidal Power Generation Equipment Revenue (USD Million) By Applications (2018-2022)
Figure 21 Middle East and Africa Tidal Power Generation Equipment Revenue (USD Million) By Region (2018-2022)
Figure 22 Middle East and Africa Tidal Power Generation Equipment Revenue (USD Million) By Type (2018-2022)
Figure 23 Middle East and Africa Tidal Power Generation Equipment Revenue (USD Million) By Applications (2018-2022)
Figure 24 Global Tidal Power Generation Equipment Revenue (USD Million) By Type (2023-2030)
Figure 25 Global Tidal Power Generation Equipment Revenue Market Share (%) By Type (2030)
Figure 26 Global Tidal Power Generation Equipment Revenue (USD Million) By Applications (2023-2030)
Figure 27 Global Tidal Power Generation Equipment Revenue Market Share (%) By Applications (2030)
Figure 28 Global Tidal Power Generation Equipment Market Revenue (USD Million) By Regions (2023-2030)
Figure 29 North America Tidal Power Generation Equipment Revenue (USD Million) By Country (2023-2030)
Figure 30 North America Tidal Power Generation Equipment Revenue (USD Million) By Type (2023-2030)
Figure 31 North America Tidal Power Generation Equipment Revenue (USD Million) By Applications (2023-2030)
Figure 32 Europe Tidal Power Generation Equipment Revenue (USD Million) By Country (2023-2030)
Figure 33 Europe Tidal Power Generation Equipment Revenue (USD Million) By Type (2023-2030)
Figure 34 Europe Tidal Power Generation Equipment Revenue (USD Million) By Applications (2023-2030)
Figure 35 Asia Pacific Tidal Power Generation Equipment Revenue (USD Million) By Country (2023-2030)
Figure 36 Asia Pacific Tidal Power Generation Equipment Revenue (USD Million) By Type (2023-2030)
Figure 37 Asia Pacific Tidal Power Generation Equipment Revenue (USD Million) By Applications (2023-2030)
Figure 38 South America Tidal Power Generation Equipment Revenue (USD Million) By Country (2023-2030)
Figure 39 South America Tidal Power Generation Equipment Revenue (USD Million) By Type (2023-2030)
Figure 40 South America Tidal Power Generation Equipment Revenue (USD Million) By Applications (2023-2030)
Figure 41 Middle East and Africa Tidal Power Generation Equipment Revenue (USD Million) By Region (2023-2030)
Figure 42 Middle East and Africa Tidal Power Generation Equipment Revenue (USD Million) By Region (2023-2030)
Figure 43 Middle East and Africa Tidal Power Generation Equipment Revenue (USD Million) By Type (2023-2030)
Figure 44 Middle East and Africa Tidal Power Generation Equipment Revenue (USD Million) By Applications (2023-2030)
Figure 45 Bottom-Up and Top-Down Approaches for This Report
Figure 46 Data Triangulation
