Activated Carbon Market Size, Value, and Competitive Overview:
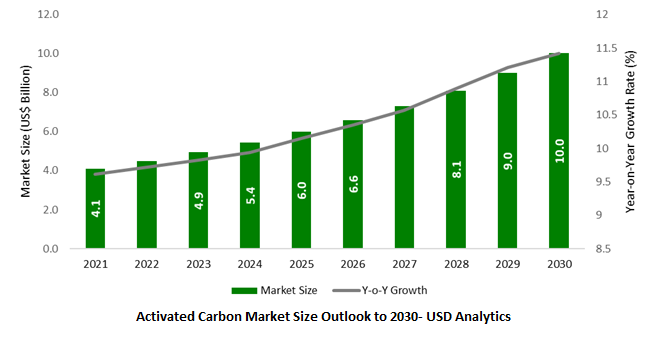
[200 Pages Research Report] The global Activated Carbon market size is valued at $4.8 billion in 2023 in terms of value and is projected to reach $10.79 billion by 2030, growing at a CAGR of 10.65%. The following figure shows the global Activated Carbon market for the time period 2021 to 2030-
Market Trends- Unlocking Sustainability: Carbon Reactivation Services Revolutionize the Activated Carbon Market
Carbon reactivation process involving the thermal reactivation of spent or used activated carbon is a key trend driving up the market potential for activated carbon. As the regeneration enables the reuse of activated carbon instead of being disposed, it contributes significantly to sustainability and reducing waste. The reactivation process requires less energy and resources compared to the manufacturing of new activated carbon, leading to lower greenhouse gas emissions.
Leading companies such as Cabot Corp, Haycarb PLC, Osaka Gas Chemicals, Calgon Carbon, Jacobi Carbons, Osaka Gas Chemicals, Carbon Activated Corporation, and Desotech are investing significantly in achieving cost savings and achieve circular economy by promoting the reuse and recycling of resources.
Market Drivers- Robust Demand for Mercury Control Applications
Robust demand for activated carbon in mercury control applications is driving up the sales of activated carbon in industrial air purification applications. The table below details the major market drivers for activated carbon in mercury control applications-
| Market Drivers |
Description |
| Industrial Air Purification |
Vendors have expanded their product portfolios to include powdered activated carbon for effective mercury removal in industrial air purification processes. |
| Stringent Regulations |
Stringent regulations, particularly in North America and Western Europe, such as the EPA's Mercury and Air Toxics Standards (MATS), drive the adoption of activated carbon for mercury control in industries like power generation and cement manufacturing. |
| Compliance with Emission Standards |
Industries face increasing pressure to comply with emission standards, and activated carbon offers an efficient solution for mercury removal, helping businesses meet regulatory requirements. |
| Rising Awareness of Mercury Pollution |
Growing awareness of the environmental and health risks associated with mercury pollution has led to a heightened focus on adopting effective mitigation measures, including the use of activated carbon |
Market Share Analysis- Water treatment application held the dominant market share in 2023
The global activated carbon market report is analyzed across wide range of end-user industries including Water Treatment, Food and Beverage Processing, Pharmaceutical and Healthcare, Automotive, Air Purification, and Others.
Of these, the water treatment end-user industry accounted for the largest market share in revenue terms for activated carbon market. Ongoing investments in water treatment from government, industrial and other end-user industries supports the demand for activated carbon.
During 2023, the water treatment application accounted for 43.8% of market share, in revenue terms. The reason for holding such strong market share is attributed to the end-user industry demand growth. Further, air purification also presents robust demand growth outlook over the forecast period to 2030.
Market Dynamics
The activated carbon market is influenced by several dynamic factors that shape its growth and dynamics.
Increasing Water and Air Pollution Concerns: The growing concerns over water and air pollution drive the demand for activated carbon. Activated carbon is widely used in water treatment and air purification systems to remove contaminants and improve water and air quality.
Stringent Environmental Regulations: The implementation of strict environmental regulations regarding water and air quality drives the adoption of activated carbon. Industries need to comply with these regulations leading to increased demand for activated carbon in wastewater treatment plants, industrial emissions control, and other applications.
Growing Demand for Clean and Safe Water: The rising global population and increasing water scarcity have fueled the demand for clean and safe water. Activated carbon plays a crucial role in removing impurities, chemicals, and contaminants from water, making it suitable for various applications, including drinking water.
Technological Advancements: Continuous advancements in manufacturing processes and the development of innovative activated carbon products enhance the performance and efficiency of the material. These advancements contribute to the growth of the market by expanding the range of applications and improving the overall effectiveness of activated carbon.
Shift towards Sustainable Solutions: There is a growing preference for sustainable solutions in various industries. Activated carbon, being a natural and renewable material, aligns with the sustainability goals of many companies, driving its adoption in different sectors.
Increasing Industrial Applications: Activated carbon finds extensive use in industries such as food and beverage, pharmaceuticals, and chemicals. It is utilized for decolorization, deodorization, purification, and the removal of impurities and contaminants, contributing to market growth.
Understanding the market dynamics is crucial for businesses operating in the activated carbon market. By staying abreast of the latest trends, technological advancements, and regulatory changes, companies can identify growth opportunities and develop strategies to capitalize on them effectively
Introduction to the Report
The global Activated Carbon Market is segmented into Type, Application, and Regions. The report covers detailed information on market size, Share, Growth, Value, Volume Analysis, Demand analysis, new market entry, competition insights, market drivers, challenges, opportunities, and Restraints. Further, company profile analysis, company revenue, Strategies, Sales, company acquisition, partnership, mergers, latest trends in the industry, regional and country-level insights, and competitive intelligence data is provided in the research report.
Further, the global market is geographically divided into major regions, and countries including North America, Europe, Asia Pacific, Middle East and Africa, and Latin America. Further, major countries focused in the global study report: United States, Canada, United Kingdom, Spain, Germany, Italy, France, Mexico, Russia, Ukraine, China, Japan, South Korea, India, Singapore, Malaysia, Australia, Qatar, Kingdom of Saudi Arabia, South Africa, Brazil, Argentina, and other countries are covered in the research study.
Activated Carbon Market Segmentation
Type-
• Powder Form
• Granular Form
• Others
Applications-
• Liquid Phase
• Gas Phase
End-Use-
• Water Treatment
• Food and Beverage Processing
• Pharmaceutical and Healthcare
• Automotive
• Air Purification
• Others
Geographical Classification Analysis:
- North America
- Latin America
- Europe
- Middle East and Africa
- Asia Pacific
Regional Insights:
• North American market to remain the most potential segment in the global market during 2022-2030. In the North American region, the United States occupied the highest share of the market in this region, and the US country is projected to follow the same trend over the forecast time 2022-2030, followed by Canada.
• Western European countries hold the dominant share in the regional Activated Carbon Market during the forecast period 2022-2030. Asia Pacific region is expected to be registered as the fastest-growing market in the global market by 2030.
• Most developing countries in the Asia Pacific remain the focus of leading Activated Carbon companies, with a large portion of these companies investing in new entry and business expansion strategies
• The market in the Middle East and Africa Activated Carbon is projected to show prominent growth opportunities in the coming years from 2023-2030. The rising focus from the government of the Middle East and African countries on promoting manufacturing and distribution is mostly contributing to the global market in the MEA region.
• The Latin American Activated Carbon Market registered a substantial share of the global market in 2022, and it is projected to remain its presence in the market.
Activated Carbon Market Competitor Analysis
- CarbPure Technologies LLC
- Boyce Carbon Inc.
- Cabot Corporation
- Kuraray Co., Ltd.
- CarboTech AC GmbH
- Donau Chemie AG
- Haycarb (Pvt) Ltd.
- Jacobi Carbons Group
- Kureha Corporation
- Osaka Gas Chemicals Co., Ltd.
- Evoqua Water Technologies LLC
- Oxbow Activated Carbon LLC
- Carbon Activated Corporation
- Hangzhou Nature Technology Co., Ltd.
- Datong Coal Jinding Activated Carbon Co., Ltd.
- CarbUSA Inc.
- Sorbent JSC
Activated Carbon Market Outlook 2023
1 Market Overview
1.1 Introduction to Activated Carbon Market
1.2 Scope of the Study
1.3 Research Objective
1.3.1 Key Market Scope and Segments
1.3.2 Players Covered
1.3.3 Years Considered
2 Executive Summary
2.1 2023 Activated Carbon Industry- Market Statistics
3 Market Dynamics
3.1 Market Drivers
3.2 Market Challenges
3.3 Market Opportunities
3.4 Market Trends
4 Market Factor Analysis
4.1 Porter’s Five Forces
4.2 Market Entropy
4.2.1 Global Activated Carbon Market Companies with Area Served
4.2.2 Products Offerings Global Activated Carbon Market
5 COVID-19 Impact Analysis and Outlook Scenarios
5.1.1 Covid-19 Impact Analysis
5.1.2 Post-COVID-19 Scenario- Low Growth Case
5.1.3 Post-COVID-19 Scenario- Reference Growth Case
5.1.4 Post-COVID-19 Scenario- Low Growth Case
6 Global Activated Carbon Market Trends
6.1 Global Activated Carbon Revenue (USD Million) and CAGR (%) by Type (2018-2028)
6.2 Global Activated Carbon Revenue (USD Million) and CAGR (%) by Applications (2018-2028)
6.3 Global Activated Carbon Revenue (USD Million) and CAGR (%) by Regions (2018-2028)
7 Global Activated Carbon Market Revenue (USD Million) by Type, and Applications (2018-2022)
7.1 Global Activated Carbon Revenue (USD Million) by Type (2018-2022)
7.1.1 Global Activated Carbon Revenue (USD Million), Market Share (%) by Type (2018-2022)
7.2 Global Activated Carbon Revenue (USD Million) by Applications (2018-2022)
7.2.1 Global Activated Carbon Revenue (USD Million), Market Share (%) by Applications (2018-2022)
8 Global Activated Carbon Development Regional Status and Outlook
8.1 Global Activated Carbon Revenue (USD Million) By Regions (2018-2022)
8.2 North America Activated Carbon Revenue (USD Million) by Type, and Application (2018-2022)
8.2.1 North America Activated Carbon Revenue (USD Million) by Country (2018-2022)
8.2.2 North America Activated Carbon Revenue (USD Million) by Type (2018-2022)
8.2.3 North America Activated Carbon Revenue (USD Million) by Applications (2018-2022)
8.3 Europe Activated Carbon Revenue (USD Million), by Type, and Applications (USD Million) (2018-2022)
8.3.1 Europe Activated Carbon Revenue (USD Million), by Country (2018-2022)
8.3.2 Europe Activated Carbon Revenue (USD Million) by Type (2018-2022)
8.3.3 Europe Activated Carbon Revenue (USD Million) by Applications (2018-2022)
8.4 Asia Pacific Activated Carbon Revenue (USD Million), and Revenue (USD Million) by Type, and Applications (2018-2022)
8.4.1 Asia Pacific Activated Carbon Revenue (USD Million) by Country (2018-2022)
8.4.2 Asia Pacific Activated Carbon Revenue (USD Million) by Type (2018-2022)
8.4.3 Asia Pacific Activated Carbon Revenue (USD Million) by Applications (2018-2022)
8.5 South America Activated Carbon Revenue (USD Million), by Type, and Applications (2018-2022)
8.5.1 South America Activated Carbon Revenue (USD Million), by Country (2018-2022)
8.5.2 South America Activated Carbon Revenue (USD Million) by Type (2018-2022)
8.5.3 South America Activated Carbon Revenue (USD Million) by Applications (2018-2022)
8.6 Middle East and Africa Activated Carbon Revenue (USD Million), by Type, Technology, Application, Thickness (2018-2022)
8.6.1 Middle East and Africa Activated Carbon Revenue (USD Million) by Country (2018-2022)
8.6.2 Middle East and Africa Activated Carbon Revenue (USD Million) by Type (2018-2022)
8.6.3 Middle East and Africa Activated Carbon Revenue (USD Million) by Applications (2018-2022)
9 Company Profiles
- CarbPure Technologies LLC
- Boyce Carbon Inc.
- Cabot Corporation
- Kuraray Co., Ltd.
- CarboTech AC GmbH
- Donau Chemie AG
- Haycarb (Pvt) Ltd.
- Jacobi Carbons Group
- Kureha Corporation
- Osaka Gas Chemicals Co., Ltd.
- Evoqua Water Technologies LLC
- Oxbow Activated Carbon LLC
- Carbon Activated Corporation
- Hangzhou Nature Technology Co., Ltd.
- Datong Coal Jinding Activated Carbon Co., Ltd.
- CarbUSA Inc.
- Sorbent JSC
10 Global Activated Carbon Market Revenue (USD Million), by Type, and Applications (2023-2028)
10.1 Global Activated Carbon Revenue (USD Million) and Market Share (%) by Type (2023-2028)
10.1.1 Global Activated Carbon Revenue (USD Million), and Market Share (%) by Type (2023-2028)
10.2 Global Activated Carbon Revenue (USD Million) and Market Share (%) by Applications (2023-2028)
10.2.1 Global Activated Carbon Revenue (USD Million), and Market Share (%) by Applications (2023-2028)
11 Global Activated Carbon Development Regional Status and Outlook Forecast
11.1 Global Activated Carbon Revenue (USD Million) By Regions (2023-2028)
11.2 North America Activated Carbon Revenue (USD Million) by Type, and Applications (2023-2028)
11.2.1 North America Activated Carbon Revenue (USD) Million by Country (2023-2028)
11.2.2 North America Activated Carbon Revenue (USD Million), by Type (2023-2028)
11.2.3 North America Activated Carbon Revenue (USD Million), Market Share (%) by Applications (2023-2028)
11.3 Europe Activated Carbon Revenue (USD Million), by Type, and Applications (2023-2028)
11.3.1 Europe Activated Carbon Revenue (USD Million), by Country (2023-2028)
11.3.2 Europe Activated Carbon Revenue (USD Million), by Type (2023-2028)
11.3.3 Europe Activated Carbon Revenue (USD Million), by Applications (2023-2028)
11.4 Asia Pacific Activated Carbon Revenue (USD Million) by Type, and Applications (2023-2028)
11.4.1 Asia Pacific Activated Carbon Revenue (USD Million), by Country (2023-2028)
11.4.2 Asia Pacific Activated Carbon Revenue (USD Million), by Type (2023-2028)
11.4.3 Asia Pacific Activated Carbon Revenue (USD Million), by Applications (2023-2028)
11.5 South America Activated Carbon Revenue (USD Million), by Type, and Applications (2023-2028)
11.5.1 South America Activated Carbon Revenue (USD Million), by Country (2023-2028)
11.5.2 South America Activated Carbon Revenue (USD Million), by Type (2023-2028)
11.5.3 South America Activated Carbon Revenue (USD Million), by Applications (2023-2028)
11.6 Middle East and Africa Activated Carbon Revenue (USD Million), by Type, and Applications (2023-2028)
11.6.1 Middle East and Africa Activated Carbon Revenue (USD Million), by Region (2023-2028)
11.6.2 Middle East and Africa Activated Carbon Revenue (USD Million), by Type (2023-2028)
11.6.3 Middle East and Africa Activated Carbon Revenue (USD Million), by Applications (2023-2028)
12 Methodology and Data Sources
12.1 Methodology/Research Approach
12.1.1 Research Programs/Design
12.1.2 Market Size Estimation
12.1.3 Market Breakdown and Data Triangulation
12.2 Data Sources
12.2.1 Secondary Sources
12.2.2 Primary Sources
12.3 Disclaimer
List Of Tables
Table 1 Market Segmentation Analysis
Table 2 Global Activated Carbon Market Companies with Areas Served
Table 3 Products Offerings Global Activated Carbon Market
Table 4 Low Growth Scenario Forecasts
Table 5 Reference Case Growth Scenario
Table 6 High Growth Case Scenario
Table 7 Global Activated Carbon Revenue (USD Million) And CAGR (%) By Type (2018-2028)
Table 8 Global Activated Carbon Revenue (USD Million) And CAGR (%) By Applications (2018-2028)
Table 9 Global Activated Carbon Revenue (USD Million) And CAGR (%) By Regions (2018-2028)
Table 10 Global Activated Carbon Revenue (USD Million) By Type (2018-2022)
Table 11 Global Activated Carbon Revenue Market Share (%) By Type (2018-2022)
Table 12 Global Activated Carbon Revenue (USD Million) By Applications (2018-2022)
Table 13 Global Activated Carbon Revenue Market Share (%) By Applications (2018-2022)
Table 14 Global Activated Carbon Market Revenue (USD Million) By Regions (2018-2022)
Table 15 Global Activated Carbon Market Share (%) By Regions (2018-2022)
Table 16 North America Activated Carbon Revenue (USD Million) By Country (2018-2022)
Table 17 North America Activated Carbon Revenue (USD Million) By Type (2018-2022)
Table 18 North America Activated Carbon Revenue (USD Million) By Applications (2018-2022)
Table 19 Europe Activated Carbon Revenue (USD Million) By Country (2018-2022)
Table 20 Europe Activated Carbon Revenue (USD Million) By Type (2018-2022)
Table 21 Europe Activated Carbon Revenue (USD Million) By Applications (2018-2022)
Table 22 Asia Pacific Activated Carbon Revenue (USD Million) By Country (2018-2022)
Table 23 Asia Pacific Activated Carbon Revenue (USD Million) By Type (2018-2022)
Table 24 Asia Pacific Activated Carbon Revenue (USD Million) By Applications (2018-2022)
Table 25 South America Activated Carbon Revenue (USD Million) By Country (2018-2022)
Table 26 South America Activated Carbon Revenue (USD Million) By Type (2018-2022)
Table 27 South America Activated Carbon Revenue (USD Million) By Applications (2018-2022)
Table 28 Middle East and Africa Activated Carbon Revenue (USD Million) By Region (2018-2022)
Table 29 Middle East and Africa Activated Carbon Revenue (USD Million) By Type (2018-2022)
Table 30 Middle East and Africa Activated Carbon Revenue (USD Million) By Applications (2018-2022)
Table 31 Financial Analysis
Table 32 Global Activated Carbon Revenue (USD Million) By Type (2023-2028)
Table 33 Global Activated Carbon Revenue Market Share (%) By Type (2023-2028)
Table 34 Global Activated Carbon Revenue (USD Million) By Applications (2023-2028)
Table 35 Global Activated Carbon Revenue Market Share (%) By Applications (2023-2028)
Table 36 Global Activated Carbon Market Revenue (USD Million), And Revenue (USD Million) By Regions (2023-2028)
Table 37 North America Activated Carbon Revenue (USD)By Country (2023-2028)
Table 38 North America Activated Carbon Revenue (USD Million) By Type (2023-2028)
Table 39 North America Activated Carbon Revenue (USD Million) By Applications (2023-2028)
Table 40 Europe Activated Carbon Revenue (USD Million) By Country (2023-2028)
Table 41 Europe Activated Carbon Revenue (USD Million) By Type (2023-2028)
Table 42 Europe Activated Carbon Revenue (USD Million) By Applications (2023-2028)
Table 43 Asia Pacific Activated Carbon Revenue (USD Million) By Country (2023-2028)
Table 44 Asia Pacific Activated Carbon Revenue (USD Million) By Type (2023-2028)
Table 45 Asia Pacific Activated Carbon Revenue (USD Million) By Applications (2023-2028)
Table 46 South America Activated Carbon Revenue (USD Million) By Country (2023-2028)
Table 47 South America Activated Carbon Revenue (USD Million) By Type (2023-2028)
Table 48 South America Activated Carbon Revenue (USD Million) By Applications (2023-2028)
Table 49 Middle East and Africa Activated Carbon Revenue (USD Million) By Region (2023-2028)
Table 50 Middle East and Africa Activated Carbon Revenue (USD Million) By Region (2023-2028)
Table 51 Middle East and Africa Activated Carbon Revenue (USD Million) By Type (2023-2028)
Table 52 Middle East and Africa Activated Carbon Revenue (USD Million) By Applications (2023-2028)
Table 53 Research Programs/Design for This Report
Table 54 Key Data Information from Secondary Sources
Table 55 Key Data Information from Primary Sources
List Of Figures
Figure 1 Market Scope
Figure 2 Porter’s Five Forces
Figure 3 Global Activated Carbon Revenue (USD Million) By Type (2018-2022)
Figure 4 Global Activated Carbon Revenue Market Share (%) By Type (2022)
Figure 5 Global Activated Carbon Revenue (USD Million) By Applications (2018-2022)
Figure 6 Global Activated Carbon Revenue Market Share (%) By Applications (2022)
Figure 7 Global Activated Carbon Market Revenue (USD Million) By Regions (2018-2022)
Figure 8 Global Activated Carbon Market Share (%) By Regions (2022)
Figure 9 North America Activated Carbon Revenue (USD Million) By Country (2018-2022)
Figure 10 North America Activated Carbon Revenue (USD Million) By Type (2018-2022)
Figure 11 North America Activated Carbon Revenue (USD Million) By Applications (2018-2022)
Figure 12 Europe Activated Carbon Revenue (USD Million) By Country (2018-2022)
Figure 13 Europe Activated Carbon Revenue (USD Million) By Type (2018-2022)
Figure 14 Europe Activated Carbon Revenue (USD Million) By Applications (2018-2022)
Figure 15 Asia Pacific Activated Carbon Revenue (USD Million) By Country (2018-2022)
Figure 16 Asia Pacific Activated Carbon Revenue (USD Million) By Type (2018-2022)
Figure 17 Asia Pacific Activated Carbon Revenue (USD Million) By Applications (2018-2022)
Figure 18 South America Activated Carbon Revenue (USD Million) By Country (2018-2022)
Figure 19 South America Activated Carbon Revenue (USD Million) By Type (2018-2022)
Figure 20 South America Activated Carbon Revenue (USD Million) By Applications (2018-2022)
Figure 21 Middle East and Africa Activated Carbon Revenue (USD Million) By Region (2018-2022)
Figure 22 Middle East and Africa Activated Carbon Revenue (USD Million) By Type (2018-2022)
Figure 23 Middle East and Africa Activated Carbon Revenue (USD Million) By Applications (2018-2022)
Figure 24 Global Activated Carbon Revenue (USD Million) By Type (2023-2028)
Figure 25 Global Activated Carbon Revenue Market Share (%) By Type (2028)
Figure 26 Global Activated Carbon Revenue (USD Million) By Applications (2023-2028)
Figure 27 Global Activated Carbon Revenue Market Share (%) By Applications (2028)
Figure 28 Global Activated Carbon Market Revenue (USD Million) By Regions (2023-2028)
Figure 29 North America Activated Carbon Revenue (USD Million) By Country (2023-2028)
Figure 30 North America Activated Carbon Revenue (USD Million) By Type (2023-2028)
Figure 31 North America Activated Carbon Revenue (USD Million) By Applications (2023-2028)
Figure 32 Europe Activated Carbon Revenue (USD Million) By Country (2023-2028)
Figure 33 Europe Activated Carbon Revenue (USD Million) By Type (2023-2028)
Figure 34 Europe Activated Carbon Revenue (USD Million) By Applications (2023-2028)
Figure 35 Asia Pacific Activated Carbon Revenue (USD Million) By Country (2023-2028)
Figure 36 Asia Pacific Activated Carbon Revenue (USD Million) By Type (2023-2028)
Figure 37 Asia Pacific Activated Carbon Revenue (USD Million) By Applications (2023-2028)
Figure 38 South America Activated Carbon Revenue (USD Million) By Country (2023-2028)
Figure 39 South America Activated Carbon Revenue (USD Million) By Type (2023-2028)
Figure 40 South America Activated Carbon Revenue (USD Million) By Applications (2023-2028)
Figure 41 Middle East and Africa Activated Carbon Revenue (USD Million) By Region (2023-2028)
Figure 42 Middle East and Africa Activated Carbon Revenue (USD Million) By Region (2023-2028)
Figure 43 Middle East and Africa Activated Carbon Revenue (USD Million) By Type (2023-2028)
Figure 44 Middle East and Africa Activated Carbon Revenue (USD Million) By Applications (2023-2028)
Figure 45 Bottom-Up and Top-Down Approaches For This Report
Figure 46 Data Triangulation
